Steve H. Hanke : On the Price of Oil
2016-06-05 IMI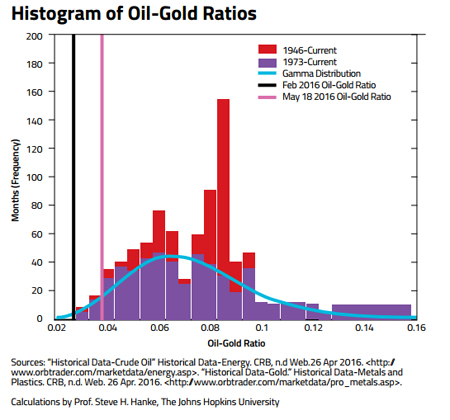 Two things stand out in the histogram: the recent oil price collapse was extreme — the February 2016 oil-gold price ratio is way to the left of the distribution, with less than one percent of the distribution to its left. The second observation is that the ratio is slowly reverting to the mean, with a May 2016 ratio approaching 0.04.
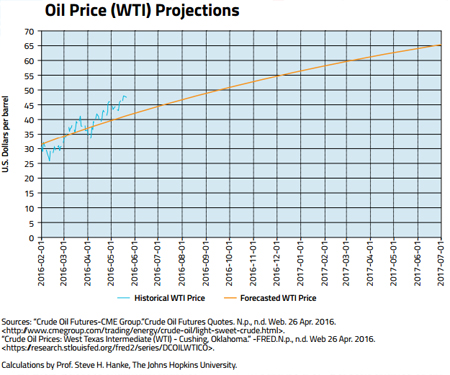
But, how long will it take for the ratio to mean revert? My calculations (based on post-1973 data) are that a 50 percent reversion of the ratio will occur in 13.7 months. This translates into a price per barrel of WTI of $60 by March 2017. It is worth nothing that, like Jastram, I find that oil prices have reverted to the long-run price of gold, rather than the price of gold reverting to that of oil. So, the oil-gold price ratio reverts to its mean via changes in the price of oil.
The accompanying chart shows the price projection based on the oil-gold price ratio model. It also shows the historical course of prices. They are doing just what the golden constant predicts: oil prices are moving up.
Two things stand out in the histogram: the recent oil price collapse was extreme — the February 2016 oil-gold price ratio is way to the left of the distribution, with less than one percent of the distribution to its left. The second observation is that the ratio is slowly reverting to the mean, with a May 2016 ratio approaching 0.04.
But, how long will it take for the ratio to mean revert? My calculations (based on post-1973 data) are that a 50 percent reversion of the ratio will occur in 13.7 months. This translates into a price per barrel of WTI of $60 by March 2017. It is worth nothing that, like Jastram, I find that oil prices have reverted to the long-run price of gold, rather than the price of gold reverting to that of oil. So, the oil-gold price ratio reverts to its mean via changes in the price of oil.
The accompanying chart shows the price projection based on the oil-gold price ratio model. It also shows the historical course of prices. They are doing just what the golden constant predicts: oil prices are moving up.
 The report that motivated this line of inquiry is: R. David Ranson. “Tactical Asset Selection: Implications of Cheap Crude Oil for Its Future Price Trajectory,” Cambria, California: HCWE Worldwide Economics, April 17, 2015.
I would also like to acknowledge excellent research by the following research assistants at The Johns Hopkins Institute for Applied Economics, Global Health, and the Study of Business Enterprise: Stephen Johannesson, Pranay Orugunta, Anshul Subramanya, and Jennifer Zheng.
The report that motivated this line of inquiry is: R. David Ranson. “Tactical Asset Selection: Implications of Cheap Crude Oil for Its Future Price Trajectory,” Cambria, California: HCWE Worldwide Economics, April 17, 2015.
I would also like to acknowledge excellent research by the following research assistants at The Johns Hopkins Institute for Applied Economics, Global Health, and the Study of Business Enterprise: Stephen Johannesson, Pranay Orugunta, Anshul Subramanya, and Jennifer Zheng.
