Hong Hao: The Colliding Cycles of the US and China
2018-09-03 IMI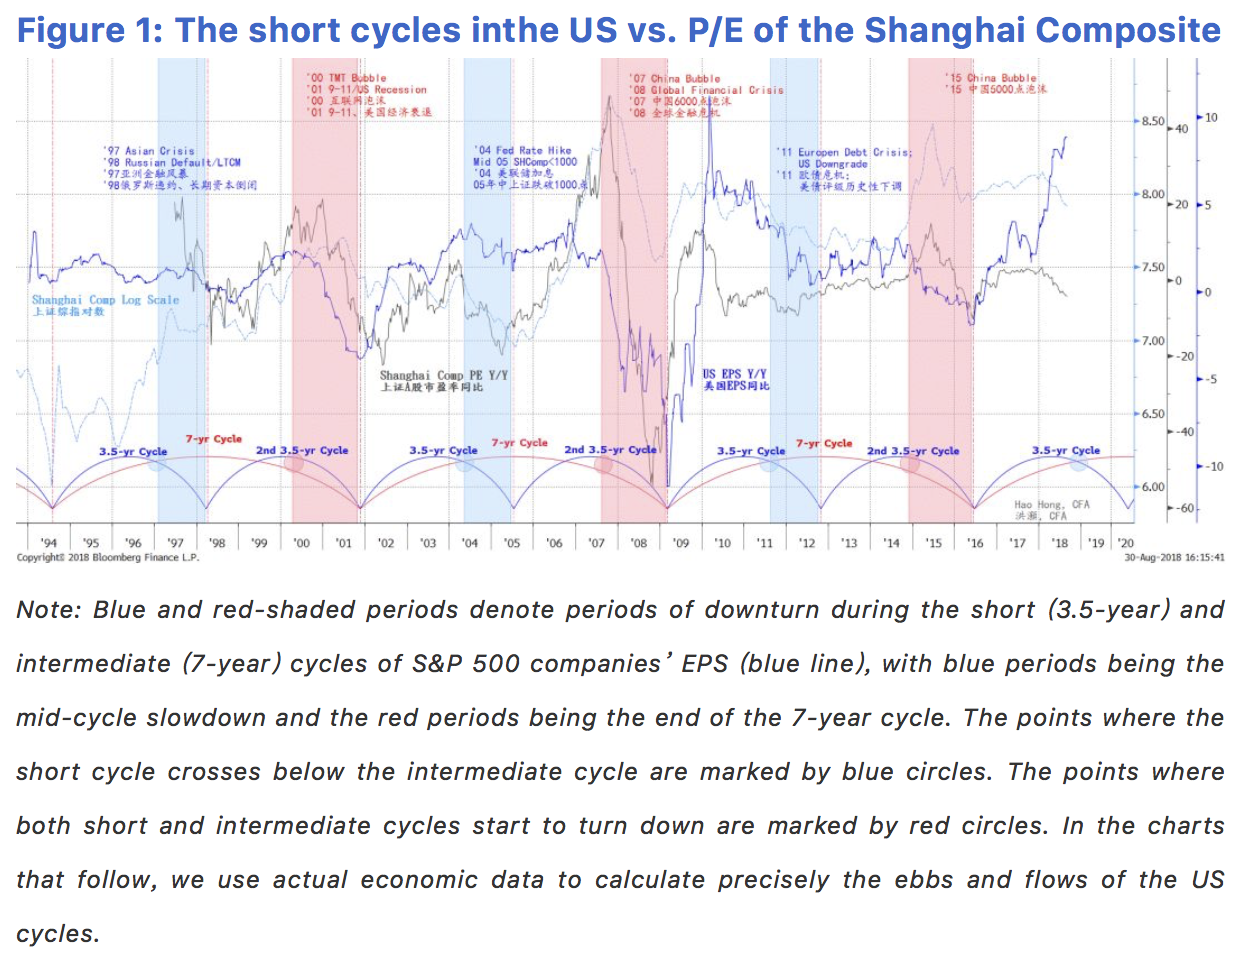 The short cycle in the US
“When in economics we speak of cycles, we generally mean seven to eleven year business cycles … which we shall agree to call ‘intermediate’, the existence of still shorter waves of about three and one-half years length has recently been shown to be probable... The length of the latter (intermediate waves) fluctuates at least between 7and 11 years.” – The Long Waves in Economic Life, Nikolai D. Kondratieff
In Figure 1, we use the adjusted EPS of the S&P500 index as a proxy for the short-term fluctuations in the US economy. Our chart analysis shows that there clearly exists a 3.5-year cycle in the US economy. And two 3.5-year short cycles constitute a complete, trough-to-trough, 7-year intermediate cycle. We observe the followings in Figure 1:
1) There have been six 3.5-year short cycles and three 7-year intermediate cycles since1994 (shown by blue and red arcs along the time axis at the chart bottom). Two of the most recent complete cycles run from Dec 2001 to Dec 2008, and from Dec 2008 to Dec 2015, with mid-2005 and mid-2012 as the cyclical interludes, respectively.
2) In the first 3.5-year short cycle within the 7-year intermediate cycle, when the short cycle finishes its uptrend and then crosses below the intermediate cycle (marked by blue circles), regional crises tend to be concurrent (shown andannotated in blue-shaded periods). For instance, the ’97 Asian Crisis and ’98 Russian Defaults, and the European Sovereign Debt Crisis and the historic US sovereign rating downgrade in 2011. The current crises in Turkey and Argentina appear to be mid-cycle crises of such nature.
3) In the second half of the 7-year intermediate cycle, when both the 3.5-year short cycle and the 7-year intermediate cycle start to decline (marked by red circles), crises of a more significant scale tend to happen. For instance, the burst of the TMT Bubble in 2000, the September-11 and the US recession in 2001, as well as the 2008 Global Financial Crisis (shown and annotated in red-shaded periods). Although much less discussed, the decline in the US stock market in 2001 and2008 are of similar magnitude – both had halved. These two episodes give us reasonable anchor in time to calculate the duration of the cycles. The positive influence the rising trends have on asset prices tends to last longer than the negative impact of the falling trends.
4) History suggests that the snag that global markets are experiencing can be the last legof an 11-year intermediate cycle consisting three 3.5-year short cycles starting from early 2009 and ending in early 2019. But it could also be the first 3.5-yearshort cycle within a renewed intermediate cycle of 7 years, consisting of two3.5-year cycles and starting from early 2016. If so, the emerging turbulence ahead will bear much less significance that the end of an 11-year intermediate cycle would suggest.
5) China’s own 3-year economic cycle is entering its last phase of decline in the coming months. This declining phase in the Chinese cycle happens to coincide with the late cycle in the US 3.5-year short cycle between 4Q18 and 1Q19, as suggested by our model (we will update our model on the Chinese economic cycle in the later part of this report). Expect significant turbulence. This coincidence can well be the reason why the Chinese stock market has been finding it hard tobottom out, albeit having cheapened substantially.
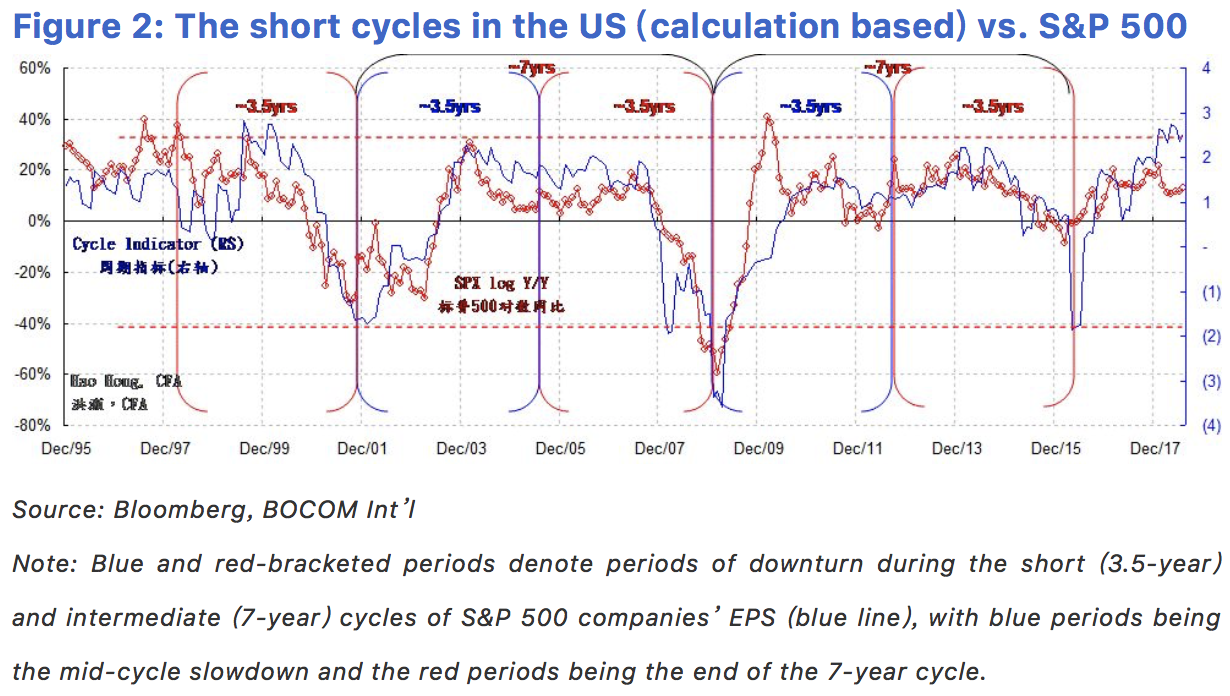
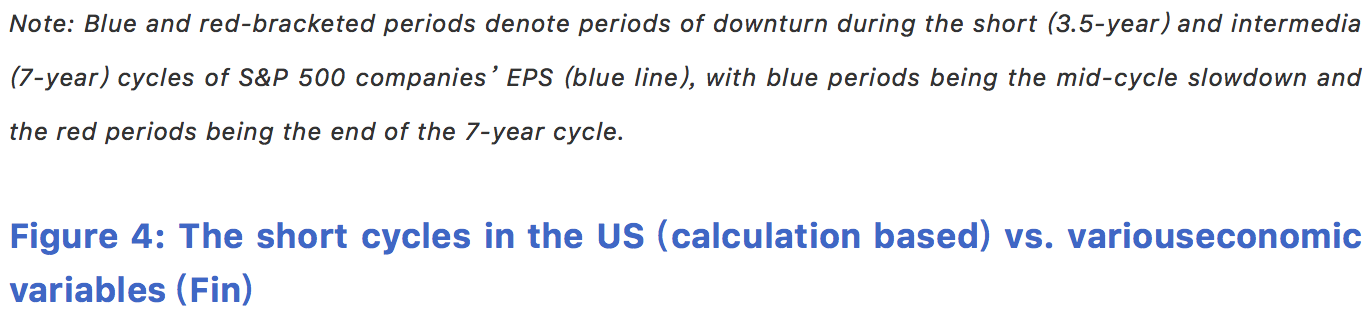
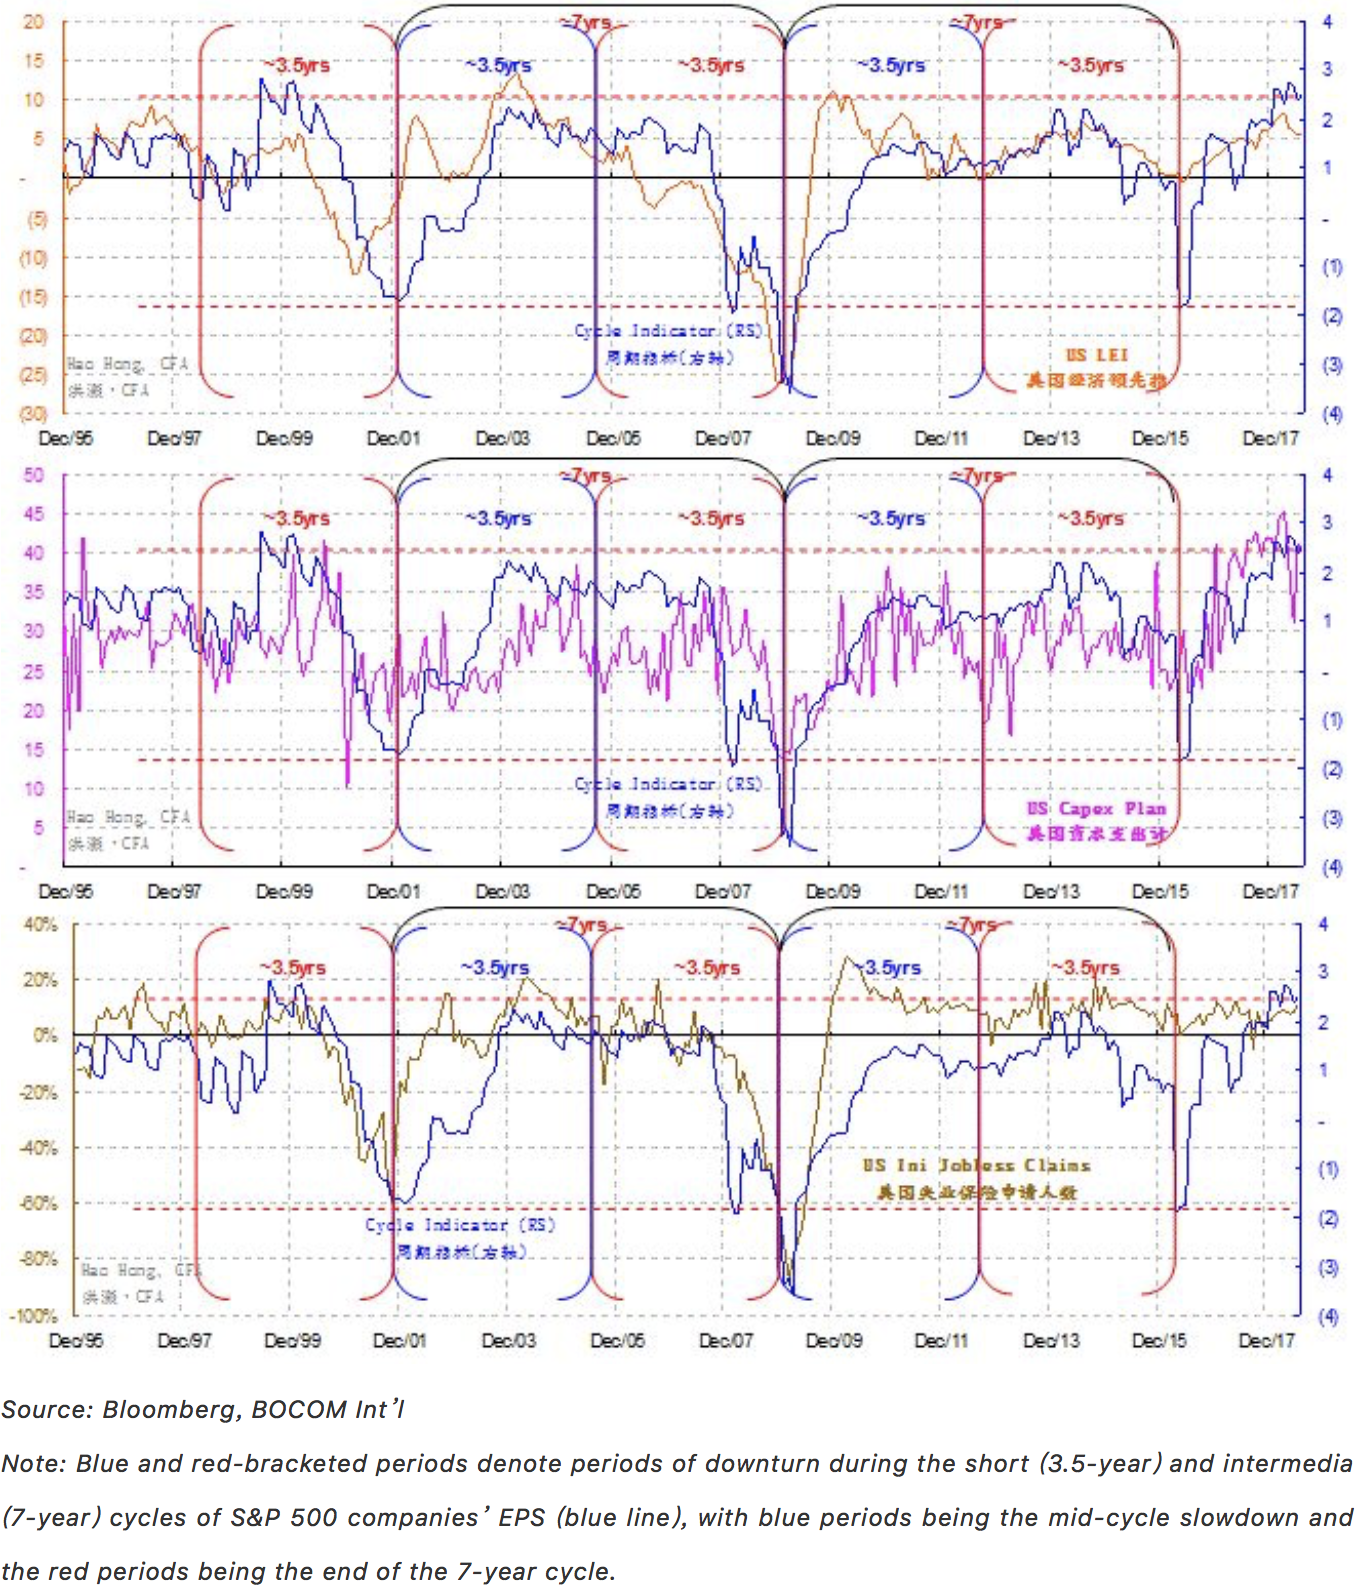
We charted Figure 1 using the Bloomberg charting tools. While intuitive and visually appealing, we need to verify its rigor with quantitative modelling. From Figure 2 to 5, we use monthly adjusted EPS to model the short and intermediate cycles in the US economy. We can demonstrate clearly the 3.5-year short cycle, and the 7-year intermediate cycle consisting of two 3.5-year short cycles in the US economy for overtwo decades in the past.
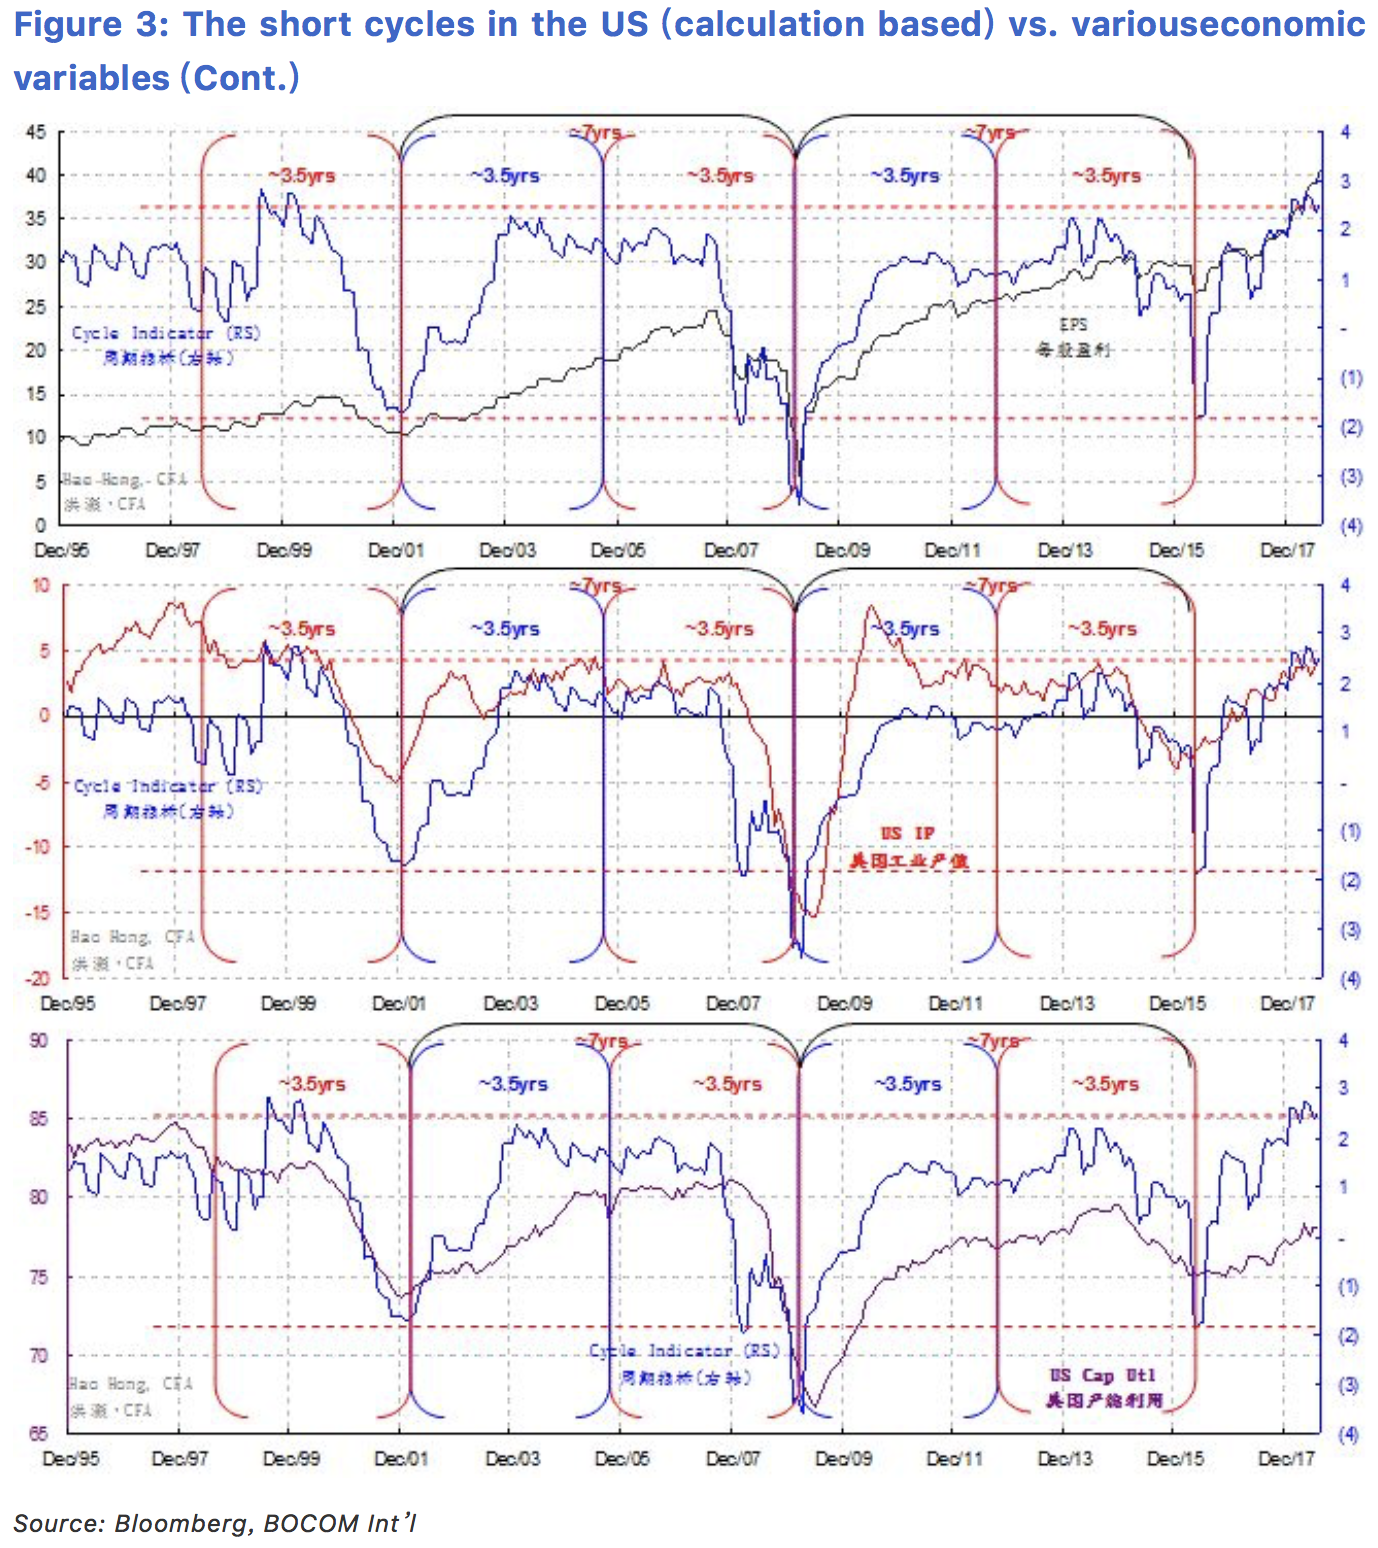
We then overlay other US macroeconomic variables, such as the S&P 500 index, IP, capacity utilization, Leading Economic Indicator, capex plan and employment, with our US Cycle Indicator. Readers can see the very tight correlation between these variables and the Cycle Indicator.
Note that these correlations amongst market price, output, volume or surveys testify the validity of our cyclical model: the cycles identified here cannot be simply dismissed as happenstances. All of these important time series exhibit well-defined time duration of similar length. And their important turning points largely correspond, despite the complicated statistical and mathematical treatments of these data.
Deviation from general rules that prevails in the sequence of the cycles is very rare. Even when there is deviation from the underlying trend, such deviation tends to accelerate or retard its own momentum, rather than that of the underlying trends. The absence of such deviation is also a remarkable proof of the cycle’s existence.
Indeed, the 3.5-year short cycle in the US economy is consistent with the 3-year cycle in China’s economy that we identified in our previous report titled “A DefinitiveGuide to China’s Economic Cycle” (20170323). The intermediate cycles of sixto seven years consisting of two short cycles in these two economies are also consistent.These entwining short and intermediate cycles between the US and China must have profound implications on economic and market performances, as well as policy choices.
The short cycle in the US
“When in economics we speak of cycles, we generally mean seven to eleven year business cycles … which we shall agree to call ‘intermediate’, the existence of still shorter waves of about three and one-half years length has recently been shown to be probable... The length of the latter (intermediate waves) fluctuates at least between 7and 11 years.” – The Long Waves in Economic Life, Nikolai D. Kondratieff
In Figure 1, we use the adjusted EPS of the S&P500 index as a proxy for the short-term fluctuations in the US economy. Our chart analysis shows that there clearly exists a 3.5-year cycle in the US economy. And two 3.5-year short cycles constitute a complete, trough-to-trough, 7-year intermediate cycle. We observe the followings in Figure 1:
1) There have been six 3.5-year short cycles and three 7-year intermediate cycles since1994 (shown by blue and red arcs along the time axis at the chart bottom). Two of the most recent complete cycles run from Dec 2001 to Dec 2008, and from Dec 2008 to Dec 2015, with mid-2005 and mid-2012 as the cyclical interludes, respectively.
2) In the first 3.5-year short cycle within the 7-year intermediate cycle, when the short cycle finishes its uptrend and then crosses below the intermediate cycle (marked by blue circles), regional crises tend to be concurrent (shown andannotated in blue-shaded periods). For instance, the ’97 Asian Crisis and ’98 Russian Defaults, and the European Sovereign Debt Crisis and the historic US sovereign rating downgrade in 2011. The current crises in Turkey and Argentina appear to be mid-cycle crises of such nature.
3) In the second half of the 7-year intermediate cycle, when both the 3.5-year short cycle and the 7-year intermediate cycle start to decline (marked by red circles), crises of a more significant scale tend to happen. For instance, the burst of the TMT Bubble in 2000, the September-11 and the US recession in 2001, as well as the 2008 Global Financial Crisis (shown and annotated in red-shaded periods). Although much less discussed, the decline in the US stock market in 2001 and2008 are of similar magnitude – both had halved. These two episodes give us reasonable anchor in time to calculate the duration of the cycles. The positive influence the rising trends have on asset prices tends to last longer than the negative impact of the falling trends.
4) History suggests that the snag that global markets are experiencing can be the last legof an 11-year intermediate cycle consisting three 3.5-year short cycles starting from early 2009 and ending in early 2019. But it could also be the first 3.5-yearshort cycle within a renewed intermediate cycle of 7 years, consisting of two3.5-year cycles and starting from early 2016. If so, the emerging turbulence ahead will bear much less significance that the end of an 11-year intermediate cycle would suggest.
5) China’s own 3-year economic cycle is entering its last phase of decline in the coming months. This declining phase in the Chinese cycle happens to coincide with the late cycle in the US 3.5-year short cycle between 4Q18 and 1Q19, as suggested by our model (we will update our model on the Chinese economic cycle in the later part of this report). Expect significant turbulence. This coincidence can well be the reason why the Chinese stock market has been finding it hard tobottom out, albeit having cheapened substantially.
We charted Figure 1 using the Bloomberg charting tools. While intuitive and visually appealing, we need to verify its rigor with quantitative modelling. From Figure 2 to 5, we use monthly adjusted EPS to model the short and intermediate cycles in the US economy. We can demonstrate clearly the 3.5-year short cycle, and the 7-year intermediate cycle consisting of two 3.5-year short cycles in the US economy for overtwo decades in the past.
We then overlay other US macroeconomic variables, such as the S&P 500 index, IP, capacity utilization, Leading Economic Indicator, capex plan and employment, with our US Cycle Indicator. Readers can see the very tight correlation between these variables and the Cycle Indicator.
Note that these correlations amongst market price, output, volume or surveys testify the validity of our cyclical model: the cycles identified here cannot be simply dismissed as happenstances. All of these important time series exhibit well-defined time duration of similar length. And their important turning points largely correspond, despite the complicated statistical and mathematical treatments of these data.
Deviation from general rules that prevails in the sequence of the cycles is very rare. Even when there is deviation from the underlying trend, such deviation tends to accelerate or retard its own momentum, rather than that of the underlying trends. The absence of such deviation is also a remarkable proof of the cycle’s existence.
Indeed, the 3.5-year short cycle in the US economy is consistent with the 3-year cycle in China’s economy that we identified in our previous report titled “A DefinitiveGuide to China’s Economic Cycle” (20170323). The intermediate cycles of sixto seven years consisting of two short cycles in these two economies are also consistent.These entwining short and intermediate cycles between the US and China must have profound implications on economic and market performances, as well as policy choices.
 Empirical evidence and policy implications
In afore and later discussions, we have defined with econometrics the 3.5-year and the 3-year short cycles in the US and China.These short cycles ebb and flow with regularity, as we observe similarity and simultaneity of fluctuations across various macroeconomic variables and across countries.The cycles seem to be fluctuating rhythmically around its underlying trend. We would not worry about the difference in duration of two quarters between theshort cycles in the US and China, as cycles are not supposed to work with the precision of a quartz alarm clock.
In his seminal work “The Long Waves in Economic Life”,Kondratieff discussed the difference between the short/intermediate cycle and the long wave. He seemed to disagree with critics who believed that the short to intermediate cycles arose from the capitalistic system conditioned by“casual, extra-economic circumstances and events, such as: 1) changes in technology; 2) wars and revolution; 3) the assimilation of new countries into the world economy; and 4) fluctuations in gold production.” Instead, he believed that these changes that might appear to have altered the course of history were indeed endogenous to the cycles.
For instance, technological advances could have been made years before the turning points in the cycles, but could not be put to productive use given unfavorable economic conditions; war and revolution aroseas the consequence of vying for scarce resources; with the old world growing and desiring for new markets came the assimilation of the new world; and the increase in gold production has been a result of rising monetary demand from economic expansion.
These conjectures, with well-argued reasons and empirical observations, help put the experiences in recent years into perspectives. The PBoC’s liquidity release for reconstruction of shanty towns in 2014, the Chinese market bubble in 2015, Trump’s presidential election win in 2016 and China’s supply-side reform, the subsequent revival of commodity prices since 2016 and the raging trade war are all endogenous to the “capitalistic system”.
While the profound impact of these historic events had rippled through the markets, different supply-demand dynamics during different phases of economic cycles and their subsequent impact on market prices must have been conducive to the observation of these events. And the fluctuation in sentiment concurrent with market prices might have drawn our attention to these occurrences.
If so, as the US 3.5-year short cycle rising to its strength before the inflection point to fall below the 7-year intermediate cycle, it is likely to sway Mr. Trump’s decisions regarding the trade war to an even tougher stance, and eventually lead to a correction in the US market that appears to be going from strength to strength on the outside. Further, such inflection in the US short cycle can come as a surprise to the bullish market consensus, leading to a sudden and significant correction. Eventually, the deceleration phase in China’s 3-year short cycle will lead the US economy down.
Empirical evidence and policy implications
In afore and later discussions, we have defined with econometrics the 3.5-year and the 3-year short cycles in the US and China.These short cycles ebb and flow with regularity, as we observe similarity and simultaneity of fluctuations across various macroeconomic variables and across countries.The cycles seem to be fluctuating rhythmically around its underlying trend. We would not worry about the difference in duration of two quarters between theshort cycles in the US and China, as cycles are not supposed to work with the precision of a quartz alarm clock.
In his seminal work “The Long Waves in Economic Life”,Kondratieff discussed the difference between the short/intermediate cycle and the long wave. He seemed to disagree with critics who believed that the short to intermediate cycles arose from the capitalistic system conditioned by“casual, extra-economic circumstances and events, such as: 1) changes in technology; 2) wars and revolution; 3) the assimilation of new countries into the world economy; and 4) fluctuations in gold production.” Instead, he believed that these changes that might appear to have altered the course of history were indeed endogenous to the cycles.
For instance, technological advances could have been made years before the turning points in the cycles, but could not be put to productive use given unfavorable economic conditions; war and revolution aroseas the consequence of vying for scarce resources; with the old world growing and desiring for new markets came the assimilation of the new world; and the increase in gold production has been a result of rising monetary demand from economic expansion.
These conjectures, with well-argued reasons and empirical observations, help put the experiences in recent years into perspectives. The PBoC’s liquidity release for reconstruction of shanty towns in 2014, the Chinese market bubble in 2015, Trump’s presidential election win in 2016 and China’s supply-side reform, the subsequent revival of commodity prices since 2016 and the raging trade war are all endogenous to the “capitalistic system”.
While the profound impact of these historic events had rippled through the markets, different supply-demand dynamics during different phases of economic cycles and their subsequent impact on market prices must have been conducive to the observation of these events. And the fluctuation in sentiment concurrent with market prices might have drawn our attention to these occurrences.
If so, as the US 3.5-year short cycle rising to its strength before the inflection point to fall below the 7-year intermediate cycle, it is likely to sway Mr. Trump’s decisions regarding the trade war to an even tougher stance, and eventually lead to a correction in the US market that appears to be going from strength to strength on the outside. Further, such inflection in the US short cycle can come as a surprise to the bullish market consensus, leading to a sudden and significant correction. Eventually, the deceleration phase in China’s 3-year short cycle will lead the US economy down.
 The short cycle in China
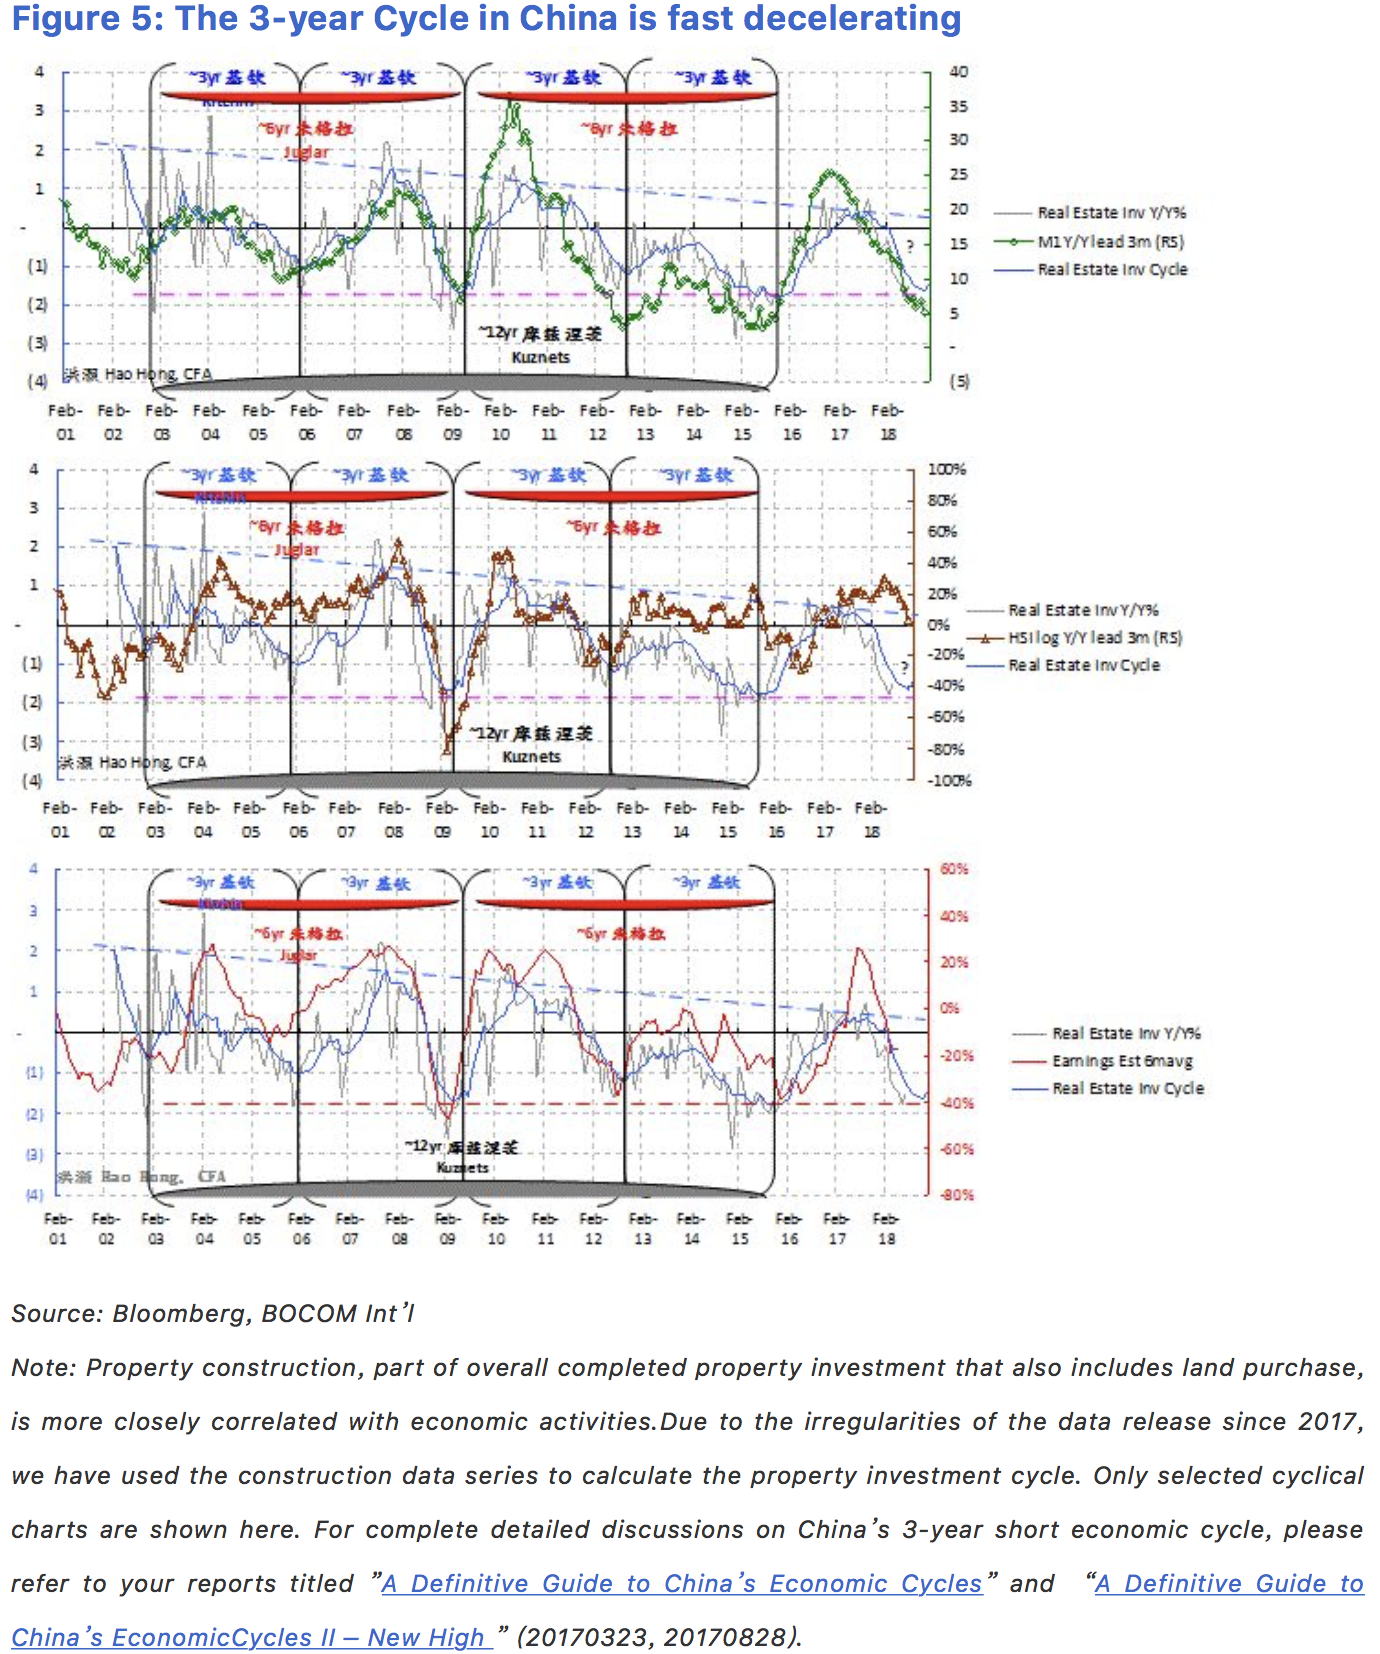
In our initial report on economic cycles with quantitative metrics titled “A Definitive Guide to China’s Economic Cycles” (20170323), we demonstrated the 3-year short cyclein the Chinese economy. We derive our 3-year investment cycle by measuring the deviation of the actual property investment growth data from its long-termtrend. There have been by now almost five, very clearly defined 3-year cycles in China’s economy: 2003-2006, 2006-2009, 2009-2012, 2012-2015, and the last quarter of 2015 till now.
To verify the 3-year short cycle, we compare it with other macroeconomic variables in terms of both volume and price in the Chinese economy. Rebar price, interest rate level, industrial output, stock market indices and earnings forecasts, for instance. We have demonstrated that these variables are closely correlated (Not all comparisons are shown in this report. For detailed discussions on China’s short economic cycle, please refer to ourreport “A Definitive Guide to China’s Economic Cycles” on 20170323). That is, the 3-year short cycle can very well explain the movements in other Chinese macroeconomic variables (Figure 5).
Further, we note that in the past two decades of which period we have data, the trend of investment growth is falling, with lower highs and lower lows in each of the cycle sequentially. This is not difficult to fathom: China’s massive investment scale and increasing leverage are suppressing marginal investment return, and thus limiting the room for further productive investment.
We believe the duration of the 3-year cycle is related to China’s building construction process. For instance, to build a 30-storey residential building, the building completion time is around 9-12 months, water and electrical installation around 3 months, plus some more time for safety inspection and miscellaneous approvals. The total time to completion is around1.5-2 years. Then the building inventory will take up to 1 year to clear, making the building inventory investment cycle to be around 3 years.
We note that the current 3-year short cycle that started from late 2015 to early 2016 has clearly peaked and has been fast decelerating, the momentum in the economic slowdown can intensify and turn even more palpable to consensus in the coming months (Figure 5). As such, risk aversion,while having aggravated in the past few months, will be difficult to dissipate.
The short cycle in China
In our initial report on economic cycles with quantitative metrics titled “A Definitive Guide to China’s Economic Cycles” (20170323), we demonstrated the 3-year short cyclein the Chinese economy. We derive our 3-year investment cycle by measuring the deviation of the actual property investment growth data from its long-termtrend. There have been by now almost five, very clearly defined 3-year cycles in China’s economy: 2003-2006, 2006-2009, 2009-2012, 2012-2015, and the last quarter of 2015 till now.
To verify the 3-year short cycle, we compare it with other macroeconomic variables in terms of both volume and price in the Chinese economy. Rebar price, interest rate level, industrial output, stock market indices and earnings forecasts, for instance. We have demonstrated that these variables are closely correlated (Not all comparisons are shown in this report. For detailed discussions on China’s short economic cycle, please refer to ourreport “A Definitive Guide to China’s Economic Cycles” on 20170323). That is, the 3-year short cycle can very well explain the movements in other Chinese macroeconomic variables (Figure 5).
Further, we note that in the past two decades of which period we have data, the trend of investment growth is falling, with lower highs and lower lows in each of the cycle sequentially. This is not difficult to fathom: China’s massive investment scale and increasing leverage are suppressing marginal investment return, and thus limiting the room for further productive investment.
We believe the duration of the 3-year cycle is related to China’s building construction process. For instance, to build a 30-storey residential building, the building completion time is around 9-12 months, water and electrical installation around 3 months, plus some more time for safety inspection and miscellaneous approvals. The total time to completion is around1.5-2 years. Then the building inventory will take up to 1 year to clear, making the building inventory investment cycle to be around 3 years.
We note that the current 3-year short cycle that started from late 2015 to early 2016 has clearly peaked and has been fast decelerating, the momentum in the economic slowdown can intensify and turn even more palpable to consensus in the coming months (Figure 5). As such, risk aversion,while having aggravated in the past few months, will be difficult to dissipate.