Il Houng Lee: Global Sluggish Growth and Negative Real Interest Rate
2016-12-08 IMI- i) Negative real interest rate could prevail if the economic environment is so unstable that future income is not assured, and thus, risk adjusted return on capital is negative. In such a situation, investors would pay someone (the government) to use the wealth instead to retain at least the value of the principle, or to minimize the erosion of the value relative to when holding it oneself.
- ii) Equivalently, if such a situation prevails, then the value of currently held wealth stock is perceived to be larger in the future than now, i.e., negative discount rate. An agent who tries to maximize consumption over life time will save less if the net present value of his/her wealth (future consumption) rises.
- iii) On a similar vein, if the expected decline in the size of the labor force is such that it will exceed any realistic productivity increase, then as in i) above, negative interest rate could prevail. However, in an open economy, it is likely to lead to a readjustment of capital flows, i.e., capital inflows into a region with expected increase in labor (or productivity).
- iv) From the market’s point of view, if the current debt stock of the economy is larger than its net present value of total future income, the economy will try to deflate itself out of the debt—which is an alternative way of taxing households.The reduction of the value of debt can be more instantaneous with the increase in inflation, but in the absence of inflation, negative real interest rate is an alternative way to chipping away the stock of debt, (unless the value of asset is reduced through a crash).
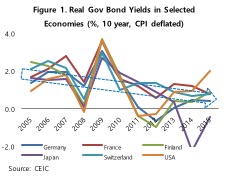 This current episode also differs from the past in that low or negative real interest rates are attributed to the fall in nominal rates and not a sudden rise in high inflation. While it is debatable whether real interest rate should be zero or even negative, based on historic norm, it is on the low side. In fact, real long-term interest rate (defined as the unweighted average of G10 group’s 10-year government debt deflated by CPI) averaged 1½-2%during 1880s and 1990s,or 2½-3% excluding the two war periods (Figure 2).
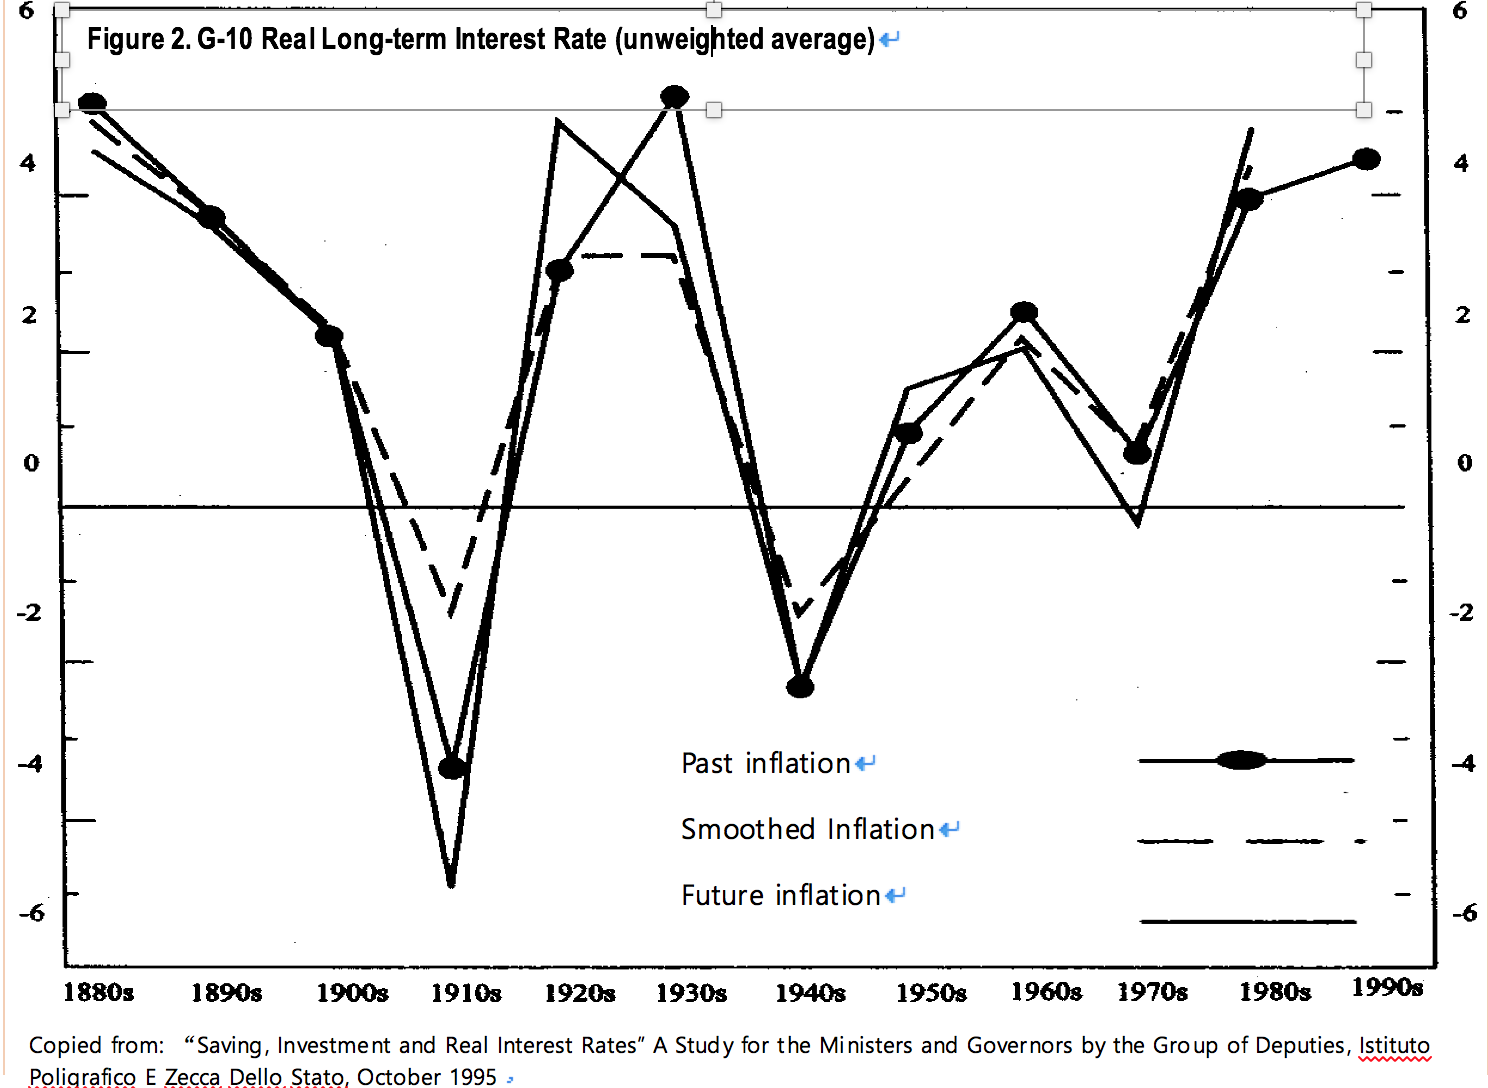 Why the long-term real interest rate was negative during the wars is an issue beyond this paper, but they likely include negative return on capital and were willing to pay a premium for holding government paper (one of the safest way to retain the value of one’s wealth).
Economic history in advanced economies, as captured well in the G10 study, indicate that small positive real interest rate is the “norm” or the market determined neutral rate. More specifically, in the case of the US the average post-war real interest rate (10-year TBs) is around 2½, which is broadly similar to the average of G10 countries.10-year government bond yields fell briefly below zero also during 1974-75, 1979-80, and 2011-12, but largely due to spurts of inflation.
2½-3% excluding the two war periods (Figure 2). Why the long-term real interest rate was negative during the wars is an issue beyond this paper, but they likely include negative return on capital and were willing to pay a premium for holding government paper (one of the safest way to retain the value of one’s wealth).
3.Why neutral real rate of interest may be low
a. Lost opportunity of savings in the past
Savings in advanced economies peaked around 24% of GDP in the late 1980s, and continued to fall, leveling off at around 20% of GDP after a sharp dip following the global financial crisis (Figure 3).
Why the long-term real interest rate was negative during the wars is an issue beyond this paper, but they likely include negative return on capital and were willing to pay a premium for holding government paper (one of the safest way to retain the value of one’s wealth).
Economic history in advanced economies, as captured well in the G10 study, indicate that small positive real interest rate is the “norm” or the market determined neutral rate. More specifically, in the case of the US the average post-war real interest rate (10-year TBs) is around 2½, which is broadly similar to the average of G10 countries.10-year government bond yields fell briefly below zero also during 1974-75, 1979-80, and 2011-12, but largely due to spurts of inflation.
2½-3% excluding the two war periods (Figure 2). Why the long-term real interest rate was negative during the wars is an issue beyond this paper, but they likely include negative return on capital and were willing to pay a premium for holding government paper (one of the safest way to retain the value of one’s wealth).
3.Why neutral real rate of interest may be low
a. Lost opportunity of savings in the past
Savings in advanced economies peaked around 24% of GDP in the late 1980s, and continued to fall, leveling off at around 20% of GDP after a sharp dip following the global financial crisis (Figure 3).
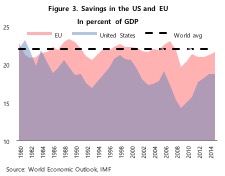 This is broadly comparable to world average savings to PPP weighted GDP over the last 50 years, which was about 22%. The gradual decline since the 2000s is also consistent with the expected savings behavior and global demography. Figure 4 shows how savings rate would have diverged from the average in Europe and the US if households had smoothed their consumption over the long term(based on the UN projection of global demography).
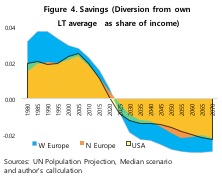 While the accuracy of the estimated magnitude is questionable, at least it provides a rough sense of how savings could have evolved over time if households were rational, i.e., Europe should have saved most during the 1980s, and start dissaving at around 2020. The US case is broadly similar except that its savings should have peaked during the 2000s.
Real government bond yields in China-Japan-Korea (CJK) have been positive and trending down for the last several decades (Figure 5).
While the accuracy of the estimated magnitude is questionable, at least it provides a rough sense of how savings could have evolved over time if households were rational, i.e., Europe should have saved most during the 1980s, and start dissaving at around 2020. The US case is broadly similar except that its savings should have peaked during the 2000s.
Real government bond yields in China-Japan-Korea (CJK) have been positive and trending down for the last several decades (Figure 5).
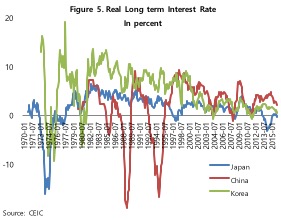 Negative real interest rates were present during the first half of the 1970s in Japan and Korea due to high inflation related in part to oil price as well as global monetary conditions. As for China, high inflation that pushed real interest rate down into negative numbers during the late 1980s and mid 1990s were by-products of rapid transition efforts by the government. In more recent years, Japan’s real interest rate fell below zero in line with several other advanced economies. Long term average (1980-16) of about 2½ % is broadly similar to that of the US. Korea’s s real interest was higher at 5%, reflecting a much faster economic growth during this period. In the case of China, it is difficult to make a simple comparison of longer term development due to the transition period as noted earlier. But still, average real interest rate since 2000 is about 3½ % (compared with 2% for Korea) reflecting higher return on capital.
CJK’s actual savings rates (Figure 6) broadly match the demography-based estimation of savings (obtained in the same way as those elaborated for advanced economies earlier; CJK estimates are shown in Figure 7).
Negative real interest rates were present during the first half of the 1970s in Japan and Korea due to high inflation related in part to oil price as well as global monetary conditions. As for China, high inflation that pushed real interest rate down into negative numbers during the late 1980s and mid 1990s were by-products of rapid transition efforts by the government. In more recent years, Japan’s real interest rate fell below zero in line with several other advanced economies. Long term average (1980-16) of about 2½ % is broadly similar to that of the US. Korea’s s real interest was higher at 5%, reflecting a much faster economic growth during this period. In the case of China, it is difficult to make a simple comparison of longer term development due to the transition period as noted earlier. But still, average real interest rate since 2000 is about 3½ % (compared with 2% for Korea) reflecting higher return on capital.
CJK’s actual savings rates (Figure 6) broadly match the demography-based estimation of savings (obtained in the same way as those elaborated for advanced economies earlier; CJK estimates are shown in Figure 7).
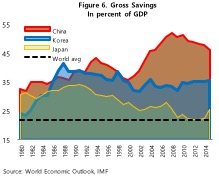
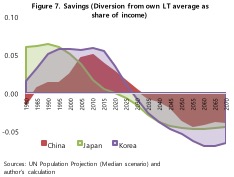 According to the latter, China’s savings should have peaked during the late 2000s, Japan on the other hand, should have peaked during the early 1990s and Korea during 1990-2000. Unlike in the US and Europe, actual savings broadly mirror these estimations.
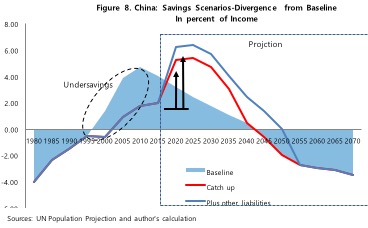
Two factors, however, could push China and Korea(and to a lesser extent Japan) to save more even though there was no lost opportunity to save. First is the recent realization of growing longevity well beyond what was expected one or two decades ago. Second is the gloomier global economic outlook without a clear time horizon for a recovery. Since CK economies are largely export dependent, these changing global prospects also mean slower domestic economic growth. Both factors have strong incentive to push up savings, subjecting them to similar situation as the US and the EU. These points are illustrated in the chart below for China (Figure 8).
According to the latter, China’s savings should have peaked during the late 2000s, Japan on the other hand, should have peaked during the early 1990s and Korea during 1990-2000. Unlike in the US and Europe, actual savings broadly mirror these estimations.
Two factors, however, could push China and Korea(and to a lesser extent Japan) to save more even though there was no lost opportunity to save. First is the recent realization of growing longevity well beyond what was expected one or two decades ago. Second is the gloomier global economic outlook without a clear time horizon for a recovery. Since CK economies are largely export dependent, these changing global prospects also mean slower domestic economic growth. Both factors have strong incentive to push up savings, subjecting them to similar situation as the US and the EU. These points are illustrated in the chart below for China (Figure 8).
 b. Debt and liquidity overhang
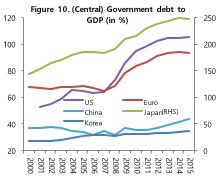
“Other liabilities” in Figure 8 include financial liabilities or public debt (or both although they are not additive by nature). Financial liabilities are intra-generational liabilities and under a well- functioning system would not be an issue as one part of the population owes to another part of the same population. It becomes a concern only when the indebted group is highly income constrained with debt service payments posing a challenge.Public debt has a similar impact on consumption except that its debt service burden is more widely spread through higher future tax burden. Both financial assets and government debt have risen sharply as share of GDP in the last two decades (Figure 9 and 10 respectively).
b. Debt and liquidity overhang
“Other liabilities” in Figure 8 include financial liabilities or public debt (or both although they are not additive by nature). Financial liabilities are intra-generational liabilities and under a well- functioning system would not be an issue as one part of the population owes to another part of the same population. It becomes a concern only when the indebted group is highly income constrained with debt service payments posing a challenge.Public debt has a similar impact on consumption except that its debt service burden is more widely spread through higher future tax burden. Both financial assets and government debt have risen sharply as share of GDP in the last two decades (Figure 9 and 10 respectively).
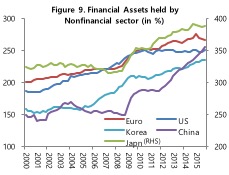
 Financial assets and liabilities are a way of holding savings of one group into the future, to be repaid at a later date. If the size of the financial assets becomes too large relative to the production capacity (i.e., expected income stream), then there is large probability that the value of savings will erode. This can take place through bursting of an asset bubble, gradually through negative real interest rate, sustained high inflation, or through the political process. If the former becomes a systemic risk, it gets converted into the latter as was the case in the US and the EU following global financial crisis.
Conclusion: A question of low consumption now or later
If the estimated demography-based consumption smoothing path during the 1980s-2010s is of any guide, then the rational response of households faced with aging is to catch up, i.e., to save more now relative to the long run average. However, this would mean compression of consumption below the long-term average, discouraging investment. This in turn would suppress growth setting off a vicious cycle. There are two ways to overcome the current low growth trap.
One way to address such a vicious cycle is to push down the real interest rate below the already low neutral rate of interest, possibly into negative rates. This will induce agents to save less. However, if the underlying problem is structural in nature, such a push will only have a temporary effect, and the economy will be in a worse situation in a couple of years, requiring further reduction in the real interest rate. Another way would be to leave the real interest rate as is and let households to make up for their lost opportunity to prepare for aging. This would drag down growth in the short run, but once targeted wealth stock is reached, consumption would recover.
It is not clear which option will deliver better results, or minimize the losses in terms of lifetime consumption. However, if the current problem is structural in nature, the former will only postpone the needed reform and nurture a bigger problem. If left alone, the market will try to correct itself and be accompanied by a reduction in public debt and financial assets with corrective structural reforms setting the stage of a stronger recovery path. In both cases, real interest rate will likely remain below historic average. Yet, pushing it further down into large negative territory through policy rates may risk pushing the real neutral rate down further.
Financial assets and liabilities are a way of holding savings of one group into the future, to be repaid at a later date. If the size of the financial assets becomes too large relative to the production capacity (i.e., expected income stream), then there is large probability that the value of savings will erode. This can take place through bursting of an asset bubble, gradually through negative real interest rate, sustained high inflation, or through the political process. If the former becomes a systemic risk, it gets converted into the latter as was the case in the US and the EU following global financial crisis.
Conclusion: A question of low consumption now or later
If the estimated demography-based consumption smoothing path during the 1980s-2010s is of any guide, then the rational response of households faced with aging is to catch up, i.e., to save more now relative to the long run average. However, this would mean compression of consumption below the long-term average, discouraging investment. This in turn would suppress growth setting off a vicious cycle. There are two ways to overcome the current low growth trap.
One way to address such a vicious cycle is to push down the real interest rate below the already low neutral rate of interest, possibly into negative rates. This will induce agents to save less. However, if the underlying problem is structural in nature, such a push will only have a temporary effect, and the economy will be in a worse situation in a couple of years, requiring further reduction in the real interest rate. Another way would be to leave the real interest rate as is and let households to make up for their lost opportunity to prepare for aging. This would drag down growth in the short run, but once targeted wealth stock is reached, consumption would recover.
It is not clear which option will deliver better results, or minimize the losses in terms of lifetime consumption. However, if the current problem is structural in nature, the former will only postpone the needed reform and nurture a bigger problem. If left alone, the market will try to correct itself and be accompanied by a reduction in public debt and financial assets with corrective structural reforms setting the stage of a stronger recovery path. In both cases, real interest rate will likely remain below historic average. Yet, pushing it further down into large negative territory through policy rates may risk pushing the real neutral rate down further.
