Hong Hao:Cyclical Inflection Point is Confirmed
2019-04-16 IMI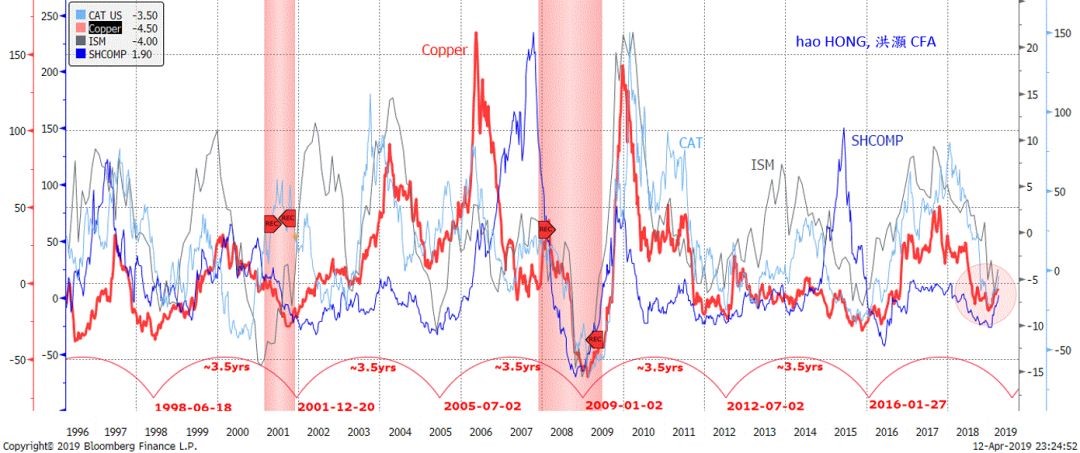 Source: Bloomberg, BOCOM Int'l
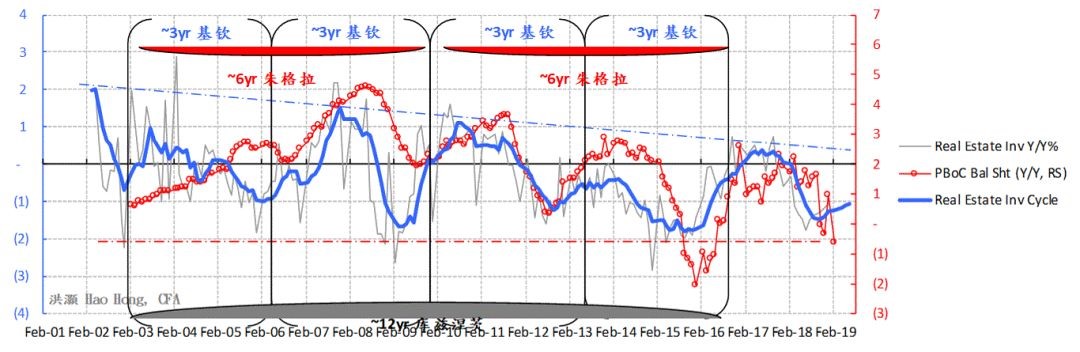
Figure 2: China’s economic cycle is reviving, and so are asset prices (commodities/bonds/currency)
Source: Bloomberg, BOCOM Int'l
Figure 2: China’s economic cycle is reviving, and so are asset prices (commodities/bonds/currency)
 Source: Bloomberg, BOCOM Int'l
Note: Property construction, part of overall completed property investment that also includes land purchase, is more closely correlated with economic activities. Due to the irregularities of the data release since 2017, we have used the construction data series to calculate the property investment cycle. Only selected cyclical charts are shown here. For complete detailed discussions on China’s 3-year short economic cycle, please refer to your reports titled “A Definitive Guide to China’s Economic Cycles” (20170324) and “A Definitive Guide to China’s Economic Cycles II – New High” (20170828).
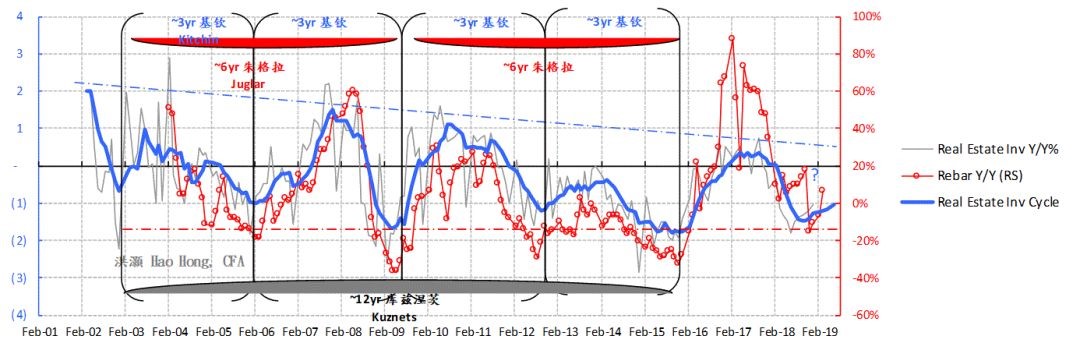
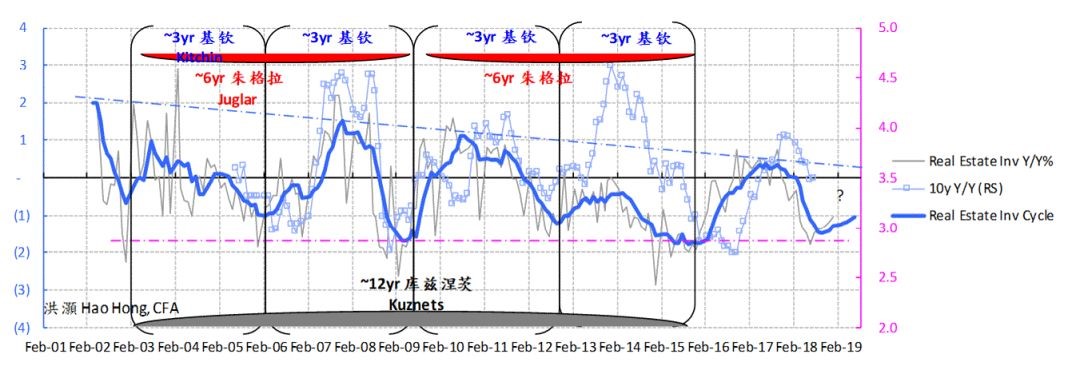
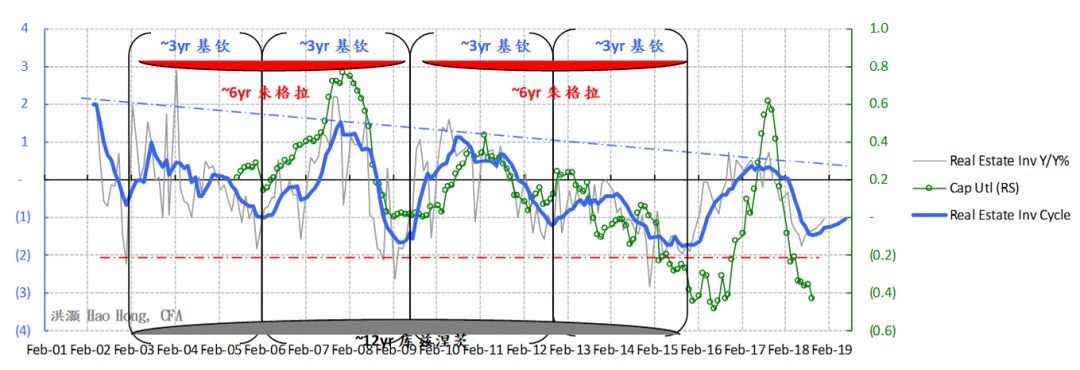
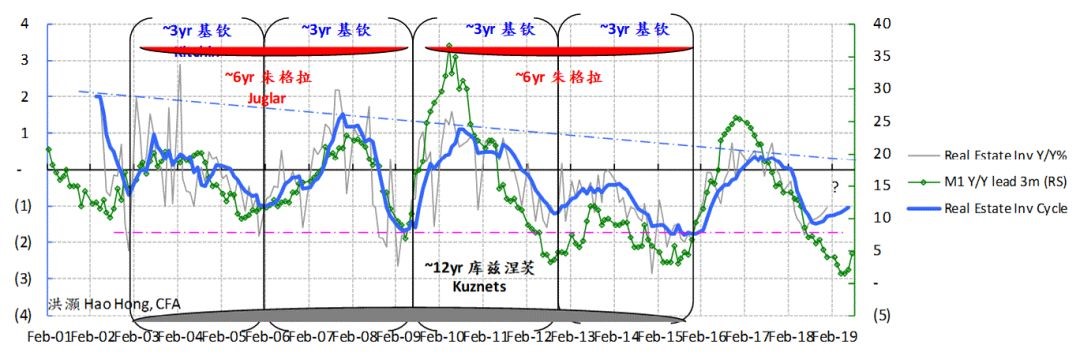
Figure 3: China’s economic cycle is reviving, as evidenced by the PBoC’s balance sheet, M1 and earnings
Source: Bloomberg, BOCOM Int'l
Note: Property construction, part of overall completed property investment that also includes land purchase, is more closely correlated with economic activities. Due to the irregularities of the data release since 2017, we have used the construction data series to calculate the property investment cycle. Only selected cyclical charts are shown here. For complete detailed discussions on China’s 3-year short economic cycle, please refer to your reports titled “A Definitive Guide to China’s Economic Cycles” (20170324) and “A Definitive Guide to China’s Economic Cycles II – New High” (20170828).
Figure 3: China’s economic cycle is reviving, as evidenced by the PBoC’s balance sheet, M1 and earnings
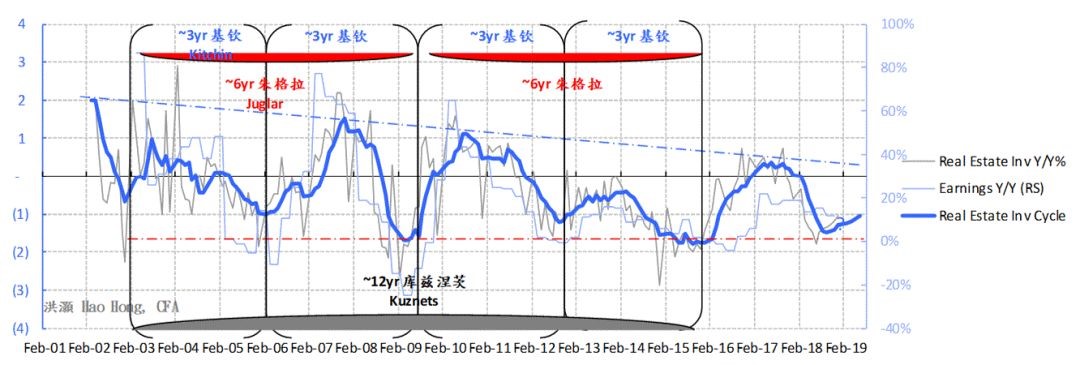 Source: Bloomberg, BOCOM Int'l
Note: Property construction, part of overall completed property investment that also includes land purchase, is more closely correlated with economic activities. Due to the irregularities of the data release since 2017, we have used the construction data series to calculate the property investment cycle. Only selected cyclical charts are shown here. For complete detailed discussions on China’s 3-year short economic cycle, please refer to your reports titled “A Definitive Guide to China’s Economic Cycles” (20170324) and “A Definitive Guide to China’s Economic Cycles II – New High” (20170828).
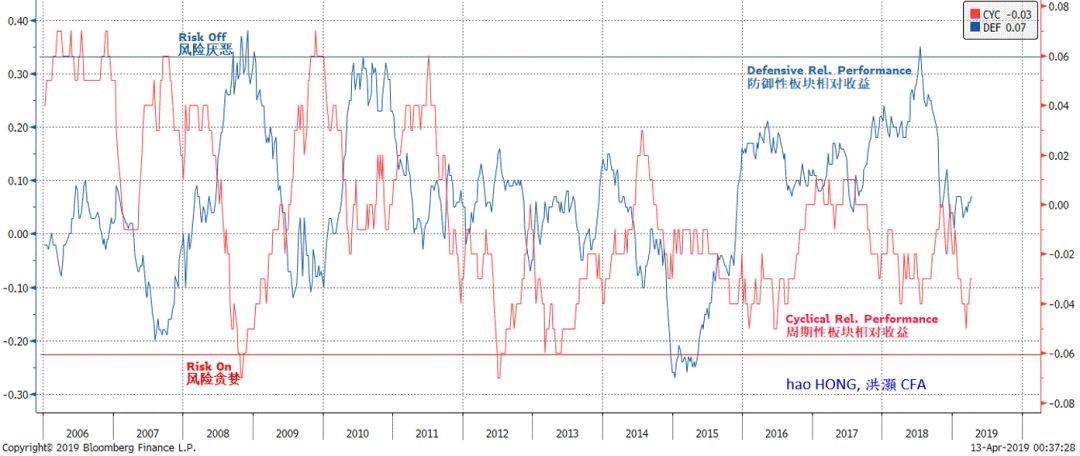
But cyclicals have not participated in this rally in full. Given that the cycle is truly turning, it is reasonable to assume that cyclicals should lead the current rally. However, the reality is quite the contrary: YTD, there is no clear leadership from the cyclicals; forestry, fishery and animal husbandry has been the best performing sector, followed by food and beverages, home appliances, etc.
There are pockets of cyclical strength, which, however, is not prominent. Overall, cyclicals’ relative performance as a whole continue to languish around low levels consistent with levels seen at the inflection points of previous economic cycles (Figure 4). That is, the market is still in doubt of the cyclical recovery, and such qualms are shown in the cyclicals’ weak relative performance.
Figure 4: The relative performance of cyclicals has not reflected the upturn of China’s economic cycle
Source: Bloomberg, BOCOM Int'l
Note: Property construction, part of overall completed property investment that also includes land purchase, is more closely correlated with economic activities. Due to the irregularities of the data release since 2017, we have used the construction data series to calculate the property investment cycle. Only selected cyclical charts are shown here. For complete detailed discussions on China’s 3-year short economic cycle, please refer to your reports titled “A Definitive Guide to China’s Economic Cycles” (20170324) and “A Definitive Guide to China’s Economic Cycles II – New High” (20170828).
But cyclicals have not participated in this rally in full. Given that the cycle is truly turning, it is reasonable to assume that cyclicals should lead the current rally. However, the reality is quite the contrary: YTD, there is no clear leadership from the cyclicals; forestry, fishery and animal husbandry has been the best performing sector, followed by food and beverages, home appliances, etc.
There are pockets of cyclical strength, which, however, is not prominent. Overall, cyclicals’ relative performance as a whole continue to languish around low levels consistent with levels seen at the inflection points of previous economic cycles (Figure 4). That is, the market is still in doubt of the cyclical recovery, and such qualms are shown in the cyclicals’ weak relative performance.
Figure 4: The relative performance of cyclicals has not reflected the upturn of China’s economic cycle
 Source: Bloomberg, BOCOM Int'l
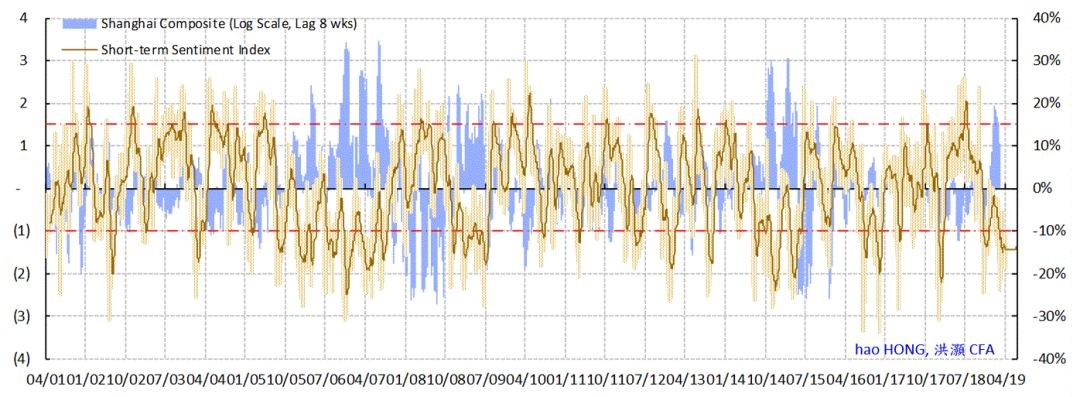
Market sentiment hints at skepticism towards the current market recovery. Years ago when we first returned from Wall Street to apply western market theories to analyze the Chinese mainland market, we created the first market sentiment model for the A-share market based on behavioral economics.
Our market sentiment model triangulates the pricing discrepancies between various asset classes to find mispriced opportunities. It is a contrarian indicator of the forward return of the A-share market: the more cautious the market sentiment is as implied in the prices of various asset classes, the more constructive the outlook for market forward return.
We have given a master-class public lecture organized by one of China’s most influential new media groups on how to measure market sentiment. It is a pleasure to see that many market researchers lately have come up with their own versions of market sentiment models.
While not infallible, our market sentiment model for the A-share market did help us negotiate the tempestuous torrents in the mainland stock market, pinpointing the market inflection points in June 2013 (the liquidity crisis), August 2014 (the inception of “the Great China Bubble”), June 2015 (the peak of “the Great China Bubble”), and the market bottom in early 2016. The model performs its best at important inflection points, and less so at intertemporal fluctuation within a larger and longer trend.
Figure 5: The market is still skeptical of the rally; cautious sentiment augurs further gains ahead
Source: Bloomberg, BOCOM Int'l
Market sentiment hints at skepticism towards the current market recovery. Years ago when we first returned from Wall Street to apply western market theories to analyze the Chinese mainland market, we created the first market sentiment model for the A-share market based on behavioral economics.
Our market sentiment model triangulates the pricing discrepancies between various asset classes to find mispriced opportunities. It is a contrarian indicator of the forward return of the A-share market: the more cautious the market sentiment is as implied in the prices of various asset classes, the more constructive the outlook for market forward return.
We have given a master-class public lecture organized by one of China’s most influential new media groups on how to measure market sentiment. It is a pleasure to see that many market researchers lately have come up with their own versions of market sentiment models.
While not infallible, our market sentiment model for the A-share market did help us negotiate the tempestuous torrents in the mainland stock market, pinpointing the market inflection points in June 2013 (the liquidity crisis), August 2014 (the inception of “the Great China Bubble”), June 2015 (the peak of “the Great China Bubble”), and the market bottom in early 2016. The model performs its best at important inflection points, and less so at intertemporal fluctuation within a larger and longer trend.
Figure 5: The market is still skeptical of the rally; cautious sentiment augurs further gains ahead
 Source: Bloomberg, BOCOM Int'l
Despite the ripping rally, our sentiment model for the A-share market continues to suggest market suspicion towards the rally. Many still think that the rally is unfounded, and economic fundamentals remain feeble. For instance, the companies failing earning expectations the most have substantially outperformed. It appears to be a junk rally at this stage. But which episode of market - recovery in the A shares doesn’t start with junks and then spread out? As credit and money supply grows, fundamentals will catch up – sooner or later.
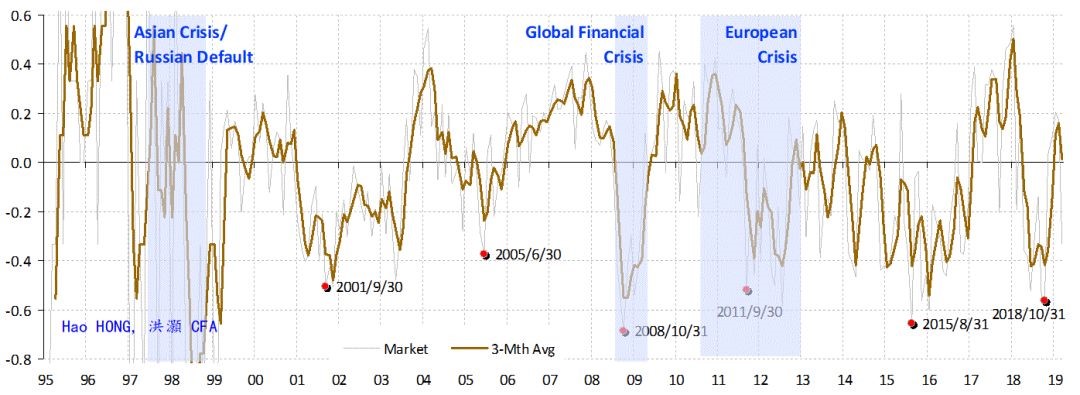
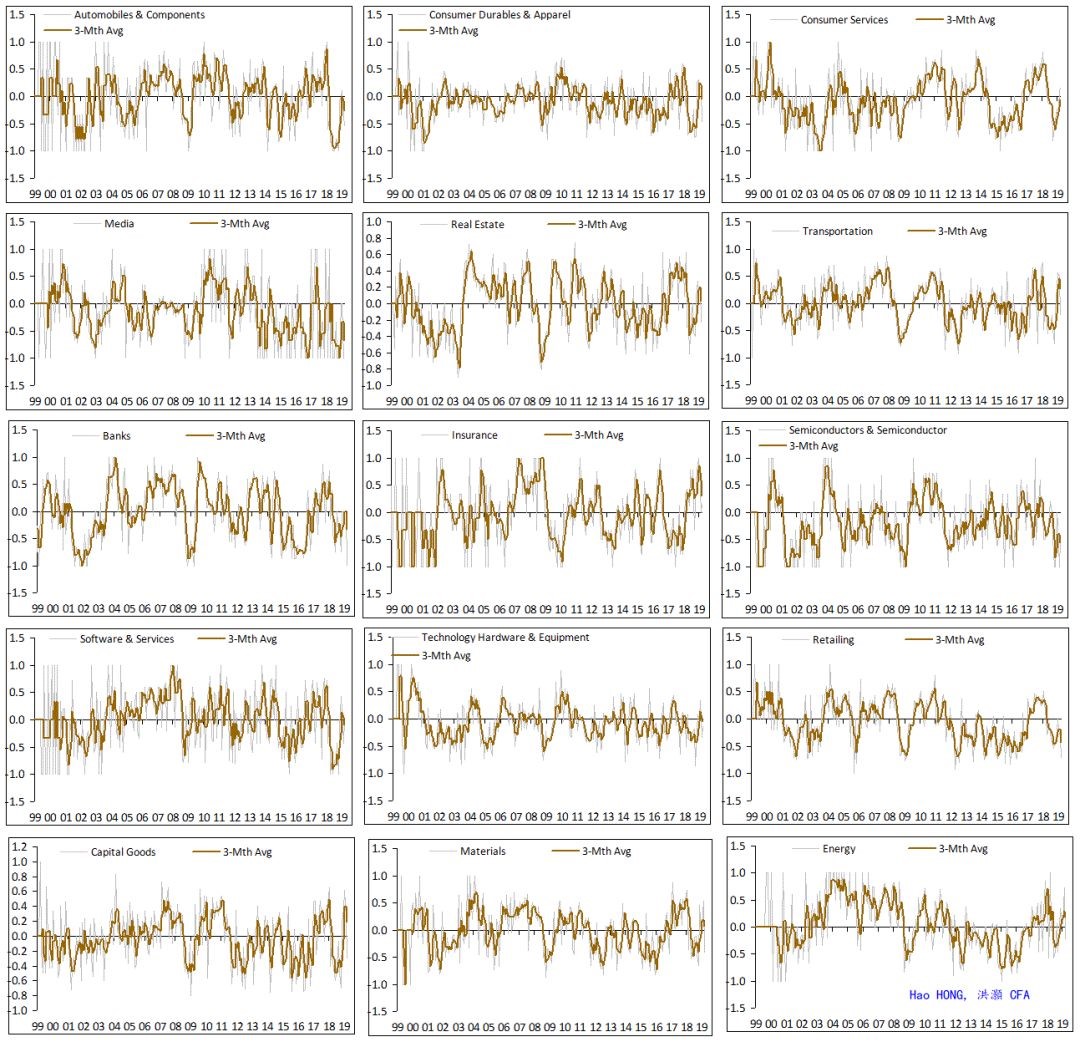
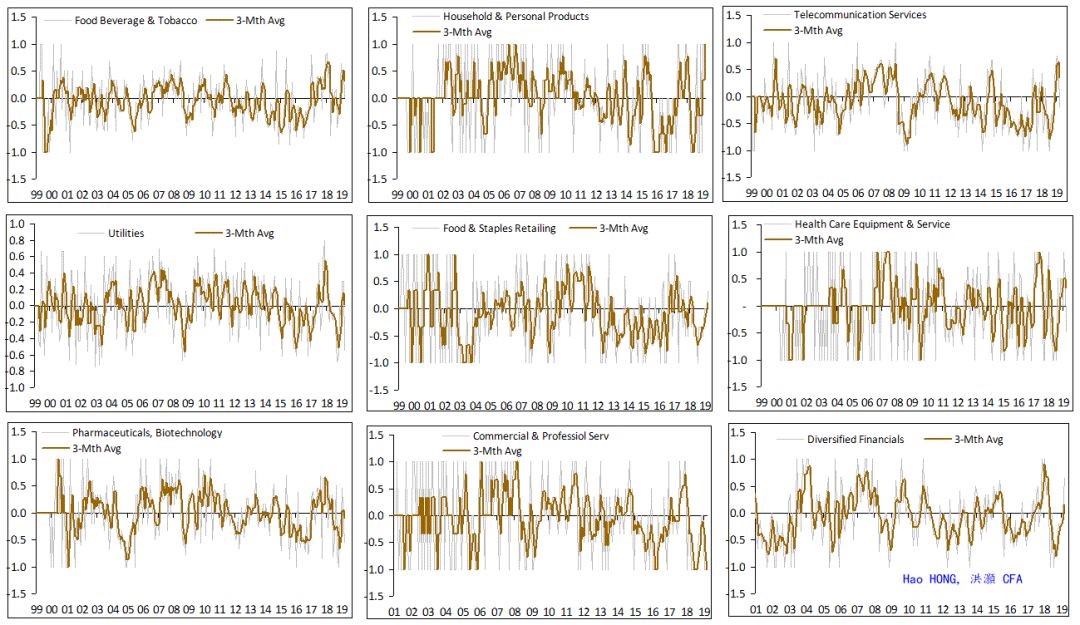
Earnings revision momentum also shows strength in defensive sectors while cyclicals lag. We can also examine analysts’ earnings revision momentum by sector and industry groups from a bottom-up perspective to identify sectors where improvements in earnings are fully priced in, while those with rising earnings prospects should soon catch up.
Our bottom-up aggregation of a few thousand listed companies shows that the overall market momentum of earnings revision is high and rising, after collapsing to its historic lows in late December and early January. The timing of the collective sell-side pessimism coincides with the market bottom in the current cycle. Its improvement above its long-term average but below its historical upper bound suggests further room for improvement (Appendix).
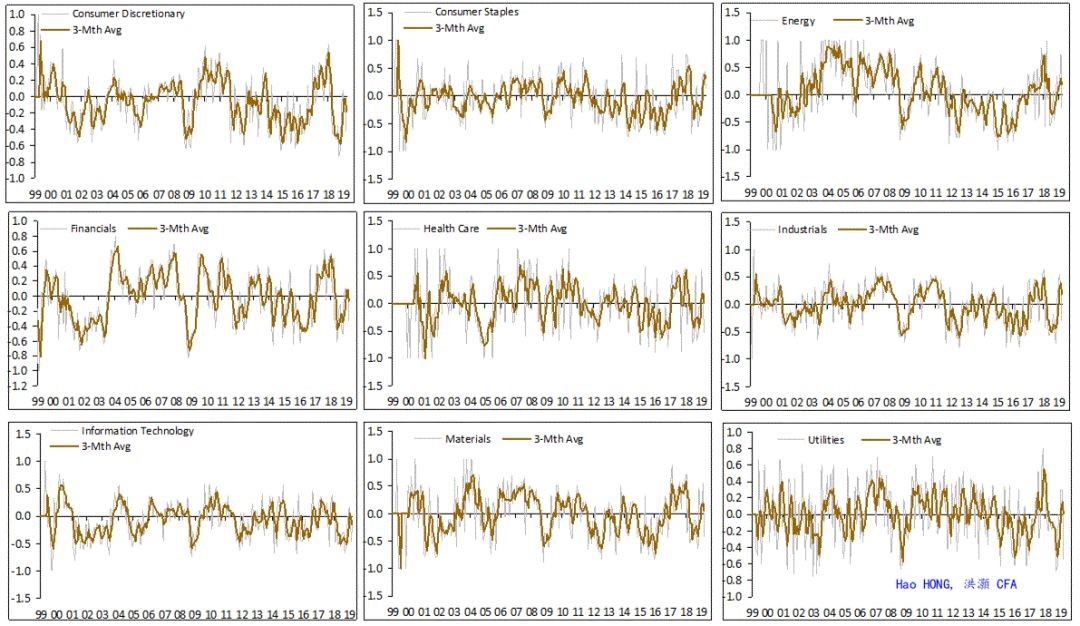
Further, we see that the price movement of many defensive sectors appears to have fully priced in the recovery. But that of many cyclical sectors, such as banks, real estate, energy, non-bank financials, materials, discretionary consumption, software/technology, etc. is high and rising, and should have room to improve further (Please see Appendix for charts of earnings revision momentum in sectors and industry groups).
Market Outlook
Cyclicals should start to outperform. It is odd that the cyclical revival in the Chinese economy, as shown by the latest PMI, exports growth and money/credit growth, is not reflected in cyclicals’ relative performance. That said, a close examination of the cyclical inflection points in the past reveals that defensive sectors tend to outperform at the later stage of the economic cycle. And such relative strength in defensive sectors tends to stretch into the early stage of the cyclical upswing – until defensives hand over the baton of market leadership to cyclicals.
To be precise, cycles have neither beginning nor end. The downturn of the previous cycle also ushers in the upturn of an ensuing cycle. The eventual recovery in the cyclicals’ relative performance will be a testament to the reflation of China’s economic cycle.
Market skepticism towards the current market recovery augurs well for higher highs. Our quantitative market sentiment model suggests doubts towards the current market recovery. As there is still much hesitation left, the continuing improvements that are likely to come in the Chinese economy will gradually convert doubters into believers.
We are at the stage of “bad news is good news, good news is better news”, given the market sentiment. When market sentiment is elevated into euphoria, as it is likely to be at a later stage, good news will then be interpreted as bad news, marking the peak of market recovery. We are still some way off.
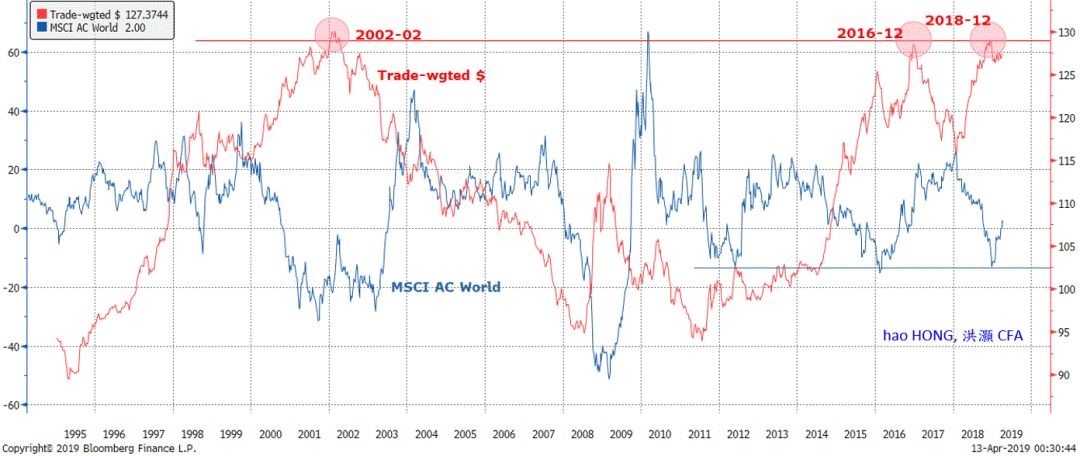
Peaking Dollar suggests improving liquidity conditions for EMs, including A shares. The Fed has turned dovish by stopping interest rate hike and slowing or even pausing balance sheet reduction. The ECB and BoJ have both signaled further monetary easing if necessary. The PBoC has just shown strong resolve to reflate the Chinese economy by epic money and credit supply growth.
It feels like Jackson Hole 2014 all over again - when global central banks reached consensus regarding further monetary easing. In a cyclical revival and an environment of improved risk appetite as a result, the trade-weighted dollar should stop strengthening, or even start to weaken. The combination of these factors is conducive to further gains in EMs and A shares (Figure 6).
Figure 6: Trade-weighted USD should depreciate, supporting global liquidity and risk appetite
Source: Bloomberg, BOCOM Int'l
Despite the ripping rally, our sentiment model for the A-share market continues to suggest market suspicion towards the rally. Many still think that the rally is unfounded, and economic fundamentals remain feeble. For instance, the companies failing earning expectations the most have substantially outperformed. It appears to be a junk rally at this stage. But which episode of market - recovery in the A shares doesn’t start with junks and then spread out? As credit and money supply grows, fundamentals will catch up – sooner or later.
Earnings revision momentum also shows strength in defensive sectors while cyclicals lag. We can also examine analysts’ earnings revision momentum by sector and industry groups from a bottom-up perspective to identify sectors where improvements in earnings are fully priced in, while those with rising earnings prospects should soon catch up.
Our bottom-up aggregation of a few thousand listed companies shows that the overall market momentum of earnings revision is high and rising, after collapsing to its historic lows in late December and early January. The timing of the collective sell-side pessimism coincides with the market bottom in the current cycle. Its improvement above its long-term average but below its historical upper bound suggests further room for improvement (Appendix).
Further, we see that the price movement of many defensive sectors appears to have fully priced in the recovery. But that of many cyclical sectors, such as banks, real estate, energy, non-bank financials, materials, discretionary consumption, software/technology, etc. is high and rising, and should have room to improve further (Please see Appendix for charts of earnings revision momentum in sectors and industry groups).
Market Outlook
Cyclicals should start to outperform. It is odd that the cyclical revival in the Chinese economy, as shown by the latest PMI, exports growth and money/credit growth, is not reflected in cyclicals’ relative performance. That said, a close examination of the cyclical inflection points in the past reveals that defensive sectors tend to outperform at the later stage of the economic cycle. And such relative strength in defensive sectors tends to stretch into the early stage of the cyclical upswing – until defensives hand over the baton of market leadership to cyclicals.
To be precise, cycles have neither beginning nor end. The downturn of the previous cycle also ushers in the upturn of an ensuing cycle. The eventual recovery in the cyclicals’ relative performance will be a testament to the reflation of China’s economic cycle.
Market skepticism towards the current market recovery augurs well for higher highs. Our quantitative market sentiment model suggests doubts towards the current market recovery. As there is still much hesitation left, the continuing improvements that are likely to come in the Chinese economy will gradually convert doubters into believers.
We are at the stage of “bad news is good news, good news is better news”, given the market sentiment. When market sentiment is elevated into euphoria, as it is likely to be at a later stage, good news will then be interpreted as bad news, marking the peak of market recovery. We are still some way off.
Peaking Dollar suggests improving liquidity conditions for EMs, including A shares. The Fed has turned dovish by stopping interest rate hike and slowing or even pausing balance sheet reduction. The ECB and BoJ have both signaled further monetary easing if necessary. The PBoC has just shown strong resolve to reflate the Chinese economy by epic money and credit supply growth.
It feels like Jackson Hole 2014 all over again - when global central banks reached consensus regarding further monetary easing. In a cyclical revival and an environment of improved risk appetite as a result, the trade-weighted dollar should stop strengthening, or even start to weaken. The combination of these factors is conducive to further gains in EMs and A shares (Figure 6).
Figure 6: Trade-weighted USD should depreciate, supporting global liquidity and risk appetite
 Source: Bloomberg, BOCOM Int'l
Appendix
Appendix 1: Earnings estimates have recovered from their lows seen in last October
Source: Bloomberg, BOCOM Int'l
Appendix
Appendix 1: Earnings estimates have recovered from their lows seen in last October
 Source: FactSet, BOCOM Int'l
Appendix 2.1: Earnings revision has recovered across sectors, but cyclicals have not participated in full
Source: FactSet, BOCOM Int'l
Appendix 2.1: Earnings revision has recovered across sectors, but cyclicals have not participated in full
 Source: FactSet, BOCOM Int'l
Appendix 2.2: Earnings revision has recovered across sectors, but cyclicals have not participated in full
Source: FactSet, BOCOM Int'l
Appendix 2.2: Earnings revision has recovered across sectors, but cyclicals have not participated in full
 Source: FactSet, BOCOM Int'l
Appendix 2.3: Earnings revision has recovered across sectors, but cyclicals have not participated in full
Source: FactSet, BOCOM Int'l
Appendix 2.3: Earnings revision has recovered across sectors, but cyclicals have not participated in full
 Source: FactSet, BOCOM Int'l
