Il Houng Lee: A Short Review of the International Monetary System and Future Prospects
2023-08-01 IMIIl Houng Lee, Senior Associate Researcher, Vesalius College (CSDS Center), Former Member of Monetary Policy Board, Bank of Korea.
There was growing expectation in the early 2010s that with the shift in economic balance toward Asia, notably China, the share of the RMB in international payments would rise, culminating in a tripolar currency system consisting of the US dollar, the Euro and the RMB. Even then, the US Dollar was expected to remain as the main reserve currency and a store of value in the foreseeable future. Since then, the use of the RMB as a settlement currency has steadily expanded and the centrality of the US dollar in the International Monetary System (IMS) has further cemented with the expansion of the global financial market. Going forward, the structure of the IMS will be shaped, plausibly, by the evolution of geopolitical tension (an issue outside the scope of this note), China’s capital account openness, and the introduction of Central Bank Digital Currency (CBDC). This note asks a couple of questions on the current IMS to assess what else might be involved in the future path of the IMS.
1. Has the centrality of the US dollar in the IMS cemented?
The dominance of the US dollar in the IMS reflects its strong demand as a medium of exchange, store of value and unit of account. Inertia in demand rests in the natural advantage of the incumbent, e.g., the network externalities, or equivalently market liquidity, i.e., conversion into goods and services at minimum cost at short notice. In particular, the store of value motive is guided by the expected future value of the currency as well as “future prospects” of market liquidity, i.e., global demand for a currency is determined by the market’s expectation of the issuing country’s long-term growth prospects which presumes stability of the governance structure and full access to the capital market.
The International Investment Position (IIP) of a country can be regarded as a measure of demand for the currency it issues. IIP data indicate strong preference for the US as an investment destination and equivalently for the US dollar. The US accounts for 26% of global IIP Liabilities and 18% of assets in 2021. Its assets and liabilities combined amounts to 3.5 times of its GDP, which compares with 1.8 times its GDP about two decades ago, notwithstanding valuation changes. This huge increase took place at a time when the size of the global IIP itself rose from US$63 trillion to US$403 trillion, cementing the centrality of the US dollar in the global financial market even though its relative GDP share has declined.
Countries with convertible currency tend to have a high share of their IIP liabilities denominated in their own currency, e.g., around 93% of US’ IIP liabilities are held in US dollar. Relating to debt claims, domestic currency share in the US stands at 80% which is comparable to Germany’s 77% in Euro.
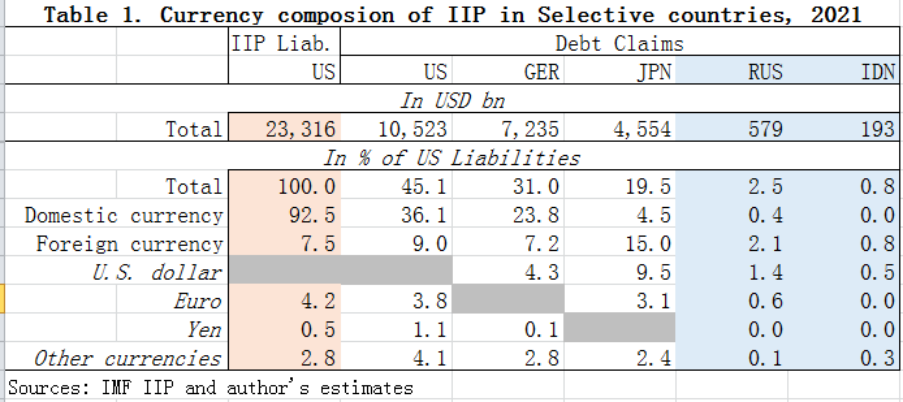
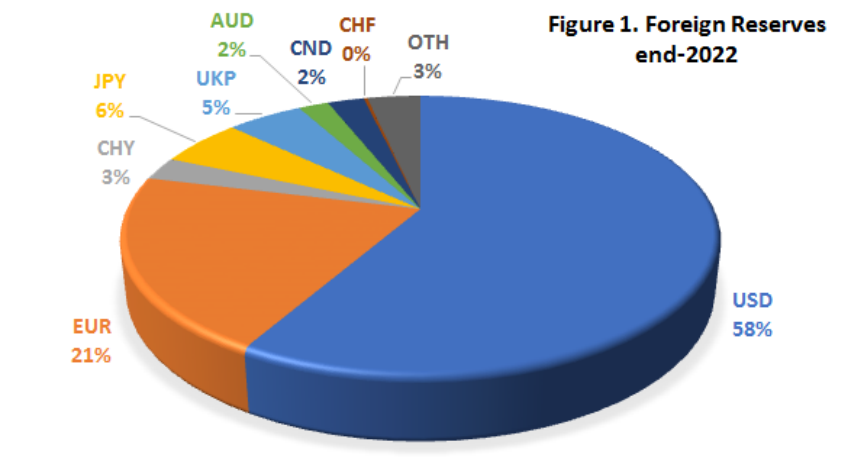
Fed’s provision of dollar liquidity swap lines to several OECD countries, including additional temporary ones during heightened global financial risks provided further assurance on the resilience of dollar liquidity. Countries with non-convertible currencies tend to hold understandably a larger portion of their debt claims in US dollar, a mirror image of the composition of international reserves.
Sources: IMF data
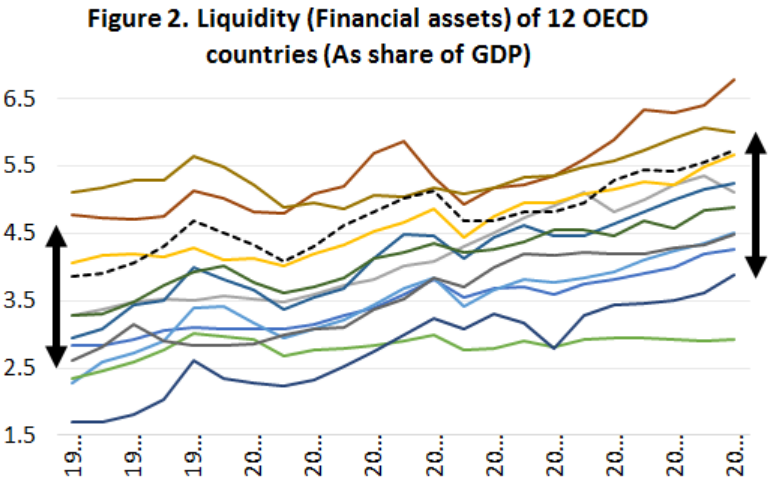
The strong influence of monetary condition in the US financial market over other countries, at least through the first half of 2010s is supported by quantitative assessments. One such study covering 12 OECD countries over 1995-2014 (annual data) indicates a strong US liquidity (credit instruments plus financial equity) spillover on other advanced economies. A one percent increase in US liquidity/GDP ratio is associated with a 0.7 percent increase in other countries’ respective liquidity/GDP ratio. In fact, during this period, the (simple) average of these 12 countries’ liquidity grew from 3.1 times to 4.7 times their respective GDP.
Sources: OECD, and Author’s calculation.
2. Does the FED set the agenda for global monetary policy?
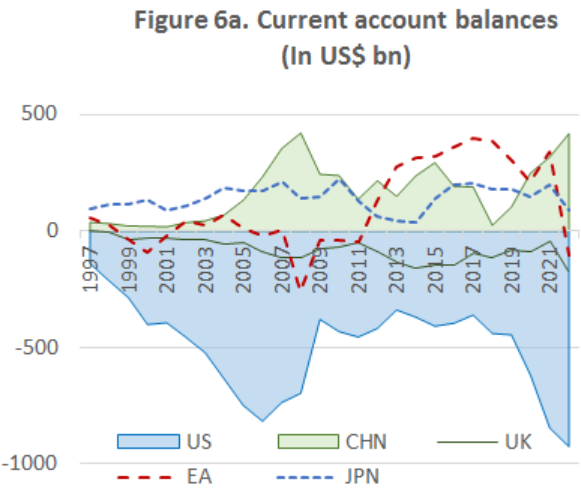
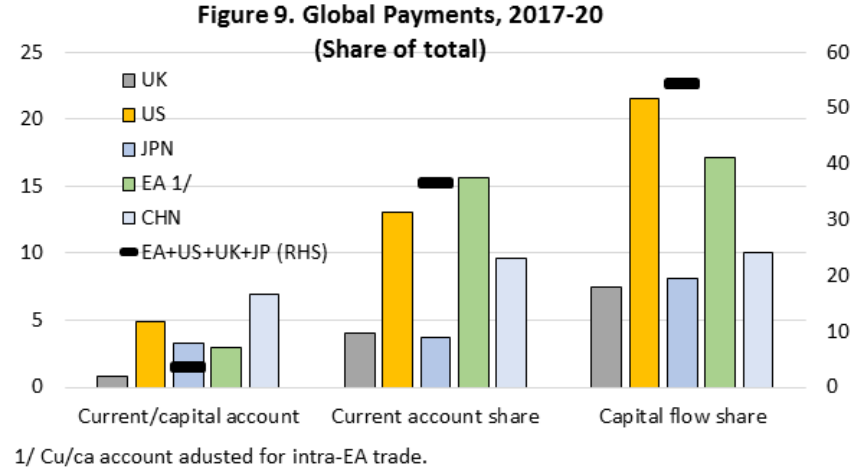
The main contributors of global imbalance, i.e., the US, China, the EA, the UK, and Japan, together account for 46% of current account payments and 64.3% of capital flows. Global monetary policy coordination thus centers around these few countries, with most other countries acting as price takers. China’s participation in the monetary policy discussion is more focused on its responses to global monetary shocks via the exchange rate reflecting its expanding but still relatively limited capital account convertibility (hence relatively smaller portfolio or cross border banking flows) but a much stronger linkage via trade and direct investment, e.g., the latter account for close to 50% of its IIP liabilities.
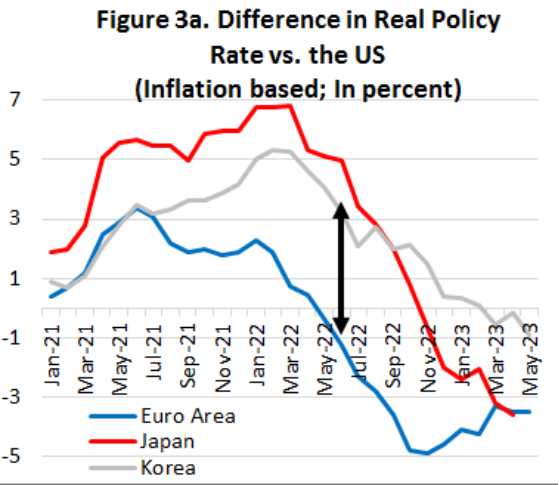
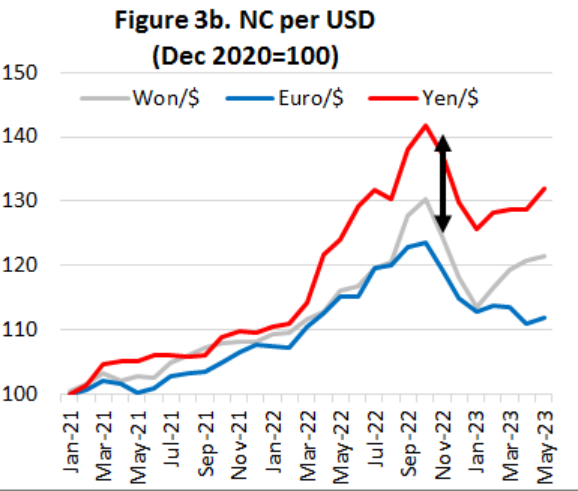
The strong influence of the FED’s policy decision was most clearly illustrated in the 2022 global inflation shock. Most advanced economies under inflation targeting framework focused their monetary policy on containing respective inflation expectations. Even then, their policy actions “relative to the FFR” mattered since any divergence from what the market saw as an appropriate policy response was reflected instantly in their respective exchange rates (i.e., guided by the UIP and PPP and FED’s announced inflation and policy rate path). In fact, both the FED’s policy rate and the balance sheet changes are important in the monetary policy transmission. China is more on the recipient side of global monetary policy outcome, but certainly not in the overall aggregate demand management discussions.
Sources: IMF, FED and author's estimates
Sources: IMF, FED and author's estimates
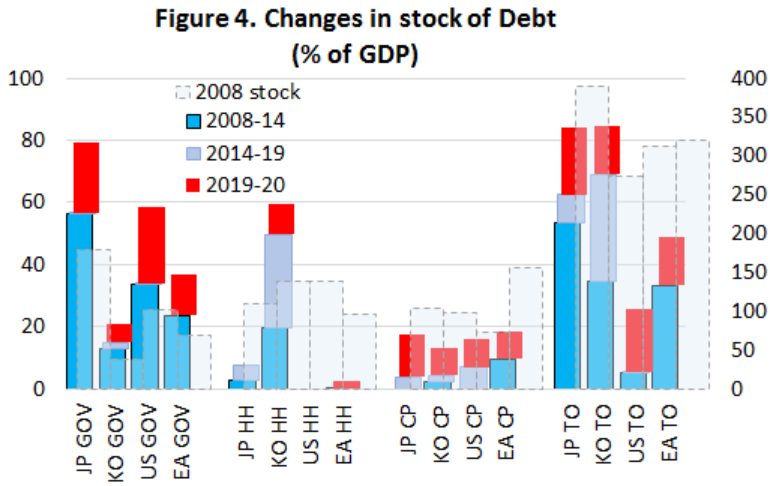
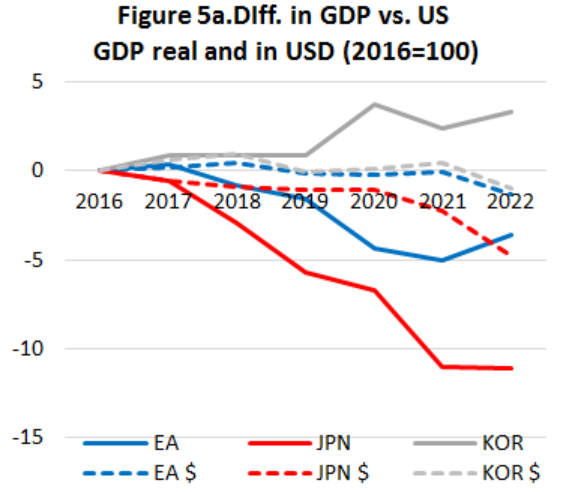
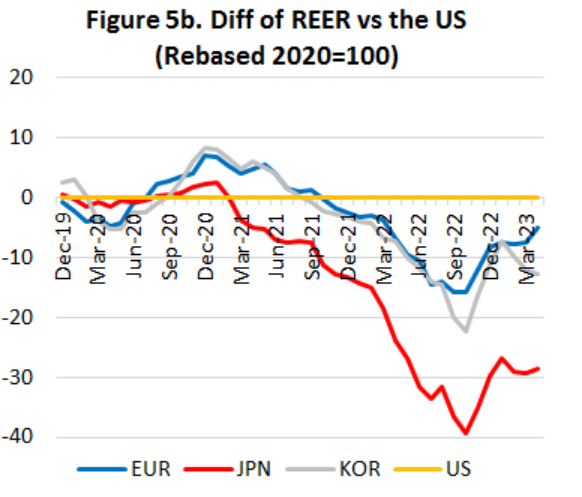
Monetary policy reaction to inflation shock led to an overshooting (depreciation of most AD countries’ currencies relative to the US dollar) towards the end of 2022. However, they rebounded in the early 2023 and the overall path seems to be consistent with fundamentals, e.g., growth outlook. The heavily leverage-supported growth of the last decade in Japan and Korea, for example, do not arguing well for future growth prospects which are now brought to the fore with higher interest rate. Hence their GDP in USD terms (i.e., the dotted lines) widened in 2022 relative to the US GDP, contrasting the path of real GDP growth in national currencies. This suggests that under the current IMS despite all its weaknesses, exchange rate and consumer prices flexibility seem to ensure that the real effective exchange rate broadly track the path that is consistent with fundamentals.
Sources: OECD, IMF and author's estimates
Source: IMF WEO
Sources: IMF, FED and author's estimates
3. Is global imbalance due to the weaknesses of the current IMS?
The widening of the US current account deficit during the first half of the 2000s associated with China’s large current account surplus, i.e., the Global savings glut, is often attributed to the US dollar centric IMS system. China’s low consumption growth, or high savings, could have been moderated, inter alia, through faster appreciation of the RMB, i.e., non-intervention in the foreign exchange market. This claim, however, seems contrary in a market-based system where a country would naturally hedge against expected shocks, i.e., accumulation of reserves, especially just after the experience of the 1997 Asian foreign exchange crisis. The other argument was to encourage more consumption as investment growth was deemed excessive at 13.8% p.a. in real terms. However, consumption was also growing at 11% p.a. in real terms (15% for urban households) and expecting even a faster growth was unrealistic. The scope for raising the import share of consumption via trade measures was limited as most of the population, at $1,141 per capita (2002), was still heavily dependent on locally produced cheaper products. Lastly and perhaps most importantly, the high current account surplus was broadly consistent with the population profile.
Other arguments included China’s non-market-based interventions, e.g., subsidies, especially involving the state-owned enterprises and, on the other side, the US’ large fiscal deficit. These are, however, not directly related to the IMS per se.
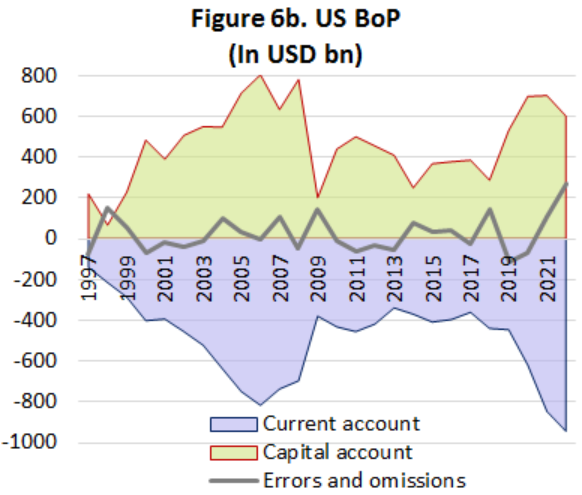
The latest resurgence of the US current account deficit reflects, inter alia, the pandemic related fiscal spending and domestic production and global supply chain disruptions. Reflecting the greater importance of capital account flows on exchange rate determination relative to trade settlements, the US dollar strengthened further vis-a-vis the Euro, the Yen and the Won during 2022-23, a point noted earlier. While the US dollar centrality of the IMS may have played a part, it seems to be more of a confidence issue (i.e., the US being “a safe heaven”). Again, these are not IMS originating issues.
Sources: IMF WEO
Sources: IMF IFS
4. Is high global leverage due to the IMS?
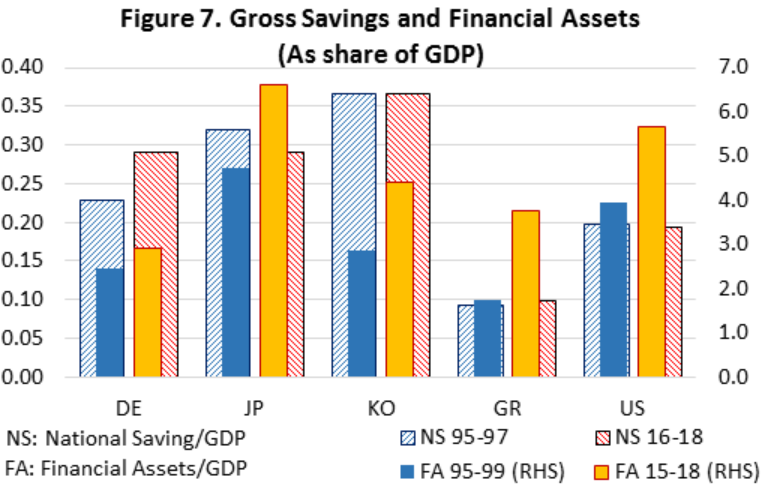
Global liquidity expanded excessively under the current IMS when measured against savings rates. While gross national savings as percent of GDP in advanced economies have on average remained broadly unchanged, total financial assets, which are the main instruments for storing wealth (e.g., savings), have increased by about 180% between the mid-1990s and the late-2010s. For example, Japan’s national savings declined from 33% to 29% of GDP while its financial assets/GDP rose by 186%. Similarly but to a lesser extent, US savings rate remained broadly unchanged at 19-20% but its financial assets/GDP rose by 50%. This implies that the actual purchasing power of the current value of financial assets is only about 70% of its face value (relative to 95-97 purchasing power). It could be even as low as 60% considering the US and Japan’ value of financial assets to GDP ratios were already high in the mid-1990s.
Sources: IMF WEO, OECD data, and author's estimates.
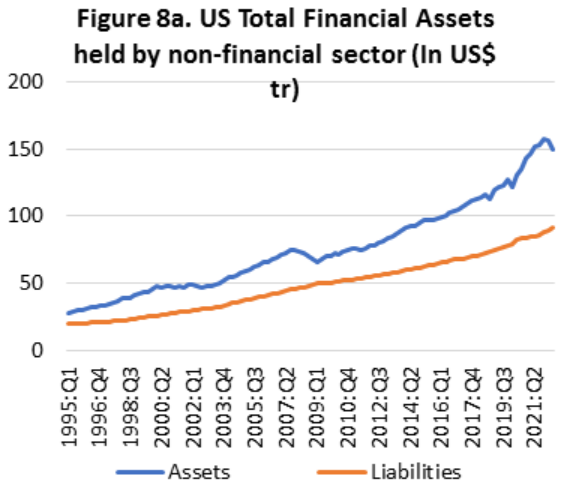
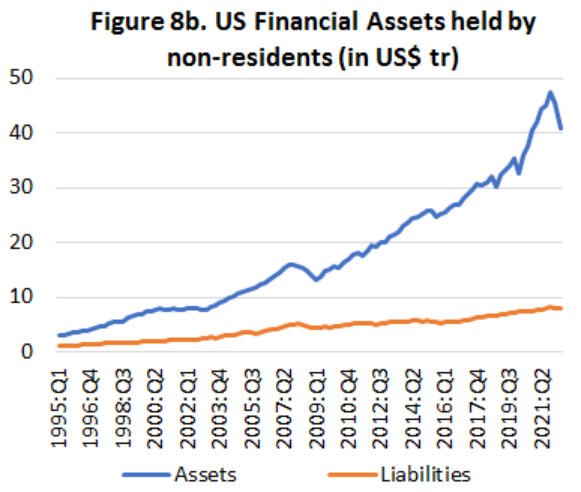
The excessive global liquidity expansion during the decades leading to the early 2010s was facilitated by the rapid growth of cross-border holdings, e.g., non-resident holdings of financial assets. However, while the latter in most OECD countries has moderated since then, global liquidity has continued to expand, i.e., the liquidity/GDP ratio is rising. This implies that liquidity growth has been increasingly induced by respective country’s accommodative monetary policy consistent with low global inflation (i.e., low interest rate) for most of the period. Liquidity growth in turn was accompanied by leverage that fed into valuation gains rather than investment in productive capacity, and hence the rise in liquidity over GDP ratio. The US is a rare exception where non-resident’s share of total US financial assets has continued to increase, i.e., from 17% in the early-2010s to 27% in the early-2020s, which suggests the unabating preference for US financial assets.
Sources: Flow of Fund (z1 tables), FED
Sources: Flow of Fund (z1 tables), FED
Speculating on how the global financial market may have evolved under a different IMS is a non-trivial issue. A multi-polar currency IMS would still be preferrable but would not be able to address excess global liquidity as long as countries maintain policies that nurture excessive leverage. Moreover, continued effort to address the mismatch between financial innovation and the regulatory environment (both at national and international levels to avoid, for example, another “European banking glut”), the search for yield that led to mispricing of risks combined with cross-border policy arbitrage activities would need to accompany any improvement in the IMS.
5. The role of the RMB in the current IMS
As attested by the inclusion in the SDR basket, the RMB meets key criteria to be a part of the main currencies constituting the IMS. China’s global share of GDP rose from 1.7 percent in 1990 (4.7% in PPP terms) to 17.5% (29.2% in PPP) in 2022, only second to the US (1st in PPP terms) and ahead of the Euro area at 13.5% percent. In terms of current account transactions and cross border capital flows (receipts and payments), it accounts for 9.7% and 10.0% of global flows, respectively, well ahead of Japan.
Sources: IFS, IMF and author's estimates
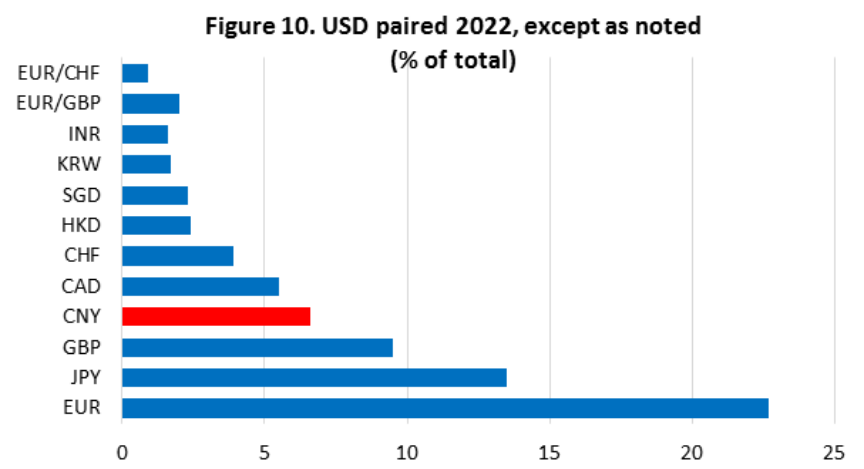
The use of the RMB has steadily increased accounting for 7 percent of total turnover (net basis, April 2023). This reflects not only the growing share of China’s cross border transactions but also steady progress in putting in place the necessary framework for the RMB to become an international currency. China has established cross-border trade settlement agreements in RMB with Russia, Venezuela, the UAE, Oman, Bahrain, Qatar, Kuwait, and Saudi Arabia and most recently with Brazil (March 2023). Chinese authorities have also set up the Yuan Cross-border Interbank Payment System (CIPS) in 2015 which by February 2023 had 1366 participants from 109 countries and regions. As of 2020, 27 offshore clearing banks have been set up in 25 economies, greatly simplifying the settlement of the RMB at local clearing bank, rather than via China’s local correspondent banks. Furthermore, the demand for RMB as a reserve currency was supported by PBoC’s swap lines with 38 countries and regions amounting close to 4 trillion RMB.
Source: BIS Triennial Central Bank Survey
The PBoC is at the forefront of developing e-CNY, i.e., a Central Bank Digital Currency (CBDC) focusing on setting global standards. It has already several pilot projects in place, covering 260 million wallets in 25 cities, including in Shenzhen and Chengdu. The Digital Currency Institute of the PBoC, along with the BIS, HKMA, the Bank of Thailand, and the Central Bank of UAE tested Project mBridge (named after a new blockchain, the mBridge Ledger to serve as a platform for multi-currency payments in CBDCs), placing the PBoC in position of strength relative to most other central banks on issues relating to CBDC. Thus, from an institutional point of view, the RMB is well positioned to play a greater role in the IMS.
6. Prospects for the IMS
The three critical missions of the IMF, i.e., “furthering international monetary cooperation, encouraging the expansion of trade and economic growth, and discouraging policies that would harm prosperity” are still very relevant and should form the basis of any revision to the international monetary system. Against this objective, we noted that the current IMS has become more US dollar centric. The spillover effect of the Fed on other advanced economies, initially through the growth of the US financial market, and later through monetary policy transmission, remains strong. That said, the greater role of the US dollar is associated with, inter alia, greater attractiveness of the US as an investment destination. Challenges remain, however, in addressing inadequate financial regulatory framework, individual countries’ expansionary macroeconomic policies that promote leverage, and structural deficiencies associated with financial globalization.
Concerns are also voiced that the US-dollar based system would be difficult to maintain as supply of global safe assets by the US through its fiscal space is limited. Others note that such a situation, coupled with the decline in the global share of the US economy could be addressed by diversifying reserve currencies, such as the RMB.
Given the size of the global financial market (about US$ 475 trillion and almost 5 times global GDP) of which about 30% is cross-border holdings, it seems inevitable that the IMS be structured around the currencies with largest share in cross country capital flows and stocks, i.e., the US dollar, followed by the euro. One could expect the role of China to increase in tandem with the gradual move towards full capital account convertibility. Meanwhile, the role of the RMB would likely increase as a settlement currency given China’s share in global trade and investment, and its effort to develop the CBDC. It is difficult to construct an IMS where the basic principles of monetary framework would change under a CBDC, e.g., central banks would remain as the gate keeper for ensuring the value of the currency they issue are maintained. Even then, China’s first mover advantage will have a positive impact on the RMB once a multicurrency payment platform using CBDCs is introduced. Ultimately, the role of the RMB will be determined by the market, which will be influenced also by non-IMS related issues.
