Dong Jingyue and Xia Le:Gauging the Impact of US Tech War on China: an Input-output Table Analysis
2019-03-19 IMI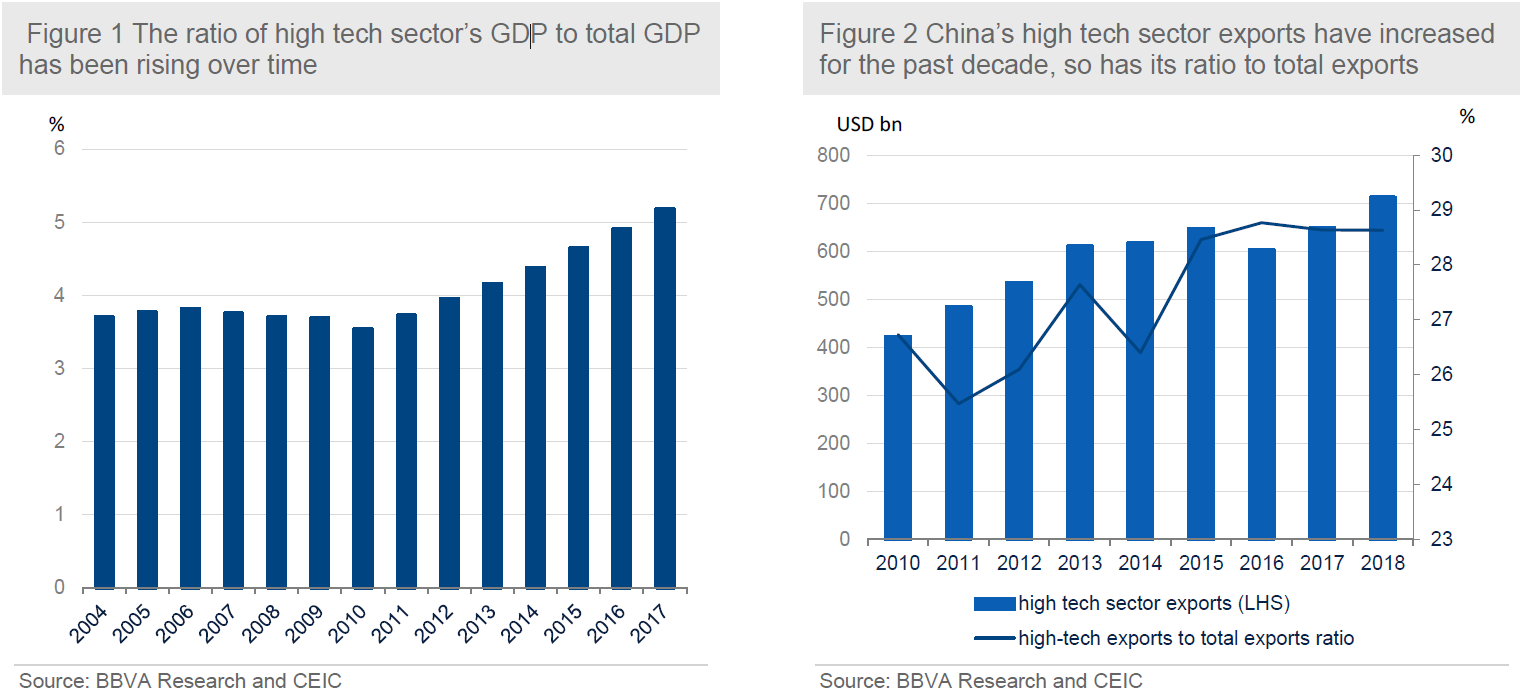
 … while they are subject to bias
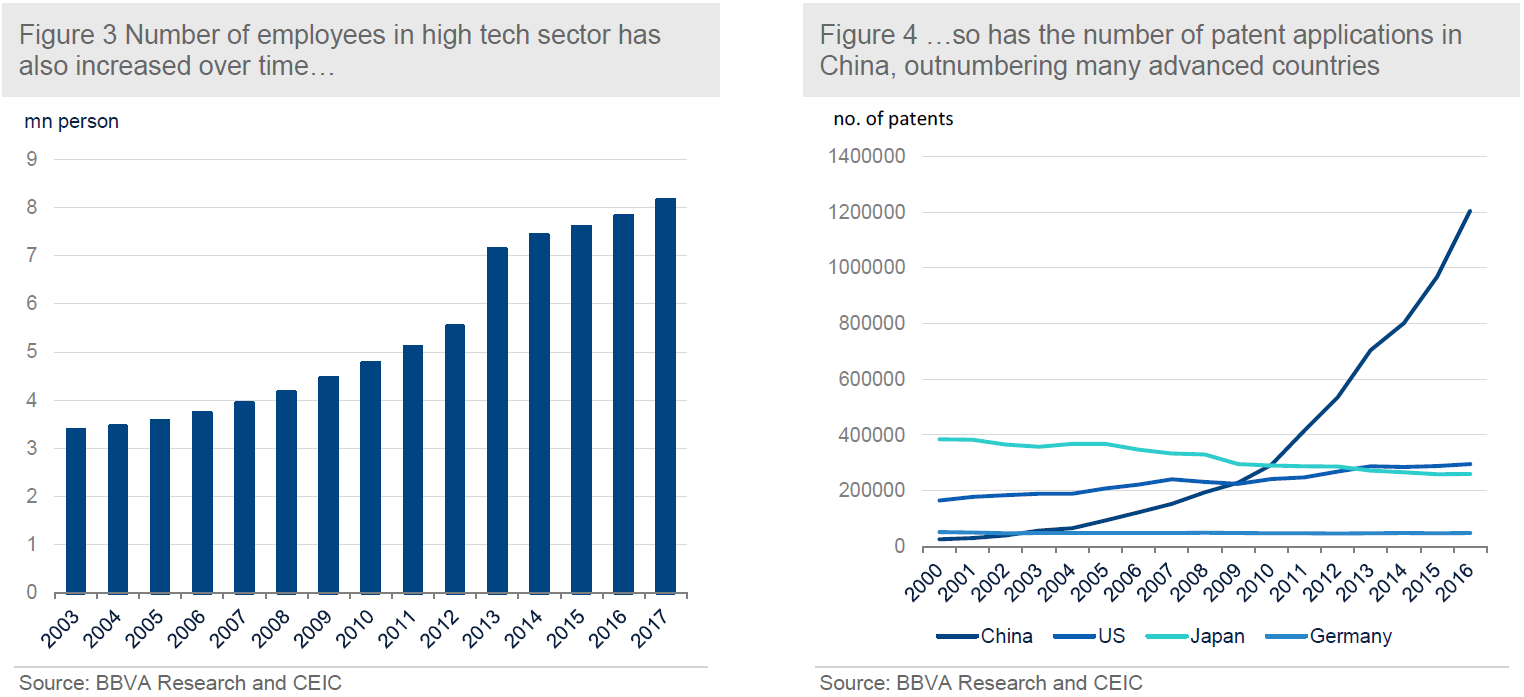
Although the figures shown in above charts are very informative, they are subject to bias. First, the export data only reflects the final products for shipment which includes contents not produced in the country. It is especially relevant since China has been famous for its processing exports. For many high-tech products, Chinese enterprises might just import the key elements from other countries and then use Chinese cheap labours to assemble them for export. Therefore, we cannot jump to the conclusion of China becoming more competitive in their high-tech exports by just comparing its shipment figures.
Second, the figure of high-tech sector’s contribution to total GDP is based on the final output of the sector, which tends to ignore the important inter-sector linkages. As such, this ratio could underestimate the importance of a sector to the entire economy if its linkage with other sectors is strong.
Analysis based on input-output table
Fortunately, based on the OECD TiVA database, we are able to derive important information with respect to the adding value of different sectors, which enables us to further gauge the relative importance of the high tech sector to the aggregate economic activities as well as the potential impact of China-US trade war on Chinese growth.
Indeed, the OECD TiVA database provides a Chinese input-output table of 35 sub-sectors. To define our high-tech sector for China, we combine 4 sub-sectors in the OECD TiVA database, namely sector D26--- computer, electronic and optical products; sector D27--- Electrical equipment; sector D 61---Telecommunications and sector D62T63--- IT and other information services. Based on this, we restructure the input-output table to form a new one of 32 sub-sectors including a self-defined high-tech sector.
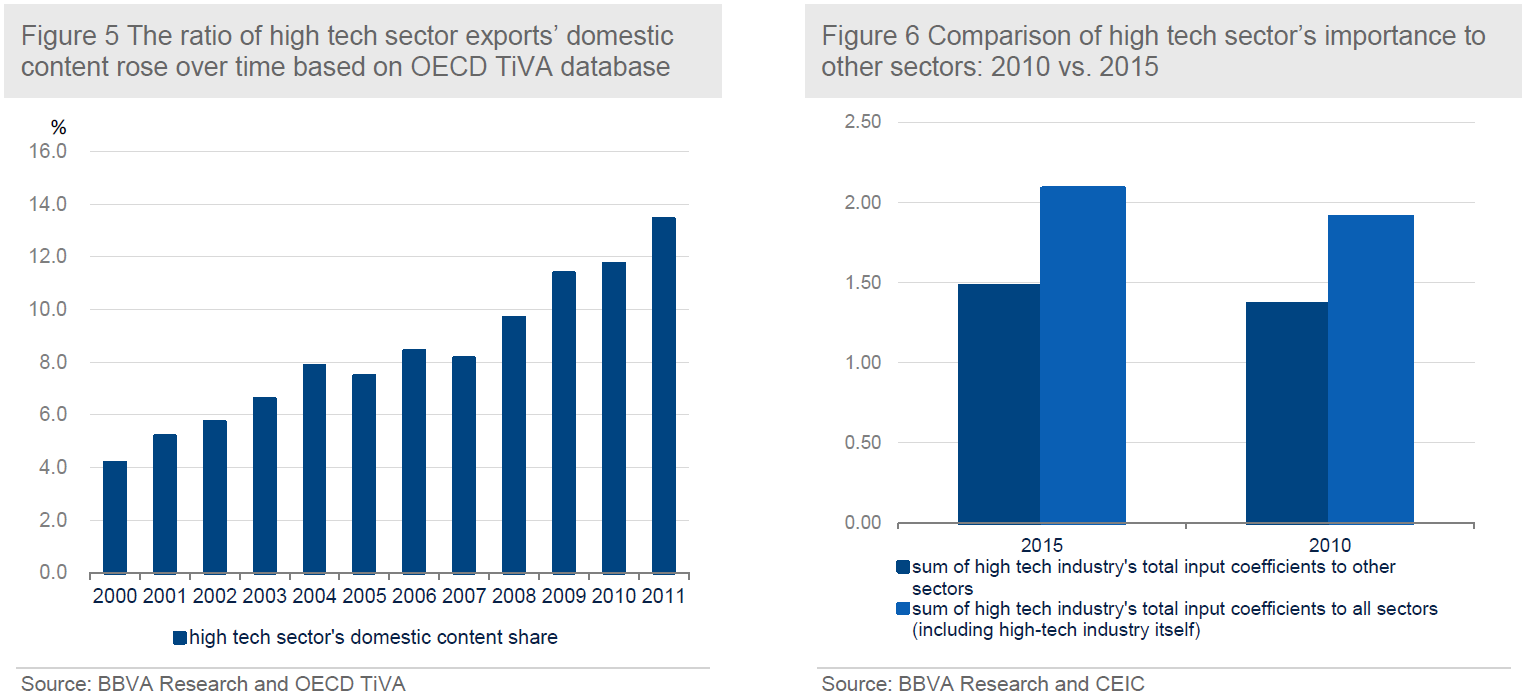
The OECD TiVA database directly provides an indicator of domestic content of China’s high-tech exports, which rose swiftly during the period of 2000-2011. (Figure 5) We believe that such an uptrend continues until now. This indicator provides more reliable evidence that China is climbing on the global value chain by advancing their technologies. It also explains why the US, as well as other advanced economies albeit to a less extent, have become more concerned about China and are pushing China to play a fairer game in the global competition of the high tech sector.
… while they are subject to bias
Although the figures shown in above charts are very informative, they are subject to bias. First, the export data only reflects the final products for shipment which includes contents not produced in the country. It is especially relevant since China has been famous for its processing exports. For many high-tech products, Chinese enterprises might just import the key elements from other countries and then use Chinese cheap labours to assemble them for export. Therefore, we cannot jump to the conclusion of China becoming more competitive in their high-tech exports by just comparing its shipment figures.
Second, the figure of high-tech sector’s contribution to total GDP is based on the final output of the sector, which tends to ignore the important inter-sector linkages. As such, this ratio could underestimate the importance of a sector to the entire economy if its linkage with other sectors is strong.
Analysis based on input-output table
Fortunately, based on the OECD TiVA database, we are able to derive important information with respect to the adding value of different sectors, which enables us to further gauge the relative importance of the high tech sector to the aggregate economic activities as well as the potential impact of China-US trade war on Chinese growth.
Indeed, the OECD TiVA database provides a Chinese input-output table of 35 sub-sectors. To define our high-tech sector for China, we combine 4 sub-sectors in the OECD TiVA database, namely sector D26--- computer, electronic and optical products; sector D27--- Electrical equipment; sector D 61---Telecommunications and sector D62T63--- IT and other information services. Based on this, we restructure the input-output table to form a new one of 32 sub-sectors including a self-defined high-tech sector.
The OECD TiVA database directly provides an indicator of domestic content of China’s high-tech exports, which rose swiftly during the period of 2000-2011. (Figure 5) We believe that such an uptrend continues until now. This indicator provides more reliable evidence that China is climbing on the global value chain by advancing their technologies. It also explains why the US, as well as other advanced economies albeit to a less extent, have become more concerned about China and are pushing China to play a fairer game in the global competition of the high tech sector.
Moreover, through the typical input-output table matrix calculations (see Technical APPENDIX in a separate pdf file), our input-output table analysis yields more interesting findings about China’s high tech sector. Specifically, we calculate the total input coefficient, a typical concept in input-output analysis, which illustrates how much output from each sector is used as intermediate inputs to meet one unit of increase in the final demand of the high tech sector, with both direct and indirect effects considered. This is indeed a good summary of inter-sector linkages which captures not only the final demand linkage but also the linkages through intermediate demand.
Our findings from this input-output table analysis can be summarized in the following three aspects:
First, high tech sector’s linkage with other sectors has been strengthening over time. (Figure 6) In particular, the sum of high tech sector’s total input coefficients to other sectors (both including and not including high sector itself) have increased from 2010 to 2015. In particular, the 2010 total input coefficient is 1.8, indicating that one USD increase of the final demand of high tech sector results in a change in the economy’s total output by 1.8 USD. This includes the initial dollar change (1 USD) in high tech sector’s final demand (direct effect) and changes in the outputs of other related sectors to support the initial dollar change in high tech sector output (indirect effect) (0.8 USD). By 2015 this figure rose to 2.2, indicating that the high tech sector will consume more intermediate inputs from other sectors. It shows that the importance of China’s high tech sector has been on the rise in terms of its stronger derived demand on other sectors.
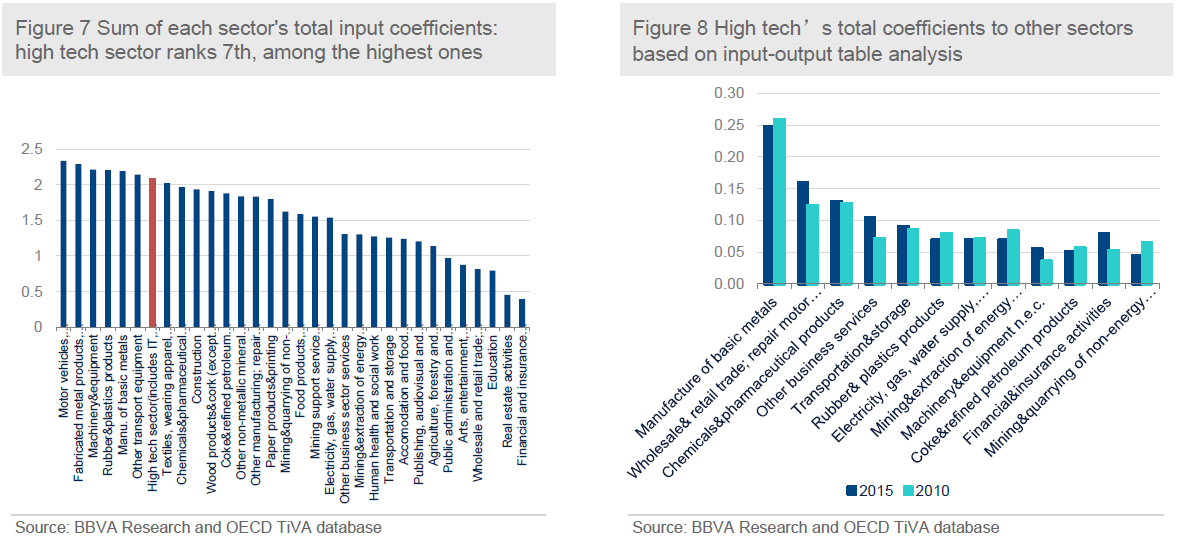
Moreover, we observe that high tech sector ranks the 7th, among all of 32 sectors. This indicates the importance of the high tech sector to the economy in terms of its spill-over effect to other sectors. (Figure 7)
Second, we find that the spill-over effects of the high tech sector are in particular strong in a number of other sectors, including: manufacturing of basic metals, wholesale and retail trade, chemicals and pharmaceutical products, other business service and transportation and storage. In addition, for most of the sectors, the linkage with the high tech sector has been strengthening over time, corroborating our first result. (Figure 8)
Last, we also explore the relative importance of high tech sector by estimating the loss in the economy’s total gross output caused by a hypothetical elimination of the linkage of high-tech sector with other sectors. (See details in Technical APPENDIX) Our result shows that the Chinese economy’s total gross output would be around 10.8% less if we shut down high-tech sector’s linkage with other sectors, based on the input-output table of 2015.
A scenario analysis: how will the tech war affect China’s growth?
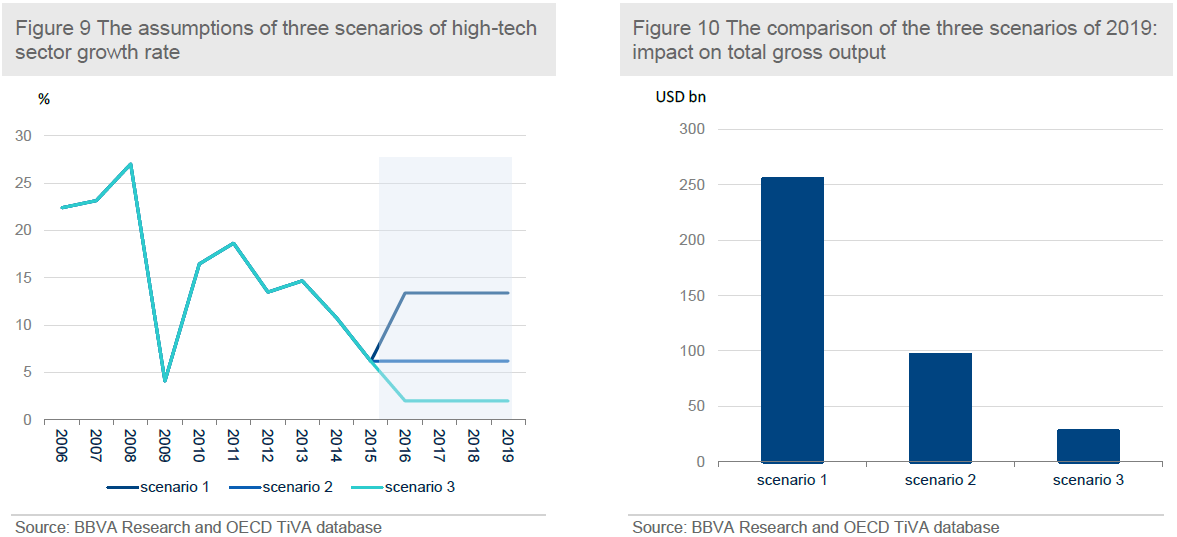
With the results of input-output table analysis at hand, we are able to gauge the impact of the US-initiated tech war on China’s growth. Towards this end, we employ a scenario analysis approach, in which we defined three scenarios corresponding to different growth rates of China’s high tech sector.
In the first scenario we assume a growth rate of 13.4% in China’s high tech sector, which is the average annual growth during the period of 2010-2015. In our analysis, scenario 1 is treated as a benchmark without tech war risk.
In the second scenario, we assume the growth rate of the high tech sector decrease to 6.2%, the historical low of 2010-2015 due to the US tech war against China. In the third scenario, the growth rate is assumed to decelerate to 2%, reflecting more adverse environment stemming from the tech war. (Figure 9)
Based on our total input coefficient result as displayed in the previous section (Figure 6), we assume that this coefficient is constant throughout 2015 to 2019. It indicates that one dollar increasing in final demand of high tech sector will lead to an increase of 2.2 dollars in total gross output of the economy.
In Figure 10 we display the size of total gross output increase with respect to the growth of high tech sector under three scenarios. Indeed, what we concern here is not the size but rather the gaps of gross output increase between different scenarios. If we treat scenario 1 as the one without the disturbance of the tech war, the gaps of scenario 2 and 3 relative to scenario 1 can reflect to what extent the tech war affects the total gross output of Chinese economy.
We estimate that a tech war risk will decrease the total gross output in China by 0.54%, or USD 158.6 billion if it slows the growth of high tech sector to 6.2% from 13.4% (scenario 2). In a worse case (scenario 3), China’s total gross output could be slashed by 0.78%, or USD 227.7 billion if its growth of high tech sector decelerated to 2% due to the escalation of the trade war.
Conclusion
Although the US-China tariff war is likely to come to an end soon, a tech war between these two economic and tech clouts are looming large. In this report, we try to quantify to what extent that China-US tech war will drag on Chinese economic growth based on input-output table analysis.
By use of data provided by OECD TiVA database, we find that the high tech sector has become increasingly important to the Chinese economy due to its strengthening linkage with other sectors, also suggesting that Chinese enterprises are climbing up the global supply chain. In particular, the total input coefficients, which gauge how much output from each sector is used as intermediate inputs to meet one unit of increase in the final demand of the high tech sector, have steadily risen over time from 2005 to 2015.
We further set up three scenarios to analyse to what extent the risk of China-US tech war weighs on China’s aggregate output. Our results suggest that a tech war risk will decrease China’s annual total gross output by 0.54% and 0.78% respectively if its high tech sector growth slows to 6.2% and 2.0% from the previous normal level of around 13.4%.
