Hong Hao: Rebound vs. Bottom
2018-07-30 IMI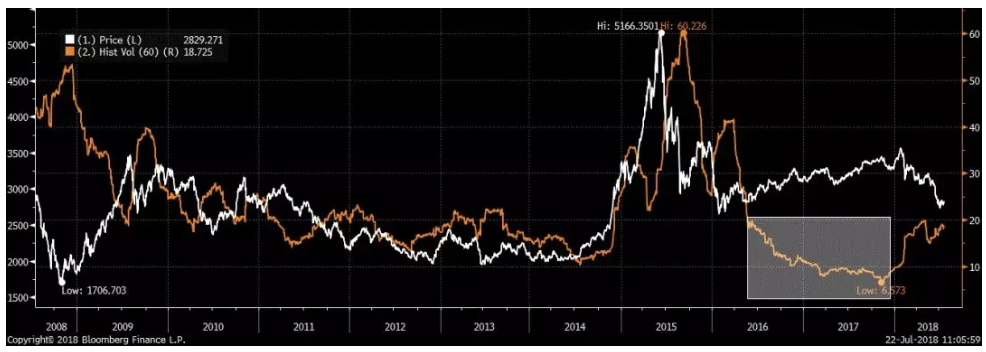 Recent policy moves suggest tactical easing. When confronted with difficult choices, one shall not underestimate people’s brittleness to deflect from the original intent. There have been many interpretations of the new rules on the asset management industry, and some interpretations from pundits are even more verbose than the new rules themselves.
But in general, we detect a stealth shift in policy tones by observing some bends on the existing guidelines announced just a few months ago. These bends include that mutual funds can now invest in non-standard instruments, funds’ valuation is allowed not mark-to-market (cost amortized), existing funds can be reinvested into new products and duration mismatching is permitted during the transition period,as well as more latitude when bringing back off-balance-sheet items – amongst the other subtle changes.
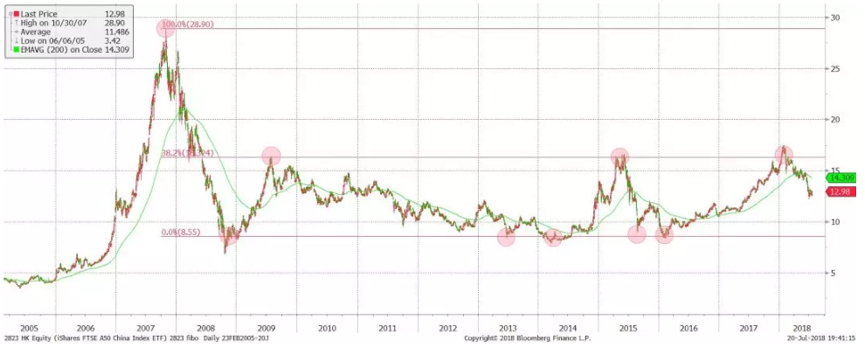
The technical details will continue to make the actual implementation challenging. However, without delving into the nitty-gritties, the changes, even though subtle, hint at a shift in policy tones. Further, while the announcement from the CBRC is full of details and almost inscrutable, the subsequent supplemental explanation from the PBoC suggests a strong intention to calm the market’s nerves. In an oversold market such as this, this news, together with the recent timely but measured liquidity relief from the central bank, can spur a technical rebound. But they are unlikely to change the general down trend (Figure 2).
Figure 2: The Fibonacci trading range of the A50 ETF has peaked, and is falling towards its lower bound
Recent policy moves suggest tactical easing. When confronted with difficult choices, one shall not underestimate people’s brittleness to deflect from the original intent. There have been many interpretations of the new rules on the asset management industry, and some interpretations from pundits are even more verbose than the new rules themselves.
But in general, we detect a stealth shift in policy tones by observing some bends on the existing guidelines announced just a few months ago. These bends include that mutual funds can now invest in non-standard instruments, funds’ valuation is allowed not mark-to-market (cost amortized), existing funds can be reinvested into new products and duration mismatching is permitted during the transition period,as well as more latitude when bringing back off-balance-sheet items – amongst the other subtle changes.
The technical details will continue to make the actual implementation challenging. However, without delving into the nitty-gritties, the changes, even though subtle, hint at a shift in policy tones. Further, while the announcement from the CBRC is full of details and almost inscrutable, the subsequent supplemental explanation from the PBoC suggests a strong intention to calm the market’s nerves. In an oversold market such as this, this news, together with the recent timely but measured liquidity relief from the central bank, can spur a technical rebound. But they are unlikely to change the general down trend (Figure 2).
Figure 2: The Fibonacci trading range of the A50 ETF has peaked, and is falling towards its lower bound
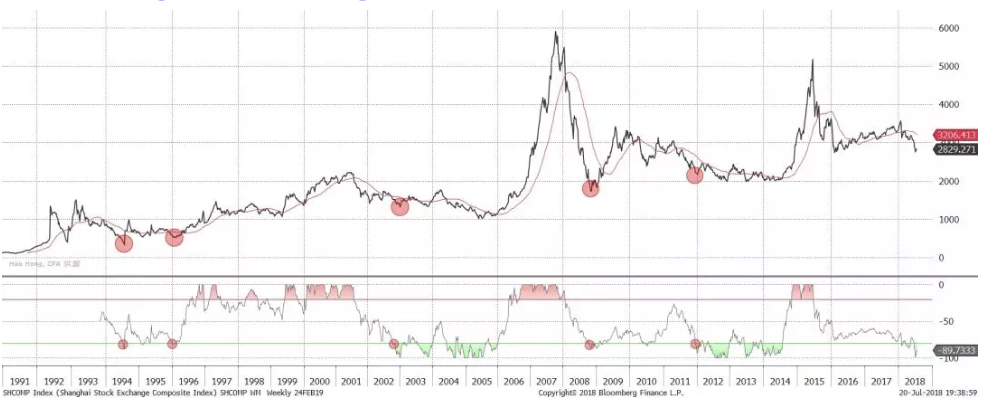
 Our long-term allocation model suggests that the market bottoming process tends to be extended and quite involved, as it had been between 2002 and 2005, and 2012 and 2014. The v-shaped market bottom seen in late 2008 is a result of the decisive four-trillion-yuan stimulus amid the worsening global financial crisis. The policy stance is still far from a similar inflection point as in November 2008. And till this day, we are still paying for the consequences – the long-term cost associated with maintaining market stability.
Figure 3: Our long-term allocation model suggests market bottoming is a prolonged process
Our long-term allocation model suggests that the market bottoming process tends to be extended and quite involved, as it had been between 2002 and 2005, and 2012 and 2014. The v-shaped market bottom seen in late 2008 is a result of the decisive four-trillion-yuan stimulus amid the worsening global financial crisis. The policy stance is still far from a similar inflection point as in November 2008. And till this day, we are still paying for the consequences – the long-term cost associated with maintaining market stability.
Figure 3: Our long-term allocation model suggests market bottoming is a prolonged process
 Redefining Market Bottom – A New Perspective
Risk is both a foe and a friend of return. Recently, the chanting of market bottom has been growing ever louder. Yet the market dives lower. As aforementioned, the stability campaign since the burst of 2015 market bubble comes with a price. As the most sensitive assets with an actively traded secondary market, stocks are the first to reflect the “accomplishments” of the said campaign – with market volatility plunging to historic lows.
The underlying premise to maintaining stability is that market volatility is nefarious. Yet, in Figure 4 we show that volatility can be a necessity of return when the market is rising, but also a trigger for drawdown when the market is falling. As the regulator tries to manage away market volatility, it has also gradually eliminated the source for return.
It is for this reason that last year a majority of the stocks fell in the Shanghai Composite, even though the overall index has managed to deliver very positive returns. The mirror image of the long A50 trade last year is the declining market volatility to its historic lows.
As such, this trade is equivalent to the short volatility trade that collapsed during the selloff in late January. It is almost like shorting puts to collect premium when market volatility is falling – only that if market volatility spikes, losses could be unbounded. Market stability itself breeds instability, as it spurs market participants’ risk appetite: a concentrated portfolio in A50, for instance.
Figure 4: Volatility is a necessity of return & trigger for drawdown. Moving average skews return distribution
Redefining Market Bottom – A New Perspective
Risk is both a foe and a friend of return. Recently, the chanting of market bottom has been growing ever louder. Yet the market dives lower. As aforementioned, the stability campaign since the burst of 2015 market bubble comes with a price. As the most sensitive assets with an actively traded secondary market, stocks are the first to reflect the “accomplishments” of the said campaign – with market volatility plunging to historic lows.
The underlying premise to maintaining stability is that market volatility is nefarious. Yet, in Figure 4 we show that volatility can be a necessity of return when the market is rising, but also a trigger for drawdown when the market is falling. As the regulator tries to manage away market volatility, it has also gradually eliminated the source for return.
It is for this reason that last year a majority of the stocks fell in the Shanghai Composite, even though the overall index has managed to deliver very positive returns. The mirror image of the long A50 trade last year is the declining market volatility to its historic lows.
As such, this trade is equivalent to the short volatility trade that collapsed during the selloff in late January. It is almost like shorting puts to collect premium when market volatility is falling – only that if market volatility spikes, losses could be unbounded. Market stability itself breeds instability, as it spurs market participants’ risk appetite: a concentrated portfolio in A50, for instance.
Figure 4: Volatility is a necessity of return & trigger for drawdown. Moving average skews return distribution
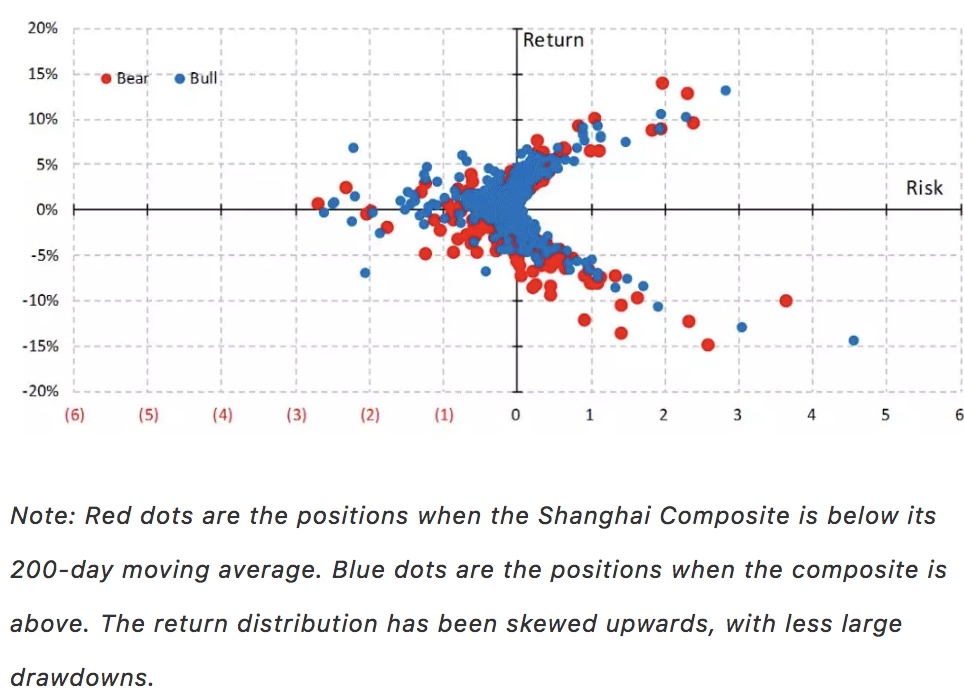 There is good volatility, and there is bad. When wading into the market as volatility is surging, our analysis in Figure 4 suggests that the odds to win are like tossing a coin, as shown in the almost symmetrical U-shaped payoff scheme on both sides of the risk axis. That is, when bottom fishing in a volatile market, as it is now, the payoff scheme is similar to simultaneously longing and shorting a market call option – you are not certain which way it will turn out, and your option premium on the long and short sides cancels each other out.
Redefining market bottom – a new perspective. Consensus defines market bottom as the lowest point in the absolute index level. Such a definition inevitably aims at return maximization at a time when risk is heightened. While valuation has cheapened, such definition is precisely the contrary of the principles of value investing, which focus on risk minimization. That is, bottom fishing is philosophically inconsistent with value investing that many are espousing as they take the plunge.
Instead, we believe that the market bottom should be defined at the point where additional risk undertaking starts to fall below additional return from such endeavor. As we cannot be certain how high return will likely be, minimizing risk in this comparison should ensure maximizing marginal return per unit of marginal risk. And this redefined market bottom is likely to be different from the absolute index level bottom defined by consensus.
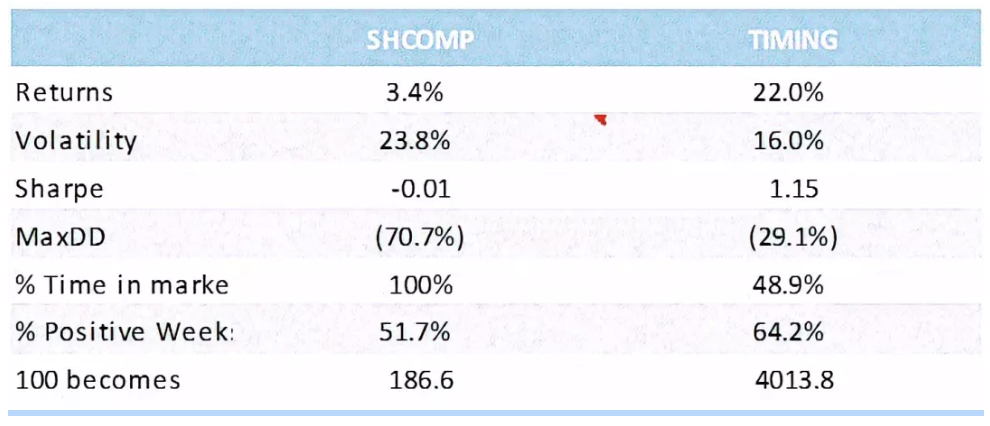
A layman’s approach to cutting most of the risk is to apply the 200-day moving average to time the market entry. Our back test suggests that being in the market only when the index level is above the 200-day moving average can significantly improve return while reducing risk – consistent with our definition of market bottom (Figure 5).
Further, we can see the reduction of risk in Figure 4, in which blue dots denote positions held when the index is above its 200-day moving average. Note that the dispersion of the blue dots is substantially narrower than that of the red dots, and skewed upwards.
Of course, ideally risk should be defined looking forward, rather than backward. At the absolute index bottom, forward risk is likely to be minimum, except that one has to know in advance. Such a perspective of market bottom invokes circular reference, and is indeed impractical.
Figure 5: Minimizing risk with simple 200-day moving average
There is good volatility, and there is bad. When wading into the market as volatility is surging, our analysis in Figure 4 suggests that the odds to win are like tossing a coin, as shown in the almost symmetrical U-shaped payoff scheme on both sides of the risk axis. That is, when bottom fishing in a volatile market, as it is now, the payoff scheme is similar to simultaneously longing and shorting a market call option – you are not certain which way it will turn out, and your option premium on the long and short sides cancels each other out.
Redefining market bottom – a new perspective. Consensus defines market bottom as the lowest point in the absolute index level. Such a definition inevitably aims at return maximization at a time when risk is heightened. While valuation has cheapened, such definition is precisely the contrary of the principles of value investing, which focus on risk minimization. That is, bottom fishing is philosophically inconsistent with value investing that many are espousing as they take the plunge.
Instead, we believe that the market bottom should be defined at the point where additional risk undertaking starts to fall below additional return from such endeavor. As we cannot be certain how high return will likely be, minimizing risk in this comparison should ensure maximizing marginal return per unit of marginal risk. And this redefined market bottom is likely to be different from the absolute index level bottom defined by consensus.
A layman’s approach to cutting most of the risk is to apply the 200-day moving average to time the market entry. Our back test suggests that being in the market only when the index level is above the 200-day moving average can significantly improve return while reducing risk – consistent with our definition of market bottom (Figure 5).
Further, we can see the reduction of risk in Figure 4, in which blue dots denote positions held when the index is above its 200-day moving average. Note that the dispersion of the blue dots is substantially narrower than that of the red dots, and skewed upwards.
Of course, ideally risk should be defined looking forward, rather than backward. At the absolute index bottom, forward risk is likely to be minimum, except that one has to know in advance. Such a perspective of market bottom invokes circular reference, and is indeed impractical.
Figure 5: Minimizing risk with simple 200-day moving average