Steve H. Hanke: Hyperinflation — a Kaleidoscope of Uses and Abuses
2019-02-12 IMI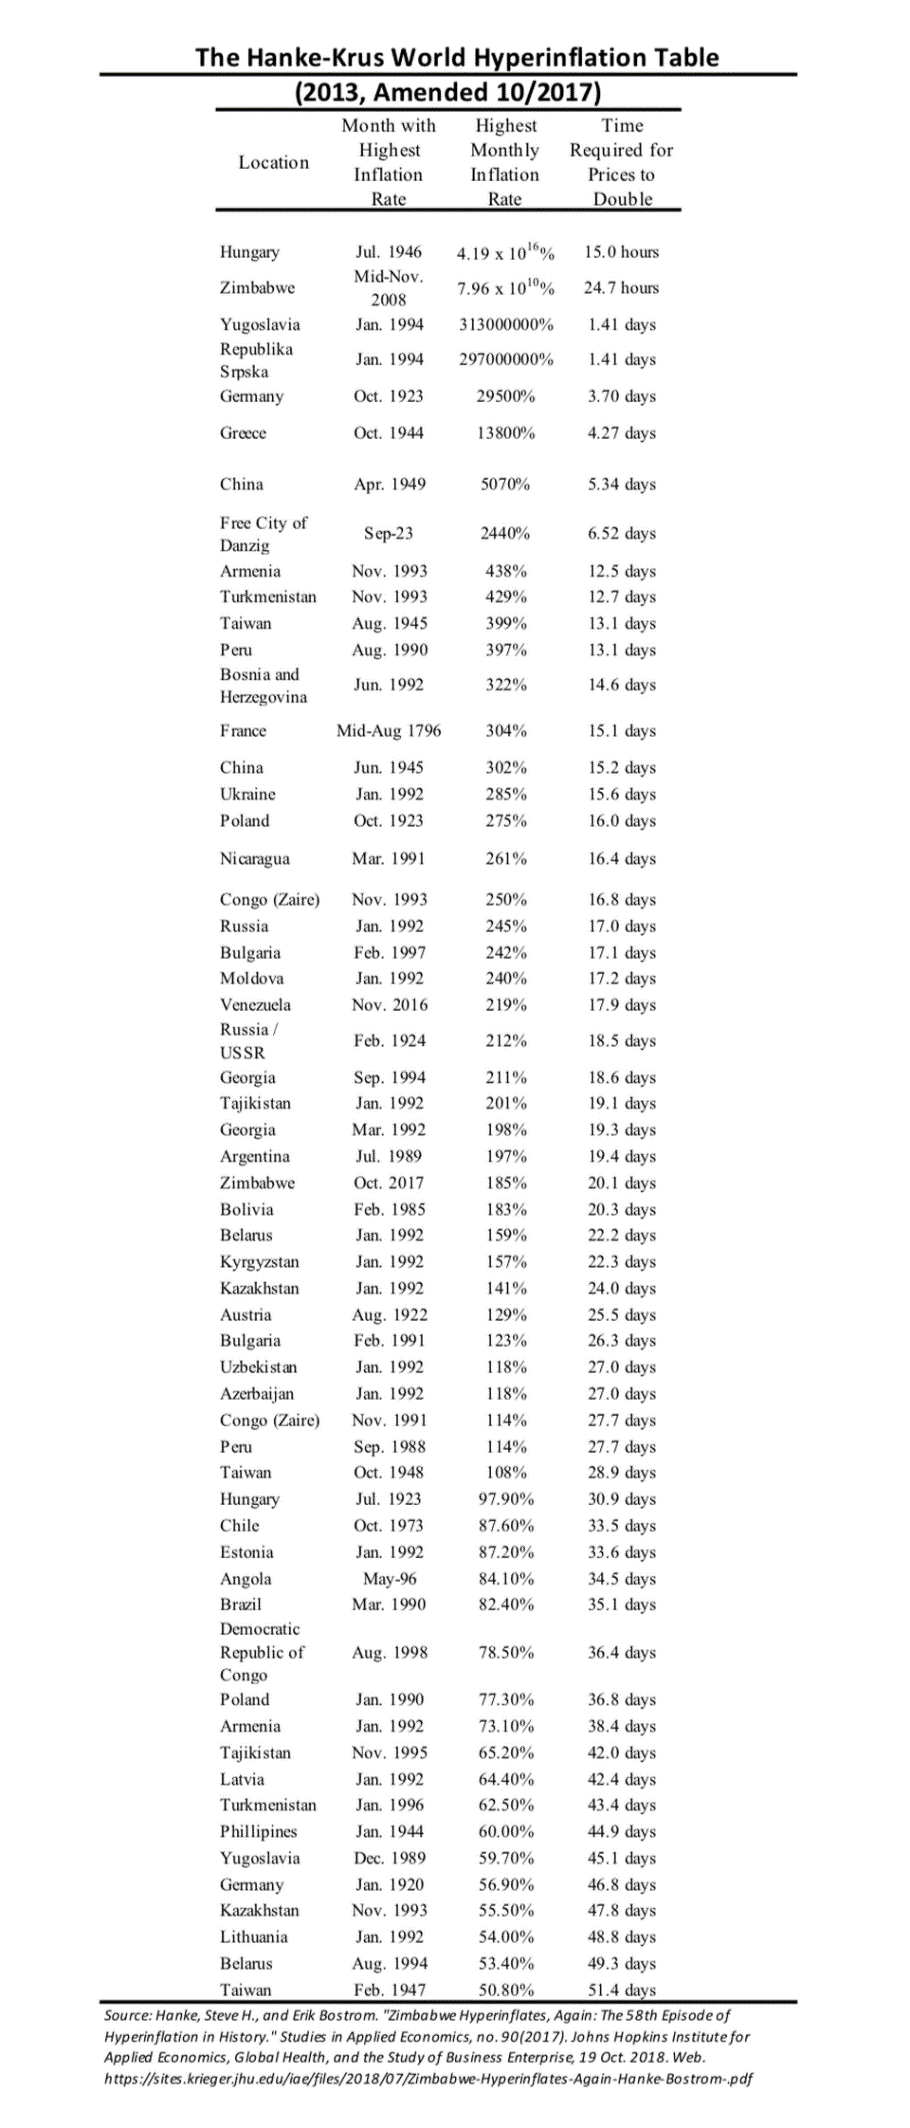
Hanke-Krus World Hyperinflation Table (2013, Amended 2017), Prof. Steve H. Hanke
Hungary holds down the top spot. Its peak hyperinflation occurred in July 1946, when prices were doubling every 15 hours. Zimbabwe’s November 2008 hyperinflation peak is second highest, but way behind Hungary’s. Indeed, at their peaks, the daily inflation rates were 207% in Hungary and 98% in Zimbabwe. The most memorable hyperinflation was Germany’s. But, it only ranks as the fifth highest, with a peak daily rate of inflation of 20.9% — way lower than the top four rates. Now, let’s turn to the world’s only current hyperinflation: Venezuela. It ranks as the 23rd most severe. Today, the annual rate of inflation is 120,810%/yr. While this rate is modest by hyperinflation standards, the duration of Venezuela’s hyperinflation episode, as of today, is long: 27 months. Only four episodes of hyperinflation have been more long-lived. So, how do we accurately measure hyperinflations? Well, let’s take a look at Venezuela’s case. There is only one reliable way to measure. The most important price in an economy is the exchange rate between the local currency — in this case, the bolivar — and the world’s reserve currency, the U.S. dollar. As long as there is an active black market (read: free market) for currency and the data are available, changes in the black-market exchange rate can be reliably transformed into accurate measurements of countrywide inflation rates. The economic principle of purchasing power parity (PPP) allows for this transformation. And, the application of PPP to measure elevated inflation rates is rather simple. Evidence from Germany’s 1920-1923 hyperinflation episode — as reported by Jacob Frenkel in the July 1976 issue of the Scandinavian Journal of Economics — confirms the accuracy of PPP during hyperinflations. Frenkel plotted the Deutschmark/U.S. dollar exchange rate against both the German wholesale price index and the consumer price index (CPI). The correlations between Germany’s exchange rate and the two price indices were very close to unity throughout the period, with the correlations moving to unity as the inflation rate increased. Beyond the theory of PPP, the intuition of why PPP represents the ‘gold standard’ for measuring inflation during hyperinflation episodes is clear. All items in an economy that is hyperinflating are either priced in a stable foreign currency (the U.S. dollar) or a local currency (the bolivar). If goods are priced in terms of bolivars, those prices are determined by referring to the dollar prices of goods, and then converting them to local bolivar prices after checking with the spot black-market exchange rate. Indeed, when the price level is increasing rapidly and erratically on a day-by-day, hour-by-hour, or even minute by-minute basis, exchange rate quotations are the only source of information on how fast inflation is actually proceeding. That is why PPP holds, and why we can use high-frequency (daily) data to calculate Venezuela’s inflation rate, even during episodes of hyperinflation. Even though we can measure hyperinflation very accurately using PPP, no one has ever been able to forecast the magnitude or direction of hyperinflations. But, that hasn’t stopped the International Monetary Fund (IMF) from producing forecasts for hyperinflation in Venezuela. Even though the IMF does not measure Venezuela’s hyperinflation, something that can be reliably done, the IMF does forecast hyperinflation, something that cannot be reliably done. Indeed, forecasts for hyperinflation can’t be found in the scientific literature. That impossibility hasn’t stopped the IMF from throwing economic science to the winds. Yes, the IMF has regularly been reporting what are, in fact, absurd inflation forecasts for Venezuela. These forecasts have been issued under the watchful eye of Alejandro Werner, the head of the IMF’s Western Hemisphere Department. The chart below presents the IMF’s finger-in-the-wind forecasts (read: nonsensical folly).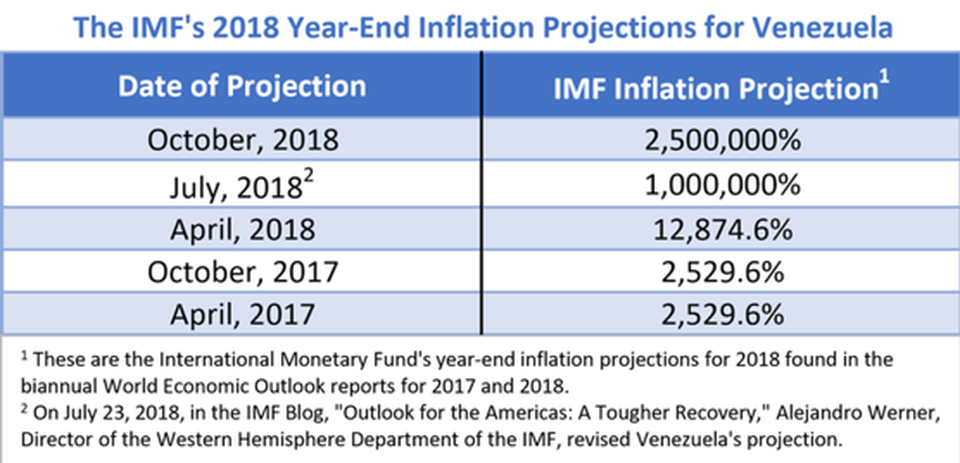
The IMF’s 2018 Year-End Inflation Projections for Venezuela, Prof. Steve H. Hanke
Surprisingly, the press dutifully reported the IMF’s forecasts that Venezuela’s annual inflation rate would hit a whopping 2,500,000% by the end of 2018. In some cases, this figure was reported as a forecast, which it was. By some, it was even reported as an actual measurement, which it was not. In any case, the IMF’s ‘guestimation’ was a bit off. I measured Venezuela’s annual inflation rate on December 31, 2018, and it was 80,000%/yr. When it comes to hyperinflation and its abuses, there is no one more guilty of malfeasance than the IMF. It repeatedly produces what no one can produce: reliable forecasts of hyperinflation.