Hong Hao:Market Inflection Point is Confirmed
2019-03-26 IMIFigure 1: Macro volatility has collapsed since ~2010/11 across variables, except PPI
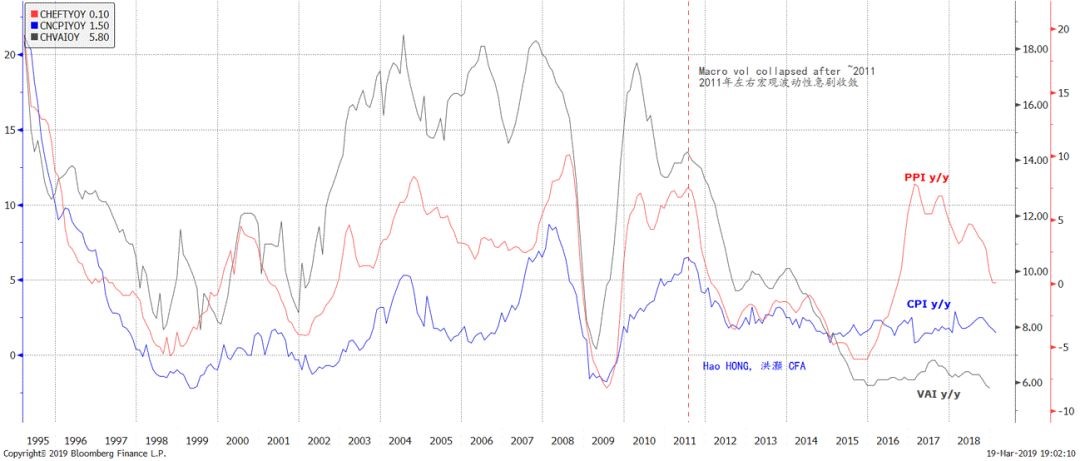
Source: Bloomberg, BOCOM Int'l
The “Fed Put” is based on declining macro volatility. In the past decade, the trade to short volatility has been in vogue, largely based on the “Fed Put” – it will bail out the market every time it runs into trouble. As persistent liquidity supply suppresses market volatility, it is lucrative to bet on declining volatility – all the way until the “vol crash” in January 2018, when cumulative gains of several hundred percent over the years by some specialty short-vol funds returned to zero. Social Inequality Suppresses Price Volatility Labor wage growth lags productivity gains, suppressing price volatility. Besides central bank easing suppressing market volatility, we believe that other macroeconomic reasons are behind the disappearing macro volatility. In our series of special reports on social inequality and secular disinflation, we posited that the disinflation experienced by the global economy since early 1980s is a reflection of the exploitation of “surplus value” produced by the working class. This process is evidenced by labor productivity gain consistently outpacing wage growth for the past three decades, concurring with falling inflation and long bond yields. (Figure 2; for the lack of better expressions, we have borrowed some terms from Karl Marx, one of the seminal figures on labor economics; please refer to our special report “A Price Revolution” on 20161114).Figure 2: Productivity gains outpaced wage growth, creating social inequity/suppressing inflation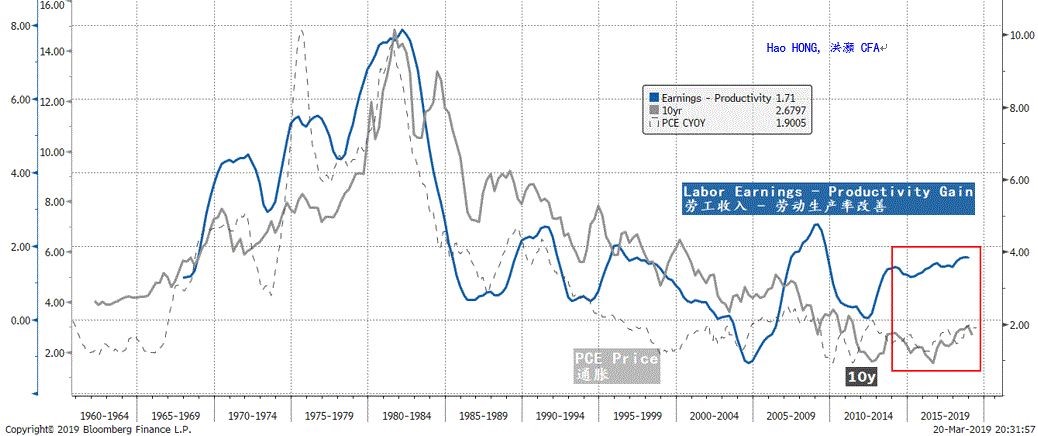
Source: Bloomberg, BOCOM Int'l
Social inequity suppresses price volatility. In a follow-up report, we further posited that such inequality in sharing productivity gains is indeed the cause of persistent disinflation (“Decoding Disinflation: Principal Contradiction, Social Progress and Market Fragility”, 20171114). This is simply because the masses are inadequately compensated and thus under consume, while the consumption by the rich few cannot make up for the loss in consumption by the masses. The consequent oversupply by productivity gains relative to the under-consumption by inadequate wage growth exerts downward pressure on consumer prices. Our theory is empirically consistent with various social developments in the past three decades. Price stability masks the ills of social inequity, and brews populism. China has undergone tremendous social transformation since its “Reform and Open” in 1978. As “a few get rich first”, the chasm between different social classes widens. And the income disparity in China is probably one of the most glaring in the world – before official statistics are no longer published. Not surprisingly, consumer price volatility has also been disappearing in China. Changes in China’s Savings and Investment The above discussions probably explain in part why price volatility declines across the globe. But, specifically for China, there are other macro forces at work. China’s macro savings rate falls, money supply growth and FAI slow. We note that, around 2010-11, Chinese habit of saving and investment changed significantly. The accumulation of current account surplus slowed sharply after 2009. It is a reflection of decelerating macro savings rate, and of lesser ability to attract foreign savings. As savings equal investment, fixed asset investment (FAI) growth slowed in tandem. An economic structure tilted more towards consumption should be less volatile and experience more price stability. Meanwhile, broad money supply growth (M2) also fell, corresponding to the slowing accumulation of positions for FX purchase (Figure 3).Figure 3: China’s habit of saving and investment changed around 2010/11
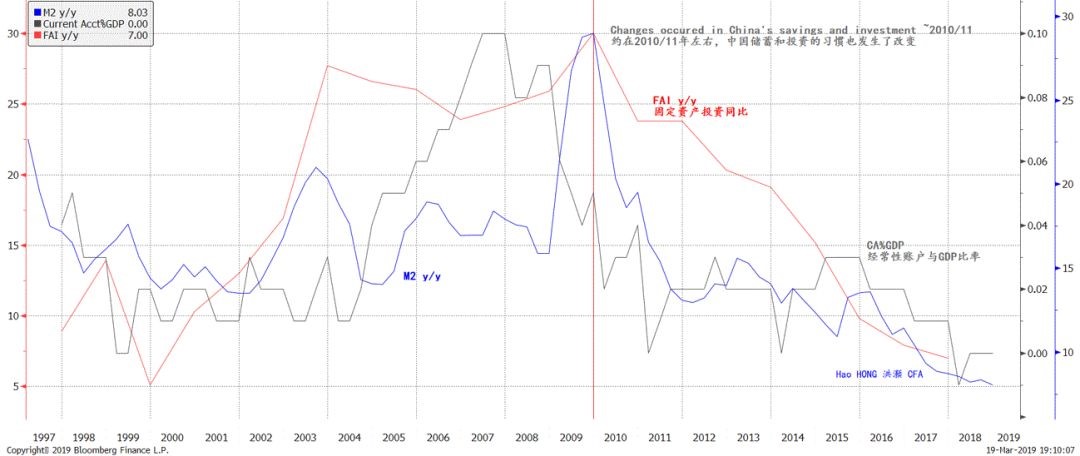
Source: Bloomberg, BOCOM Int'l
The US saves more and contributes less to China’s money growth. The Chinese and the US economies used to complement each other very closely. China produces, America consumes. As such, the US current account deficit, the result of excess US consumption, used to be an important source of liquidity to China’s monetary system. As the US households tried to deleverage after 2008, the US current account deficit as a percentage of US GDP has in fact fallen substantially. China’s falling current account surplus as a percentage of GDP is in part an image of improving US current account balance. And hence China’s falling money supply growth. This is an important observation for asset pricing. Broad money supply growth used to be essential for the performance of Chinese stocks. Without it, we would not have seen the big recovery rally after the “four-trillion-yuan” stimulus, and the lackluster returns in the ensuing years as money growth fell. China’s credit expansion no longer compensates slowing money growth. As money growth decelerates, other liquidity ingredients are necessary to induce a rally in Chinese shares. Here is where domestic credit growth comes in – the instigator of the stock market bubble in 2015. At the inception of the bubble, credits extended for the purpose of reconstructing shanty downs found their ways into the stock market. Data shows that, around 2015, domestic credit growth substantially outpaced money supply growth. But as credit growth was reined in, and converged with the growth in money supply, the stock market bubble burst (Figure 4).Figure 4: Credit growth was the instigator of the 2015 bubble
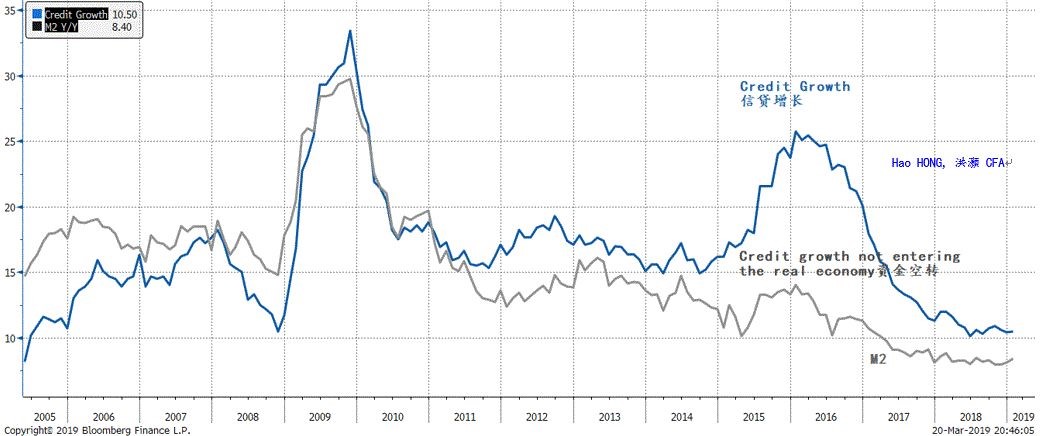
Source: Bloomberg, BOCOM Int'l
In today’s milieu of decelerating economic growth, money supply growth stays low, and credit expansion is constrained by the mantra of deleveraging. A new ingredient is required to sustain the current bull market. How to Make Money in A Shares? A lack of corporate pricing power. In the previous sections, we have discussed how macro volatility has collapsed across the board, except PPI. It is plausible that PPI is less affected by monetary policy choices, as these choices should have no influence over the vagaries of nature and hence crop harvests, or mining discoveries and hence the production costs of industrial commodities. If we use the gap between CPI and PPI as a proxy for corporate margin, we will be immediately confronted by a dilemma. The volatility in CPI is depressed by social inequality and the change in China’s savings and investment habits, but the volatility in PPI is still ruled by nature, and remains fickle. Suddenly, a picture of diminishing corporate pricing power emerges, as control over upstream costs lags behind the control over downstream prices. Margin likely to rise further. One logical inference from this observation is that, if CPI rises faster than PPI, or corporate margin expands – as it is now, then the company’s stock should do well (Figure 5). And vice versa. In Figure 5, we show a close correlation between the gap of CPI vs. PPI, i.e. margin, and that of M2 vs. M1, i.e. money multiplier. As monetary conditions loosen, as they do now, corporates’ operating environment should improve. Consequently, margins tend to expand.Figure 5: Rising money multiplier suggests that profit margin should expand further
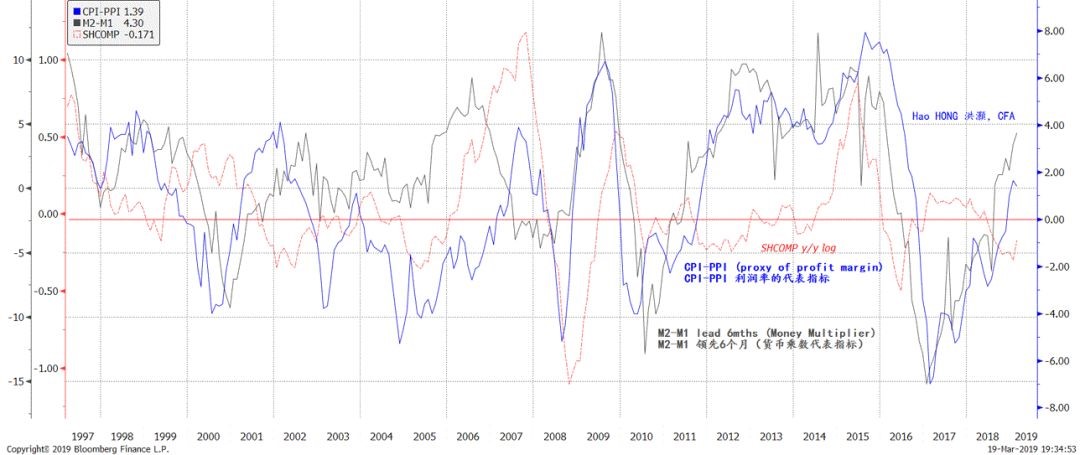
Source: Bloomberg, BOCOM Int'l
Valuation explains the bulk of stock return; earnings ability a secondary concern. A second logical inference from this observation is that, given corporates have less pricing power in an environment with collapsing macro volatility, earnings will matter less in pricing those corresponding stocks. And for the observed stock market gyrations, especially as they are now, other factors determining stock returns must be at work. We then decompose stock returns into two components: earnings growth and valuation expansion. As discussed above, earnings growth should contribute less to stock returns, as corporate pricing power is diminishing in the new macro environment. Therefore, valuation multiple, the remaining candidate, should be the most important source of stock returns. Indeed, we can see that earnings growth has accounted for less and less of stock return since 2006, while the changes in valuation multiple have been increasingly driving the returns (Figure 6). Such effect was most palpable during the rally in 2009 and the bubble in 2015, when liquidity was abundant but fundamentals were down the drain. A shares can rally without fundamentals for a while, until valuation strays too far from them, and the rally collapses by its own weight.Figure 6: Changes in valuation explain the bulk of return; earnings growth is secondary
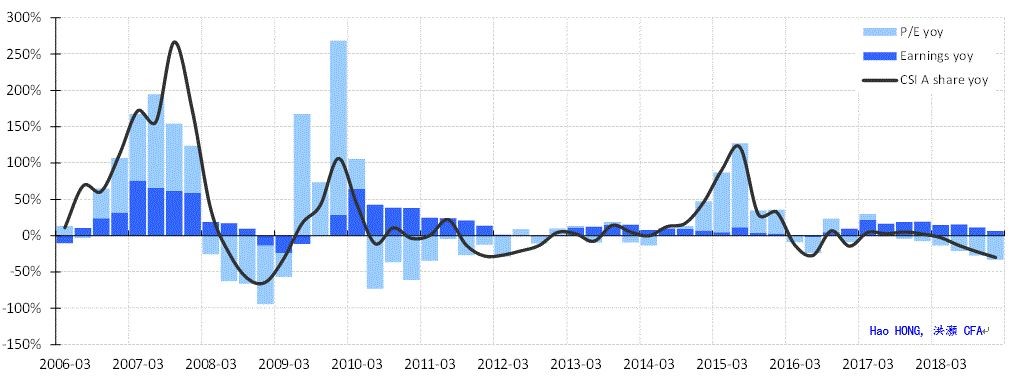
Source: Bloomberg, BOCOM Int'l
Investment Implications All alpha is beta. We have discussed that corporate margins are less of a choice than a product of macroeconomics, and that stock returns are more influenced by valuation multiple expansion than by earnings growth. As such, the bulk of stock return is actually systemically driven by monetary policy. Almost all alpha is beta. In such an environment, we should observe the following: (1) The market universe will be increasingly dominated by index funds. Or the market will gradually be indexation-ized, as much of the return is driven by the systemic valuation multiple expansion rather than idiosyncratic earnings power. In fact, the US market now has more listed ETFs than stocks. China’s index funds are rising. (2) The central bank is the most important determinant of stock returns. The investment process hence will become more speculative – not less. It explains why the world is more obsessed with the policy choices of the central banks. And now the questions that we were confronted at the conference mentioned at the opening of this report are entirely pertinent. (3) As the ability to take on systemic risks is rewarded, stock picking skills will be increasingly irrelevant. Eventually, the ability to generate return depends on whether one’s balance sheet is sizable enough to absorb systemic risks when they are due. Or else simply succumb to redemption pressure. (4) There is no “fundamental” bull. Only “sentiment” bull, “leverage” bull or “liquidity” bull. Market prices can stray from fundamentals for some time, as long as liquidity/credit conditions are supportive. Our experiences during the 2015 bubble have educated us well. Keynes’ saying that the market can stay irrational longer than one can stay solvent rings even more true. The “patient bull” that many are hoping for is not supported by data evidence. Market Outlook Where else will liquidity come from? We have discussed the necessary ingredients for a raging bull market, also known as bubble. One of these ingredients includes valuation multiple expansion induced by loosening liquidity conditions. Earnings growth alone will not be sufficient. As the market surges and trading volume explodes back to above the one trillion-yuan mark, there are many excited by the prospects of 2015 once more. It pays to investigate where liquidity will come from. Unlikely from savings. It is unlikely that China’s current account surplus versus GDP, or the country’s macro savings rate, will recover to pre-2009 highs. The way that the PBoC creates money supply has changed. And the new trade relationship after China’s talks with the US suggests further shrinkage in current account surplus as a percentage of GDP, and hence in the macro savings rate. Unlikely from credit growth. Domestic credit can expand. Yet, after the explosive surge of bank lending in January, loan growth subsided in February. And it was well below expectations. Monetary statistics in March will elaborate the central bank’s attitude towards credit re-expansion. Our best guess is that easing will remain restrainedly supportive. The rhetoric from the PBoC also hints at such inclination. Foreign buying and domestic margin trading. The remaining channels for new liquidity for the A shares will be foreign buying and domestic margin trading. Yet, as we have discussed in detail in our previous report “Who’s Buying? Who’s Next” (20190311), margin trading turnover as a percentage of total market turnover is approaching its 12% upper limit observed since the 2015 bubble burst. Recently, regulators have forbidden the participation of OTC margin trading via brokers. Given the lessons from 2015, margin trading are unlikely to escape the scrutiny from the regulators. That said, offshore leverage trading is buying A shares via the Connect Scheme, and is difficult to regulate. These leveraged monies have been buying some stocks all the way to their foreign trading limits. The fact that regulators are considering relaxing these limits is a good sign, although it will take time. Global index inclusion. This year marks the further opening of China’s capital market. The Foreign Investment Act has been passed. And MSCI and FTSE will raise the weight of A shares further in their global indices, obliging foreign funds to increase allocation towards A shares. Although initially estimated at a few hundred billion yuan in size, these funds will increasingly become an important part of China’s capital market.Figure 7: US MZM is unlikely to grow much slower, as the US economic growth peaks out; Fed will pause
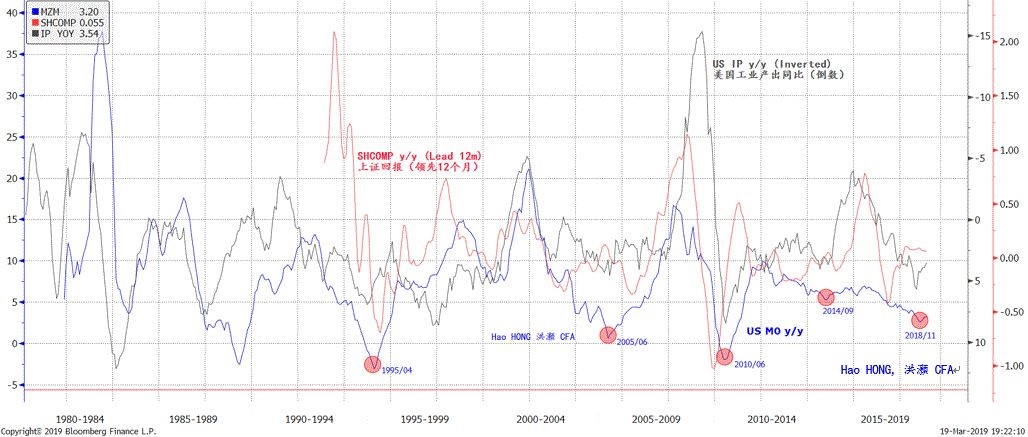
Source: Bloomberg, BOCOM Int'l
Figure 8: Low points in US MZM growth coincide with important inflection points in A shares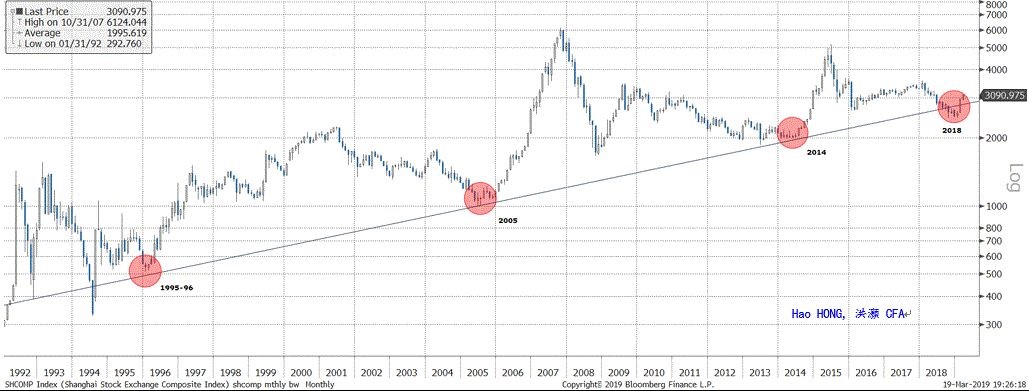
Source: Bloomberg, BOCOM Int'l
US MZM growth approaching historical lows that used to correspond to important inflection points in A shares; the Fed should pause. Meanwhile, the supply growth of US’ money of zero maturity (MZM) has decelerated to a low level comparable to its historical lows. These historical lows tend to correspond to peaking economic growth, as well as important inflection points in the Chinese stock market. This observation is consistent with our discussions regarding the importance of 2,450 in our 2019 outlook report “Turning a Corner” (20181119). That is, given the prospects of slowing US growth going into 2019, it is unlikely that the Fed will continue its tightening, unless inflation is too high to bear. Easing US liquidity condition has been conducive to important turning points in the Chinese stock market in the past (Figure 7 and Figure 8). This time it should not be any different. Long-term upward trend trumps short-term moves. For now, as foreign buying has hit the trading limit, and regulators have revealed their attitude towards margin trading, the A shares are pausing. The fact that the rotation between large and small caps, and the changing market leadership between A50 and ChiNext as the Shanghai Composite hovers around 3,000 suggest that market liquidity is approaching its near-term limits. But the Fed pausing tends to augur well for the A shares. While volatility will likely persist in the near term, for us, the long-term trend continues to trump short-term moves.