Hong Hao: A Margin Bull. What Next?
2019-03-05 IMIFigure 1: Turnover bottom and reversal tend to indicate market turning points
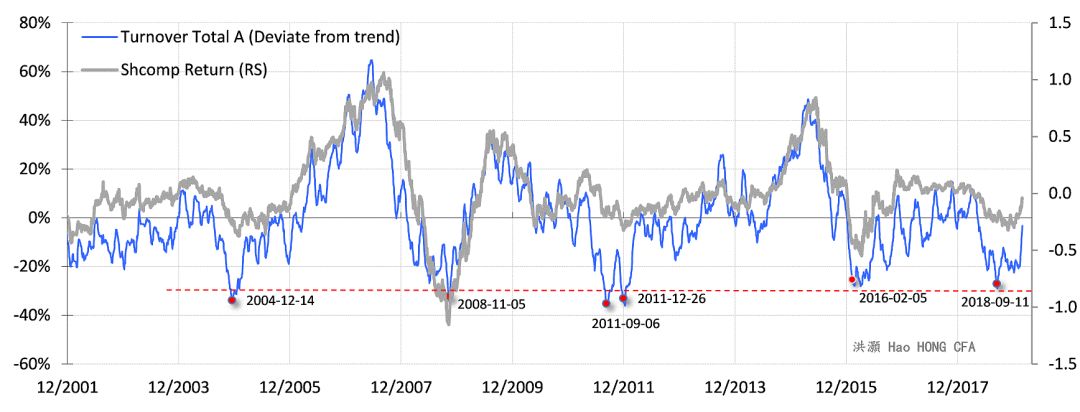
Source: Bloomberg, BOCOM Int'l
As such, trying to discern the market's peak and trough based purely on price movements can be fraught with biases. We are more curious about the record surging market turnover concurrent with the market recovery. Our quantitative analysis demonstrates that such record turnover indeed is rich in auspicious information about the future (Figure 1). For instance, we find that when turnover deviates significantly from its trends on the downside, such as in December 2004, November 2008 and February 2016, the market tends to bottom out in the ensuing months. The last observation of such an occurrence was in September 2018, and the market bottomed out approximately one month later. Incidentally, our call of the Chinese bubble burst on 20150616 was also based on abnormally high turnover that was suggesting fervent speculative activities then, besides other developments (Please refer to “The Great China Bubble: Lessons from 800 Years of History”, 20150616). As such, from a technical perspective, the market had arrived at a significant low last October at ~2,450. This conclusion drawn from turnover analysis is consistent with the conclusions from our other quantitative models (Please refer to “Turning a Corner”, 20181119 and “Turning a Corner: Teachings from “the Dog””, 20190201). It is also consistent with our calculation of the market bottom based on the relationship between Chinese market return and the implicit growth target embedded in the Five-Year Plan more than two years ago (Please refer to “The Market Bottom: When and Where”, 20160606). We have shared our findings with top government officials. … But the economy will continue to struggle Market participants are beset by the seeming contradiction between a surging stock market and weak earnings with blood-bath goodwill write-downs. While the market tends to bottom out before the economy, such glaring divergence between the so-called fundamentals and a surging market schematic begs the doubts – and rightly so. A Chinese market wisecrack once says, “If you care too much about the fundamentals, you have already fallen behind before the game even starts”. There is an element of truth in it. But prices cannot deviate significantly from fundamentals too far for too long. If prices have jumped the gun, but fundamentals cannot catch up, then later on prices must come back to earth. As such, it pays to investigate where the fundamentals are, after the market surge. Our analysis shows that industrial goods inventory level is still quite high. Indeed, the entire 2018 saw the inventory days of industrial goods remaining elevated at one of its highest levels in recent years. The inventory level of steel finished goods is particularly high. Historically, such persistently high inventory levels tend to suggest weak demand, and can be a drag on growth as destocking starts later (Figure 2). As such, the surging market has clearly left the fundamentals behind. And time is running out. While the economic cycle is troughing, as we have discussed in our previous reports (Figure 4-6), it requires government initiatives to jolt it back to life. We have seen decisive monetary easing, as evidenced by the epic total social financing data and new lending data. The PBoC has been using some innovative monetary facilities, such as the TMLF, to try to resolve the structural issues in the Chinese monetary system. But it is likely to take time. Banks are more willing to lend to large SOEs, because they are perceived to be less risky. And SMEs used to have to rely on shadow banking to an extent for financing. While the central bank is trying, banks’ risk appetite is sediment of Chinese commercial banking history, and is thus unlikely to change overnight. There have also been tax cuts amounted to hundreds of billions of yuan since late last year. But these policy relieves are likely to have been in the price. Property investments, a credit generator with strong multiplier effect on the economy, remain weak. Meanwhile, infrastructure project approvals have surged, but probably a seasonal phenomenon. Also, the approvals tend to be front-loaded in the year to allow enough time for execution in the remainder of the year. As such, it remains to be seen how strong a recovery it could be in the current cycle, with the property sectors largely confined.Figure 2: Industrial inventory destocking is set to begin, and will dampen growth and risk assets’ price
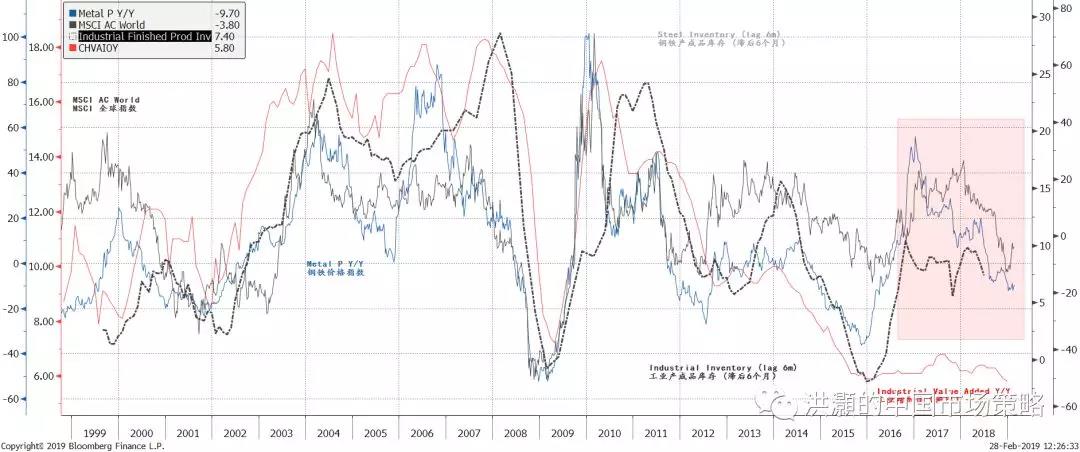
Source: Bloomberg, BOCOM Int'l
Margin trades are key to current bull market If fundamentals have diverged from the surging market prices, and are likely to remain weak due to the constraints we discussed above, then the question begging to be asked is - is the current rally sustainable, and how much further could it go from here? In our outlook report titled “Outlook 2019: Turning a Corner” on 20181119, we discussed that 2019 will be the year when the Chinese economic cycle reaches its trough. We have also outlined a trading range of ~2,000 to ~2,900, with more than six months trading above 2,350, for the Shanghai Composite in part based on this outlook. The lower end of the trading range corresponds to a scenario where the trade disputes could not be resolved satisfactorily. We must emphasize that it is a risk scenario, not our base case. Now that the Shanghai Composite has risen to the upper end of our trading range, we must re-exam to see whether our trading range for the period till November 2019 still holds. Our analysis shows that margin trades, as their importance in trading is rapidly increasing and has caught the attention, are indeed closely correlated with the trajectory of the Shanghai Composite. The composite’s important peaks and troughs, especially for periods shorter than six months, can be clearly identified by the tops and bottoms in the intensity of margin trading. That is, it is reasonable to conclude that these margin trades and the ups and downs in the Shanghai Composite are mutually reinforcing. The recent surge in the Shanghai Composite is clearly driven by the margin trades (Figure 3).Figure 3: Margin trades drive Shanghai, and have bottomed out in late December
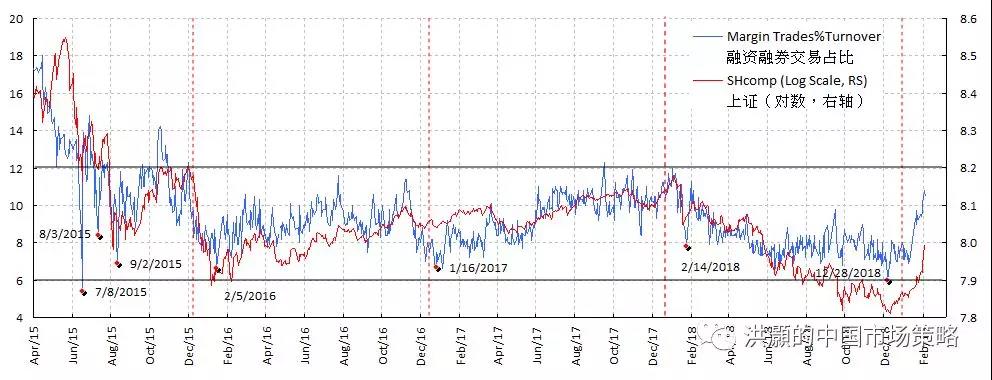
Source: Bloomberg, BOCOM Int'l
Further, we can see that since we have data for the margin trades, as a percentage of total market turnover it seems to be oscillating within a fixed range – between 6% and 12% of the total market turnover. If this range continues to hold, at the current 11% of the total market turnover, margin trades are likely to be very close to their short-term ceiling. No wonder the regulators have started to sound alarmed, as more margin trades are piling into the market. As such, the intensity of margin trades is a good indicator of the speculative sentiment. It is likely that the peaks in these ranges were induced by regulator’s reining-in of the margin trades as they heated up to prevent the market from overheating – lesson learned from the 2015 market bubble burst. The percentage of market turnover in margin trades is now very close to the top of the historical range. Thus, it is reasonable to assume that the current surge driven by these trades will soon run into strong resistance. And the market’s volatile trading in recent days appears to be confirming this conjecture. The regulator’s attitude towards margin trades is unlikely to flip. We therefore will not be so hasty to upgrade our trading range significantly for now. This is not the best place to add risks, compared to where the market was when our last report was published (“Turning a Corner: Teachings from “the Dog””, 20190201). That said, the bottom of ~2,450 seen last October and again in January is likely to be the bottom for this cycle – unless the trade negotiation turns out to be unsatisfactory. 2,450 has also been confirmed by the turning of China’s economic cycle.Figure 4: Earnings estimates have recovered, after reaching their lows in last October
Source: Factset, BOCOM Int’l
Figure 5: Earnings estimates have recovered across various sectors
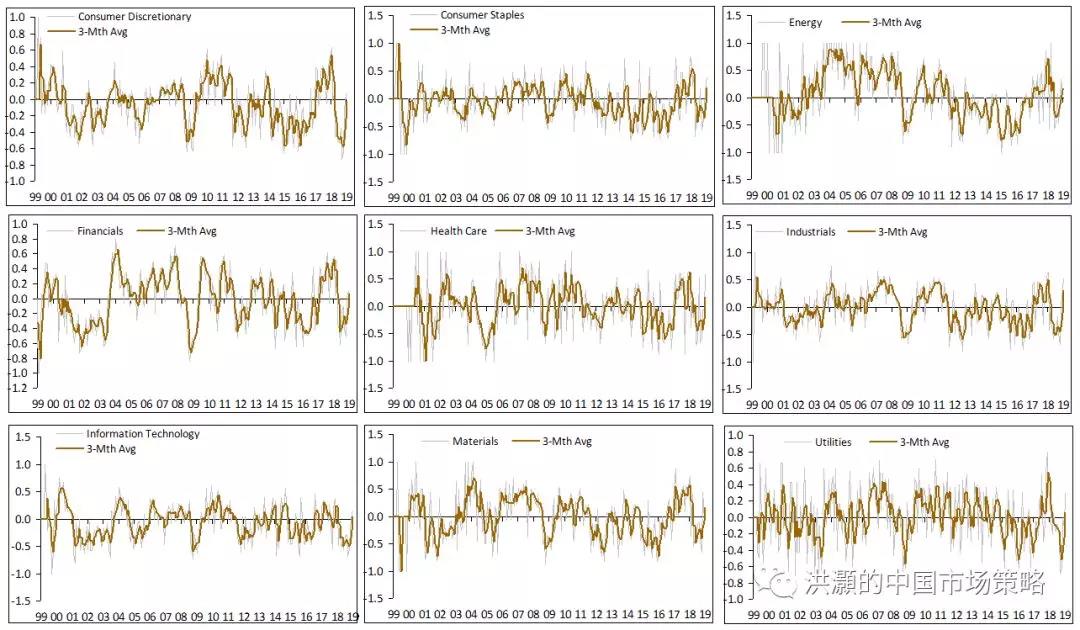
Source: Factset, BOCOM Int’l
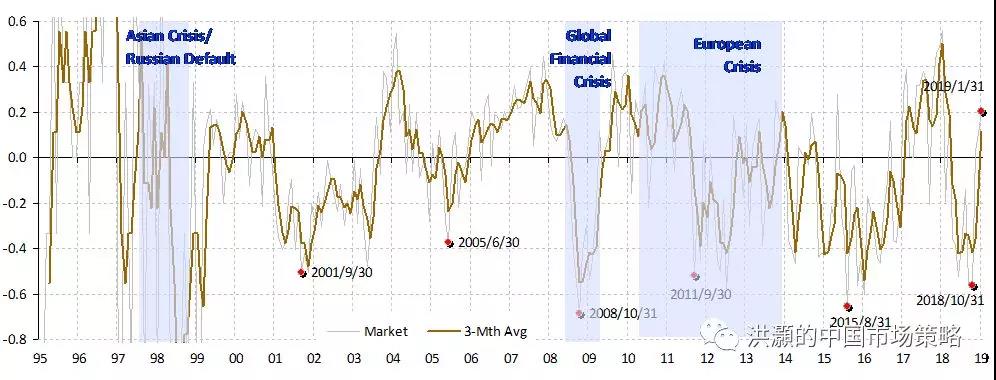
Figure 6-1: China’s 3-year short economic cycle is troughing
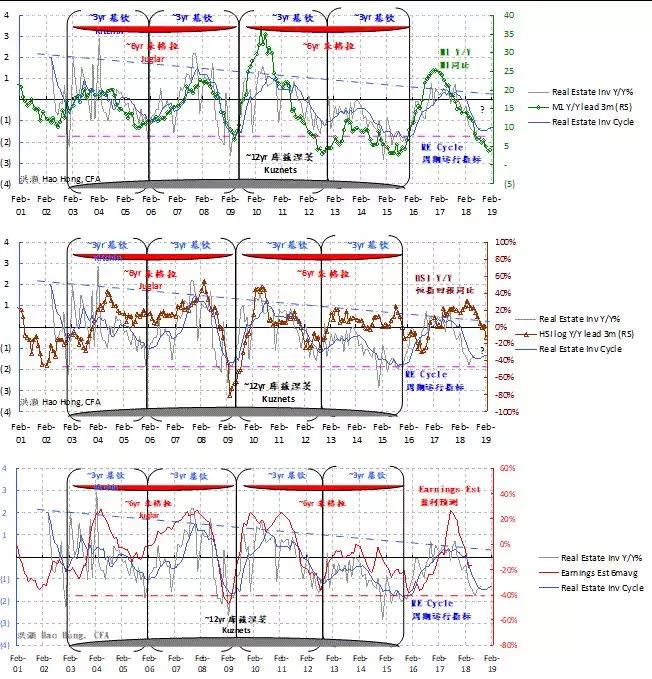
Source: Bloomberg, BOCOM Int’l
Note: Property construction, part of overall completed property investment that also includes land purchase, is more closely correlated with economic activities. Due to the irregularities of the data release since 2017, we have used the construction data series to calculate the property investment cycle. Only selected cyclical charts are shown here. For complete detailed discussions on China’s 3-year short economic cycle, please refer to your reports titled ”A Definitive Guide to China’s Economic Cycles” and “A Definitive Guide to China’s Economic Cycles II – New High ” (20170828).Figure 6-2: China’s 3-year short economic cycle is troughing
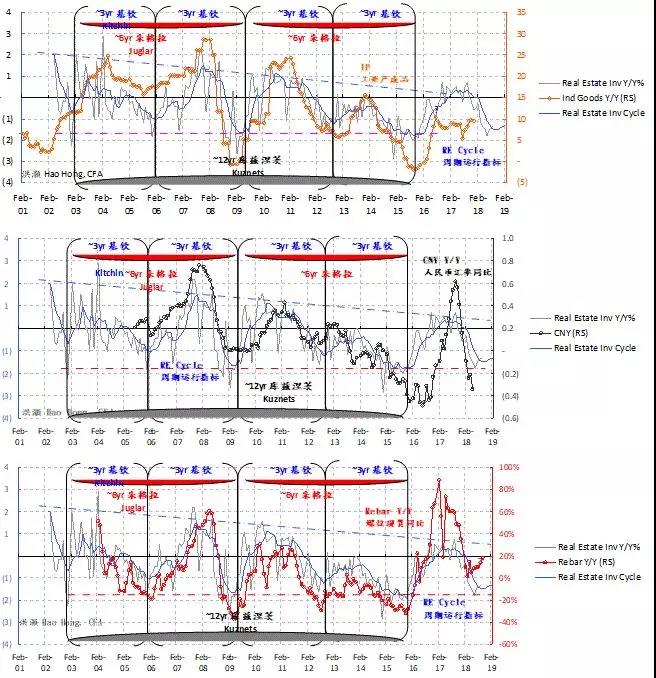
Source: Bloomberg, BOCOM Int’l
Note: Property construction, part of overall completed property investment that also includes land purchase, is more closely correlated with economic activities. Due to the irregularities of the data release since 2017, we have used the construction data series to calculate the property investment cycle. Only selected cyclical charts are shown here. For complete detailed discussions on China’s 3-year short economic cycle, please refer to your reports titled ”A Definitive Guide to China’s Economic Cycles” and “A Definitive Guide to China’s Economic Cycles II – New High ” (20170828).