Jaya Josie: Public Infrastructure Investment--A BRICS Perspective for Inclusive Sustainable Development
2017-10-04 IMIMacro-Finance Salon Series International Monetary Institute (IMI),
Renmin University Beijing, 15 December 2015
Public Infrastructure Investment: A BRICS Perspective for Inclusive Sustainable Development
Jaya Josie, Head of BRICS Research Center, Human Sciences Research Council (HSRC), South Africa
Introduction The original aim of the paper on which this lecture is based was to discuss the role of public infrastructure investment for integrating Sustainable Development Goals (SDG) in the development programs of BRICS countries. From a micro-to-macro perspective is the provision of public infrastructure a key intermediate factor for ensuring that an individual’s living standard, capabilities and human, socio-economic and political rights are macro-economically sustainable in the long-term? The MDGs emphasised human capital, infrastructure, and socio-economic and political human rights as integral to increasing an individual’s living standards and human capabilities. The paper discussed a possible relationship between development finance and BRICS public infrastructure investment policy to address inclusive sustainable development and public infrastructure backlogs of deficits that militate against meeting SDG targets. The recent establishment of the BRICS New Development Bank and the accession of the RMB to international reserve currency status present China with an opportunity to bridge the long-term infrastructure investment financing gap faced by for developing countries for the provision of basic infrastructure services to address the SDG goals. The lecture first discusses the extent to which infrastructure investment may act as a catalyst for promoting SDGs. Secondly, I review of the current trends in infrastructure investment as they relate to gross fixed capital formation (GFCF) among BRICS countries. Thirdly, I consider a possible theoretical framework for public investment to address basic public infrastructure service backlogs targeting SDGs in BRICS countries. Finally, I discuss the possible role of a BRICS development finance institution in financing public infrastructure investment, and conclude with some specific proposals.- 1. Infrastructure Investment a Catalyst for Post-2015 Sustainable Development Goals
- Understanding Infrastructure investment trends: A long-term BRICS Perspective
 Where:
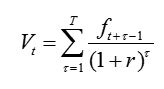
- Vt is the real value of an asset at the beginning of year t,
- f is the real rental in each period,
- T is the service life of the asset in years,
- τ takes values of 1, 2, 3…. T, and
- r is the discount rate used to reduce the future flow of rentals to their present values.
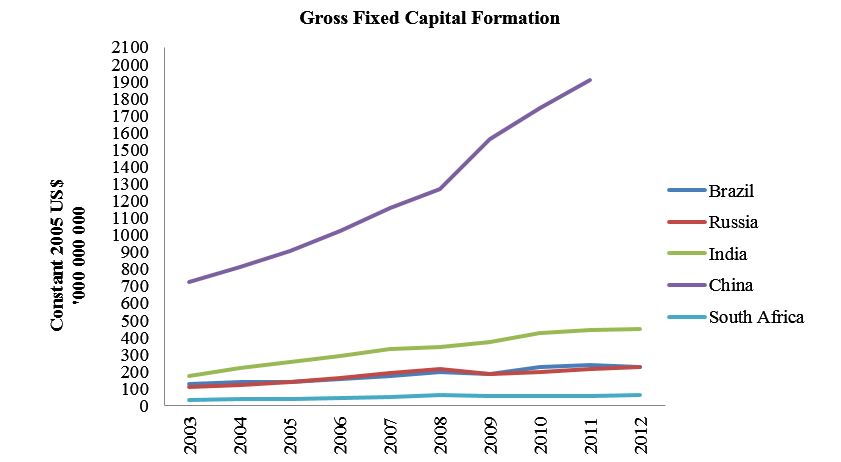
| 2003 | 2004 | 2005 | 2006 | 2007 | 2008 | 2009 | 2010 | 2011 | 2012 | |
| Brazil | 124.35 | 135.69 | 140.61 | 154.35 | 175.73 | 199.58 | 186.16 | 225.87 | 236.52 | 227.04 |
| Russia | 108.93 | 122.65 | 135.65 | 160.07 | 193.68 | 214.21 | 183.37 | 194.13 | 213.96 | 226.80 |
| India | 175.65 | 217.77 | 253.04 | 288.00 | 334.67 | 346.40 | 372.96 | 425.15 | 443.79 | 451.44 |
| China | 721.63 | 809.57 | 905.91 | 1020.96 | 1158.79 | 1270.03 | 1560.87 | 1741.93 | 1907.41 | |
| South Africa | 33.11 | 37.37 | 41.48 | 46.51 | 53.01 | 60.05 | 57.34 | 56.17 | 58.70 |
62.03 |
 [1] Thus GDP is equal to the sum of consumption (C), GCF, government spending (G), exports (X), imports (Z) and can be written as GDP = C + GCF + G + X – Z.
[2] The SNA93 defines fixed assets as produced assets that are used repeatedly, or continuously in the production process for more than one year.
[1] Thus GDP is equal to the sum of consumption (C), GCF, government spending (G), exports (X), imports (Z) and can be written as GDP = C + GCF + G + X – Z.
[2] The SNA93 defines fixed assets as produced assets that are used repeatedly, or continuously in the production process for more than one year.
- Illustrative Framework: Public Infrastructure Investment to support Basic Public Services
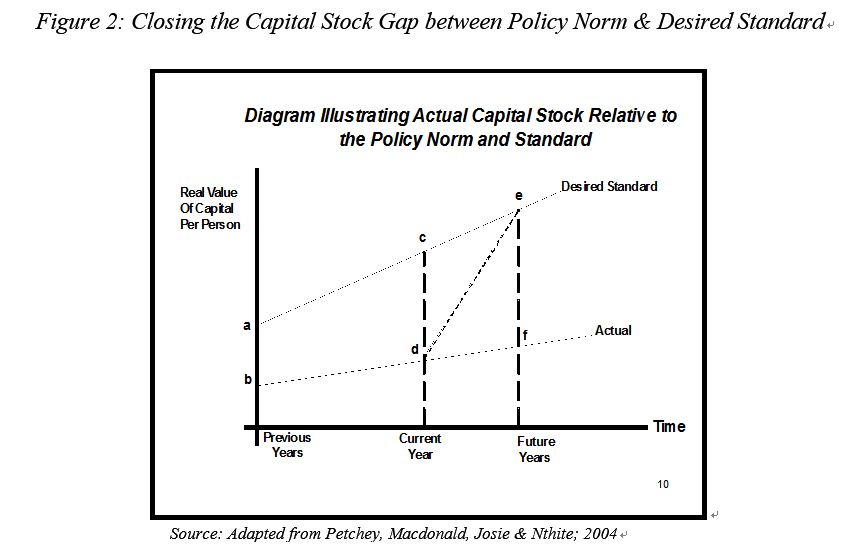 In Figure 2 the actual per person capital stock of a representative poor region for a particular service is plotted (point b) against the standard capital stock for the service across all regions and in which the standard capital stock is growing over time. In the diagramme, the actual capital stock is depicted below the standard. The region has a capital backlog equal to the distance in ab. In a current period, this would have grown to equal the distance cd because investment is insufficient to reduce the backlog of the preceding period. In addition because of low investment over time the backlog has increased further to equal the distance ef. The key question is how to raise the level of net investment so that its actual capital stock for the service equals the desired standard at some future period? Line de represents the development trajectory for closing the investment gap, and is arbitrary in the illustration. Of course there can be several possibile trajectories depending on how quickly or gradually the investment gap can be closed, and therefore the pace and amount of investment will define the shape of line de.
- The BRICS New Development Bank & Public Infrastructure Investment
| 2008 | 2009 | 2010 | 2011 | 2012e* | 2013f* | 2014f* | 2015f* | 2016f* | 2017f* | 2018f* | 2019f* | 2020f* | 2021f* | 2022f* | |
| Brazil | 19 | 16.9 | 18.4 | 19.3 | 18.9 | 19.6 | 20.2 | 20.8 | 21.2 | 21.5 | 21.7 | 21.9 | 22 | 22.1 | 22.2 |
| Russia | 23.8 | 22 | 21.9 | 20.9 | 21.8 | 22.3 | 23.4 | 24.3 | 25 | 25.2 | 25.6 | 25.9 | 26.2 | 26.5 | 26.8 |
| India | 33.9 | 33.5 | 32.6 | 32.9 | 31.3 | 31.5 | 32 | 32.5 | 33 | 33.1 | 33.2 | 33.4 | 33.4 | 33.3 | 33 |
| China | 40.7 | 45.3 | 47.9 | 46.2 | 44.8 | 43.5 | 42.8 | 42.2 | 41.4 | 40.7 | 40 | 39.3 | 38.7 | 38 | 37.4 |
| South Africa | 23 | 21.8 | 19.6 | 18.9 | 19.6 | 19.4 | 19.3 | 19.2 | 19.1 | 19 | 18.9 | 18.8 | 18.8 | 18.8 | 18.7 |
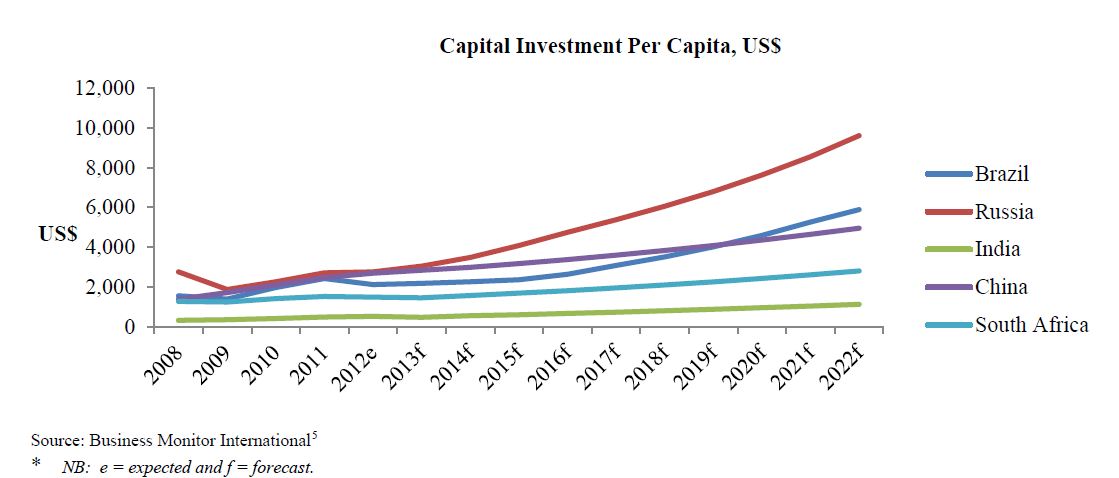
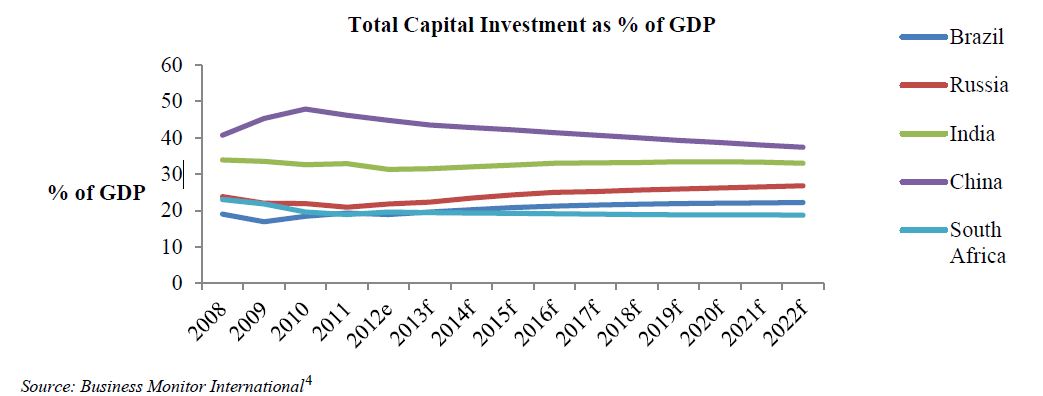 Beyond 2014, it was expected that all BRICS countries would have increased their per capita investment (See Table 3). Past trends show that between 2008 through to 2011 China increased its investment, and is expected to grow further until 2022. Brazil, Russia, and South Africa all decreased their investment from 2008 to 2009; however, South Africa is also expected to decrease its spending further from 2011 to 2013 where after all three are expected to show growth in investment. Out of all member countries India has the lowest per capita investment.
Table 3: Capital Investment Per Capita in US Dollars
Beyond 2014, it was expected that all BRICS countries would have increased their per capita investment (See Table 3). Past trends show that between 2008 through to 2011 China increased its investment, and is expected to grow further until 2022. Brazil, Russia, and South Africa all decreased their investment from 2008 to 2009; however, South Africa is also expected to decrease its spending further from 2011 to 2013 where after all three are expected to show growth in investment. Out of all member countries India has the lowest per capita investment.
Table 3: Capital Investment Per Capita in US Dollars
| 2008 | 2009 | 2010 | 2011 | 2012e* | 2013f* | 2014f* | 2015f* | 2016f* | 2017f* | 2018f* | 2019f* | 2020f* | 2021f* | 2022f* | |
| Brazil | 1 556.5 | 1 395.0 | 1 972.4 | 2 424.5 | 2 122.0 | 2 187.1 | 2 267.1 | 2 363.5 | 2 638.0 | 3 084.3 | 3 516.5 | 4 015.5 | 4 593.4 | 5 268.5 | 5 891.2 |
| Russia | 2 764.4 | 1 876.7 | 2 267.5 | 2 713.7 | 2 764.8 | 3 049.7 | 3 484.2 | 4 084.2 | 4 749.0 | 5 380.5 | 6 058.5 | 6 795.4 | 7 629.5 | 8 554.3 | 9 609.8 |
| India | 326.1 | 357.9 | 418.2 | 494.5 | 526.6 | 477.3 | 555.9 | 607.3 | 671.0 | 734.8 | 805.0 | 882.1 | 962.2 | 1 045.0 | 1 129.8 |
| China | 1 387.6 | 1 718.1 | 2 099.2 | 2 470.3 | 2 693.9 | 2 843.6 | 2 990.1 | 3 176.3 | 3 381.4 | 3 601.0 | 3 836.2 | 4 088.0 | 4 357.7 | 4 646.6 | 4 956.2 |
| South Africa | 1 276.3 | 1 245.8 | 1 418.1 | 1 527.7 | 1 494.5 | 1 458.4 | 1 571.8 | 1 690.2 | 1 817.4 | 1 954.2 | 2 101.3 | 2 259.5 | 2 429.4 | 2 612.0 | 2 808.2 |
 Conclusion and Recommendations
In conclusion the questions to ask is can BRICS initiated infrastructure investment be equitable across member states and associated regional economies? Secondly, how can public infrastructure investment contribute towards this sustainable economic development among BRICS member states and associated regional economies experiencing public infrastructure backlogs? Of course these questions raise the fundamental issue of the role and impact of public infrastructure investment in sustainable and inclusive economic development.
The lecture briefly reviewed and discussed some of the key concepts and issues that may mediate the role and impact of public infrastructure investment for sustainable and inclusive economic growth that can contribute towards attaining SDG targets for basic infrastructure. If BRICS member states want to be part of the SDG agenda member states should consider the following proposals: 1) The BRICS New Development Bank should include a programme for public infrastructure investment targeting the provision of basic services; 2) Give serious consideration to promoting and sharing research for disaggregating and recalibrating capital stock data to local levels to facilitate planning and targeting infrastructure investment; 3) Define an acceptable and consistent set of SDG indicators across BRICS that may be used to take account of socio-economic and spatial disparities that differentiate regions, sub-regions and communities from each other. The latter two will be important for making investment decisions in favour of meeting SDG targets.
References
Aschauer, D.A. 1989; Is Public Expenditure Productive, Journal of Monetary Economics, 23: 177-200, USA.
Business Monitor International (BMI) [Accessed 3 October 2013], Industry Reports,(2012) Brazil Infrastructure Report Q2 2012
http://search.proquest.com/abicomplete/docview/922724316/9992EF50B85B43CEPQ/2?accountid=27489; Industry Reports. (2013) Brazil Infrastructure Report Q4 2013 http://search.proquest.com/abicomplete/docview/1415869643/194E719497B74DEEPQ/1?accountid=27489 Industry Reports. (2012) Russia Infrastructure Report Q1 2012, http://search.proquest.com/abicomplete/docview/906034266/382DB34CD2AD4CE4PQ/1?accountid=27489
Industry Reports. (2013) Russia Infrastructure Report Q4 2013 http://search.proquest.com/abicomplete/docview/1426412663/C8C65A1ECA6E4CDDPQ/3?accountid=27489;
Industry Reports. (2012) India Infrastructure Report Q4 2012
http://web.a.ebscohost.com/ehost/pdfviewer/pdfviewer?sid=ba394c2c-10c7-4bab-b0e9-7248371f1a43%40sessionmgr4003&vid=2&hid=4107 ; Industry Reports. (2013) India Infrastructure Report Q4 2013
http://web.a.ebscohost.com/ehost/pdfviewer/pdfviewer?sid=257a8f1a-1ea8-4895-8885-4d5fa8d8c9f9%40sessionmgr4003&vid=2&hid=4107, Industry Reports. (2012) China Infrastructure Report Q1 2012 http://web.a.ebscohost.com/ehost/pdfviewer/pdfviewer?sid=a8d8365e-2424-475d-82c1-85778e2e1daa%40sessionmgr4003&vid=2&hid=4107 [Accessed 7 October 2013], Industry Reports. (2013) China Infrastructure Report Q4 2013, http://web.a.ebscohost.com/ehost/pdfviewer/pdfviewer?sid=810e511f-3f4d-4a8f-bcbd-15db223fc823%40sessionmgr4005&vid=2&hid=4107 [Accessed 7 October 2013], Industry Reports. (2012) South Africa Infrastructure Report
Q3 2012, http://search.proquest.com/abicomplete/docview/1024447451/9CFFD1F72D09408FPQ/1?accountid=27489 [Accessed 2 October 2013], Industry Reports. (2013) South Africa Infrastructure Report Q3 2013
http://search.proquest.com/abicomplete/docview/1024447451/9CFFD1F72D09408FPQ/1?accountid=27489 [Accessed 7 October 2013]
Hulten C. R. and Schwab R. M., 1993, Infrastructure Spending: Where do we go from Here? National Tax Journal, Vol. 46, no. 3, pp 261-73.
Josie, J., MacDonald, G. and Petchey, J., 2008; A Dynamic Equalization Model for social capital grants with a South African example, Journal of Development Studies, 2008, Vol. 44, No. 8, UK.
Levtchenkova, S. and Petchey, J. (2000); Regional Capital Stock Estimates for Australia, Australian Economic Review, Vol. 33, No. 2, Australia
Loewe, M.; 2012, Post 2015 – How to reconcile the Millennium Development Goals (MDGs) & the Sustainable Development Goals (SDGs)? German Development Institute (DIE), Briefing Paper 18/2012, Bonn, Germany.
Naqvi N., 2003, Is Public Capital more Productive than Private Capital? Macroeconomic Evidence from Pakistan, 1965-2000, Working Paper No. 03/03; University of Durham, UK.
Natrass, N., 2000, Macroeconomics – Theory and Policy in South Africa, 2nd Edition, David Phillip, Cape Town, South Africa.
Ndulu, Benno, 2006, Infrastructure, Regional Integration and Growth in Sub-Saharan Africa: Dealing with disadvantages of Geography and Sovereign Fragmentation, Journal of African Economics, 10 1093/jae/ej1033., Oxford University Press, UK.
Ndulu, B., Kritzinger-van Niekerk, L. and R. Ritva, Infrastructure, 2005, Regional Integration and Growth in Sub-Saharan Africa, From: Africa in the World Economy - The National, Regional and International Challenges Fondad, The Hague, www.fondad.org
Organization for Economic Cooperation and Development (OECD), 2001, Manual for Measuring Capital: Measurement of Capital Stocks, Consumption of Fixed Capital and Capital Services, OECD, Paris, France.
Petchey, J. D. and Levtchenkova, S. 2002, A Policy Model for Reducing Public Capital Backlogs in Transitional Economies with Regions: The Case of South Africa; School of Economics and Finance, Curtin University of Technology, Perth, Western Australia
MacDonald, G., Petchey, J. and Josie J., 2005, Allocating Spending on Public Infrastructure in Developing Economies with Regional Disparities, (Mimeograph), Occasional Paper, School of Economics, Curtin University of Technology, Perth, Australia
Petchey, J., Josie, J., MacDonald, G. and Nthite, R., 2004, Provincial Growth and Development Through The Equitable Sharing of Infrastructure Finance, paper prepared for the Conference, 10 Years of the FFC: Consolidation for Greater Equity, 10-12, August 2004, Cape Town International Convention Centre.
Romp, W. and de Haan, J. 2005, Public Capital and Economic Growth: A critical Survey, European InvestmentBank(EIB)Papers,Vol10No.1(http://www.eib.org/attachments/efs/eibpapers_2005_v10_no1_en.pdf)
Sachs, J., 2012, From Millennium Development Goals to Sustainable Development Goals, Lancet 2012; 379: 2206–11, Earth Institute, Columbia University, New York, NY, USA
Timmer M. P. and van Ark B., 2002, Capital Formation and Productivity Growth in South Korea and Taiwan: Beating Diminishing Returns through Realising the Catch-up Potential,. mimeograph, Groningen Growth and Development Centre, University of Groningen, Netherlands.
South African Reserve Bank, 2010, South Africa’s national accounts, 1946-2009, Supplement to the South African Reserve Bank Bulletin, March 2010, Pretoria.
UN Fact Sheet, Millennium Development Goals Report & Rio+20, UN Conference on Sustainable Development, Rio de Janeiro, 20-22 June 2010, http://www.un.org/millenniumgoals/poverty.shtml, (retrieved 26 Feb. 2014)
Vane, H. R. and Thompson, J. T., 1989, An Introduction to Macroeconomic Policy, 3rd Edition, Harvester Wheatsheaf, London, UK.
World Bank, 2013 http://data.worldbank.org/indicator/NE.GDI.FTOT.CD [Accessed 8 October 2013]
Conclusion and Recommendations
In conclusion the questions to ask is can BRICS initiated infrastructure investment be equitable across member states and associated regional economies? Secondly, how can public infrastructure investment contribute towards this sustainable economic development among BRICS member states and associated regional economies experiencing public infrastructure backlogs? Of course these questions raise the fundamental issue of the role and impact of public infrastructure investment in sustainable and inclusive economic development.
The lecture briefly reviewed and discussed some of the key concepts and issues that may mediate the role and impact of public infrastructure investment for sustainable and inclusive economic growth that can contribute towards attaining SDG targets for basic infrastructure. If BRICS member states want to be part of the SDG agenda member states should consider the following proposals: 1) The BRICS New Development Bank should include a programme for public infrastructure investment targeting the provision of basic services; 2) Give serious consideration to promoting and sharing research for disaggregating and recalibrating capital stock data to local levels to facilitate planning and targeting infrastructure investment; 3) Define an acceptable and consistent set of SDG indicators across BRICS that may be used to take account of socio-economic and spatial disparities that differentiate regions, sub-regions and communities from each other. The latter two will be important for making investment decisions in favour of meeting SDG targets.
References
Aschauer, D.A. 1989; Is Public Expenditure Productive, Journal of Monetary Economics, 23: 177-200, USA.
Business Monitor International (BMI) [Accessed 3 October 2013], Industry Reports,(2012) Brazil Infrastructure Report Q2 2012
http://search.proquest.com/abicomplete/docview/922724316/9992EF50B85B43CEPQ/2?accountid=27489; Industry Reports. (2013) Brazil Infrastructure Report Q4 2013 http://search.proquest.com/abicomplete/docview/1415869643/194E719497B74DEEPQ/1?accountid=27489 Industry Reports. (2012) Russia Infrastructure Report Q1 2012, http://search.proquest.com/abicomplete/docview/906034266/382DB34CD2AD4CE4PQ/1?accountid=27489
Industry Reports. (2013) Russia Infrastructure Report Q4 2013 http://search.proquest.com/abicomplete/docview/1426412663/C8C65A1ECA6E4CDDPQ/3?accountid=27489;
Industry Reports. (2012) India Infrastructure Report Q4 2012
http://web.a.ebscohost.com/ehost/pdfviewer/pdfviewer?sid=ba394c2c-10c7-4bab-b0e9-7248371f1a43%40sessionmgr4003&vid=2&hid=4107 ; Industry Reports. (2013) India Infrastructure Report Q4 2013
http://web.a.ebscohost.com/ehost/pdfviewer/pdfviewer?sid=257a8f1a-1ea8-4895-8885-4d5fa8d8c9f9%40sessionmgr4003&vid=2&hid=4107, Industry Reports. (2012) China Infrastructure Report Q1 2012 http://web.a.ebscohost.com/ehost/pdfviewer/pdfviewer?sid=a8d8365e-2424-475d-82c1-85778e2e1daa%40sessionmgr4003&vid=2&hid=4107 [Accessed 7 October 2013], Industry Reports. (2013) China Infrastructure Report Q4 2013, http://web.a.ebscohost.com/ehost/pdfviewer/pdfviewer?sid=810e511f-3f4d-4a8f-bcbd-15db223fc823%40sessionmgr4005&vid=2&hid=4107 [Accessed 7 October 2013], Industry Reports. (2012) South Africa Infrastructure Report
Q3 2012, http://search.proquest.com/abicomplete/docview/1024447451/9CFFD1F72D09408FPQ/1?accountid=27489 [Accessed 2 October 2013], Industry Reports. (2013) South Africa Infrastructure Report Q3 2013
http://search.proquest.com/abicomplete/docview/1024447451/9CFFD1F72D09408FPQ/1?accountid=27489 [Accessed 7 October 2013]
Hulten C. R. and Schwab R. M., 1993, Infrastructure Spending: Where do we go from Here? National Tax Journal, Vol. 46, no. 3, pp 261-73.
Josie, J., MacDonald, G. and Petchey, J., 2008; A Dynamic Equalization Model for social capital grants with a South African example, Journal of Development Studies, 2008, Vol. 44, No. 8, UK.
Levtchenkova, S. and Petchey, J. (2000); Regional Capital Stock Estimates for Australia, Australian Economic Review, Vol. 33, No. 2, Australia
Loewe, M.; 2012, Post 2015 – How to reconcile the Millennium Development Goals (MDGs) & the Sustainable Development Goals (SDGs)? German Development Institute (DIE), Briefing Paper 18/2012, Bonn, Germany.
Naqvi N., 2003, Is Public Capital more Productive than Private Capital? Macroeconomic Evidence from Pakistan, 1965-2000, Working Paper No. 03/03; University of Durham, UK.
Natrass, N., 2000, Macroeconomics – Theory and Policy in South Africa, 2nd Edition, David Phillip, Cape Town, South Africa.
Ndulu, Benno, 2006, Infrastructure, Regional Integration and Growth in Sub-Saharan Africa: Dealing with disadvantages of Geography and Sovereign Fragmentation, Journal of African Economics, 10 1093/jae/ej1033., Oxford University Press, UK.
Ndulu, B., Kritzinger-van Niekerk, L. and R. Ritva, Infrastructure, 2005, Regional Integration and Growth in Sub-Saharan Africa, From: Africa in the World Economy - The National, Regional and International Challenges Fondad, The Hague, www.fondad.org
Organization for Economic Cooperation and Development (OECD), 2001, Manual for Measuring Capital: Measurement of Capital Stocks, Consumption of Fixed Capital and Capital Services, OECD, Paris, France.
Petchey, J. D. and Levtchenkova, S. 2002, A Policy Model for Reducing Public Capital Backlogs in Transitional Economies with Regions: The Case of South Africa; School of Economics and Finance, Curtin University of Technology, Perth, Western Australia
MacDonald, G., Petchey, J. and Josie J., 2005, Allocating Spending on Public Infrastructure in Developing Economies with Regional Disparities, (Mimeograph), Occasional Paper, School of Economics, Curtin University of Technology, Perth, Australia
Petchey, J., Josie, J., MacDonald, G. and Nthite, R., 2004, Provincial Growth and Development Through The Equitable Sharing of Infrastructure Finance, paper prepared for the Conference, 10 Years of the FFC: Consolidation for Greater Equity, 10-12, August 2004, Cape Town International Convention Centre.
Romp, W. and de Haan, J. 2005, Public Capital and Economic Growth: A critical Survey, European InvestmentBank(EIB)Papers,Vol10No.1(http://www.eib.org/attachments/efs/eibpapers_2005_v10_no1_en.pdf)
Sachs, J., 2012, From Millennium Development Goals to Sustainable Development Goals, Lancet 2012; 379: 2206–11, Earth Institute, Columbia University, New York, NY, USA
Timmer M. P. and van Ark B., 2002, Capital Formation and Productivity Growth in South Korea and Taiwan: Beating Diminishing Returns through Realising the Catch-up Potential,. mimeograph, Groningen Growth and Development Centre, University of Groningen, Netherlands.
South African Reserve Bank, 2010, South Africa’s national accounts, 1946-2009, Supplement to the South African Reserve Bank Bulletin, March 2010, Pretoria.
UN Fact Sheet, Millennium Development Goals Report & Rio+20, UN Conference on Sustainable Development, Rio de Janeiro, 20-22 June 2010, http://www.un.org/millenniumgoals/poverty.shtml, (retrieved 26 Feb. 2014)
Vane, H. R. and Thompson, J. T., 1989, An Introduction to Macroeconomic Policy, 3rd Edition, Harvester Wheatsheaf, London, UK.
World Bank, 2013 http://data.worldbank.org/indicator/NE.GDI.FTOT.CD [Accessed 8 October 2013]
