Betty Huang and Xia Le: ODI From the Middle Kingdom--What's Next After the Big Turnaround?
2018-03-05 IMI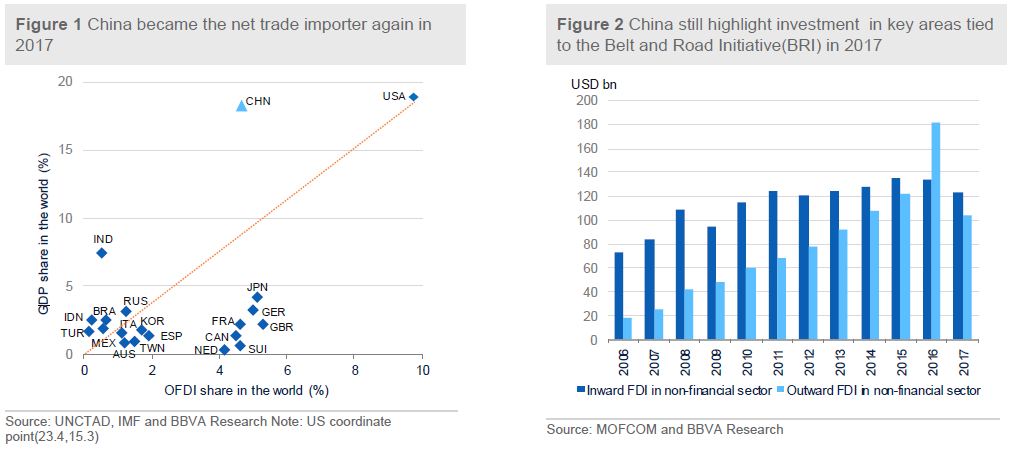 However, the upswing of China’s ODI suddenly came to a halt in 2017 as the non-financial ODI dropped by 33.7% to USD 120.1 billion. The slump was due to the authorities’ restrictive measures to curb ODI as the fast rise in capital outflows, including ODI, posed a threat to the country’s financial stability in the aftermath of the RMB’s unexpected devaluation in August 2015.
Since November 2016, China has been increasing its scrutiny of outbound direct investment to avoid capital outflow. Consistent with that trend, the National Development and Reform Commission along with other four agencies formalized the regulatory pathway for ODI transaction approval on August 18, 2017, by issuing the Opinions on Further Guiding and Regulating Outbound Investment (the Guiding Opinions). The Guiding Opinions classify outbound investment into three groups: encouraged, restricted, and prohibited transactions.
However, the upswing of China’s ODI suddenly came to a halt in 2017 as the non-financial ODI dropped by 33.7% to USD 120.1 billion. The slump was due to the authorities’ restrictive measures to curb ODI as the fast rise in capital outflows, including ODI, posed a threat to the country’s financial stability in the aftermath of the RMB’s unexpected devaluation in August 2015.
Since November 2016, China has been increasing its scrutiny of outbound direct investment to avoid capital outflow. Consistent with that trend, the National Development and Reform Commission along with other four agencies formalized the regulatory pathway for ODI transaction approval on August 18, 2017, by issuing the Opinions on Further Guiding and Regulating Outbound Investment (the Guiding Opinions). The Guiding Opinions classify outbound investment into three groups: encouraged, restricted, and prohibited transactions.
- Encouraged transactions: China will promote ODI transactions that are strategically important to China’s growth and development e.g. Infrastructure projects that are tied of the Belt and Road Initiatives, high-tech businesses, advanced manufacturing enterprises, overseas research and development (R&D), agriculture, energy resources and services sectors e.g. commerce, culture and logistics.
- Restricted: China will discourage outbound direct investments that go against the countries’ national interests or are prone to “irrational” risk-taking. Several industries are restricted following the Guiding Opinions, including real estate, sports clubs, hotels, entertainment and the film industry.
- Prohibited transactions: ODI transactions that may endanger the national interests or security of China are subject to strict management and control. ODI to Gambling or sex industries are prohibited.
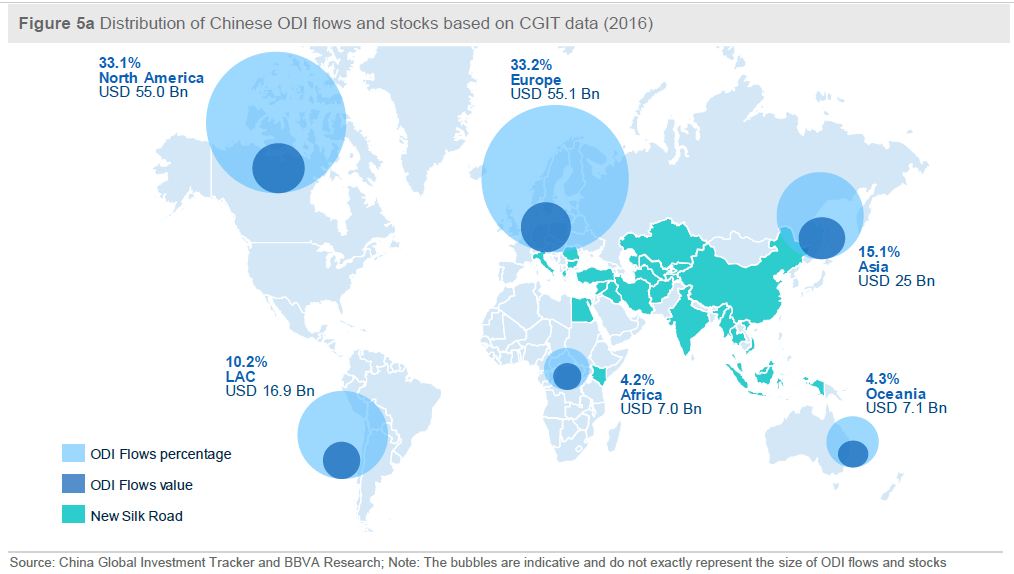
 Therefore, we use a more detailed database by CGTI which includes all verified investment and construction transactions worth USD 100 million or more to detect where ODI goes. The CGTI data features more than 1,300 investment deals worth more than USD 1 trillion in total. Such a deal-based database enables us to better track China's ODI flows and stocks in different final destinations (Figure 5).
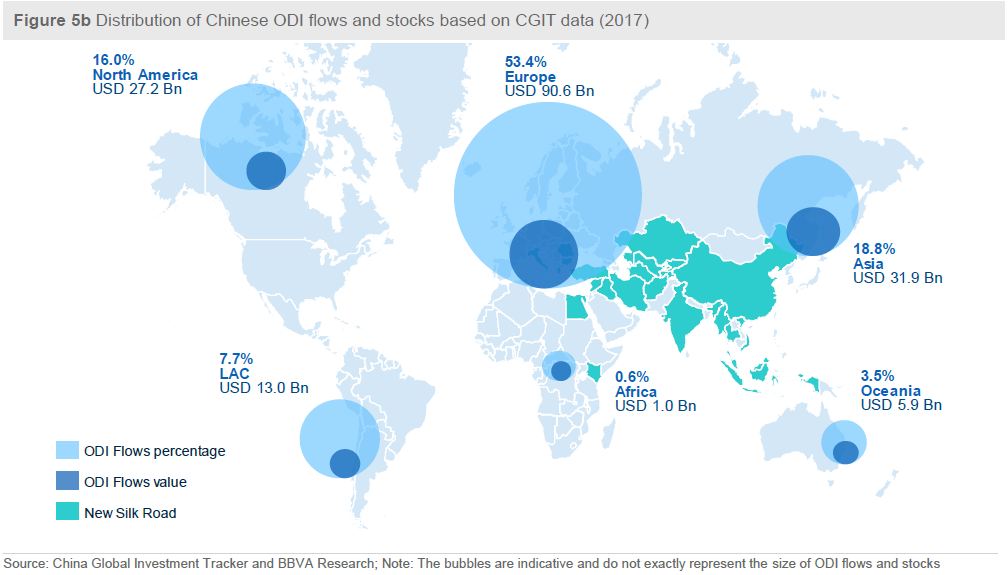 Europe continued to be the largest recipient of Chinese ODI in the period of 2016-2017. The share of Chinese investment flowing to the continent increased sharply from 18% in 2013 to 53.4% in 2017. In particular, the sharpest increase is recorded in the Switzerland (USD 45.4 billion), as ChemChina bought Syngenta-a Swiss seed and chemical company in June 2017 and to date is the biggest overseas deal involving a Chinese company. The ODI in UK surged to USD 19 billion in 2017 compared with approximately USD 11 billion in 2016, reflecting a more optimistic expectation for its economic recovery despite the country’s decision to exit the EU. Russia also received more investment from China in 2017 of USD 10 billion compared with merely 2 billion in 2016, with its economic prospects having improved owing to higher commodity prices. However, the ODI in France, Germany and Italy experienced a slump due to their effort to screen foreign investments in order to avoid hostile takeovers.
Asia ranked the second largest recipient of Chinese ODI investment in terms of ODI flows. Singapore ranked the first of the China’s ODI flow received in 2017 among Asia countries, which amounted to USD 13 billion, due to its superior business environment, access to South-east Asian markets, and close links with China. Despite tense political relations with China, the ODI flow to India increased quickly to USD 3.1 billion in 2017 from just below 1 billion in 2016, reflecting the country’s growth prospects are the brightest across major economies. Japan also received a higher ODI of approximately USD 3 billion in 2017 compared with merely USD 0.7 billion in 2016. Benefited from Belt and Road Initiatives (BRI), ODI flows to some BRI countries increased e.g. Malaysia, Thailand, Iran, Pakistan and Sri Lanka, as these countries have emerged as key nodes on the BRI and keep a welcoming attitude towards Chinese investment.
North America also saw an increase in its share of ODI, with the United States accounting for over 75% of flows and stocks in North America. However, the FDI flow to US slipped 54.7% to $23.7bn in 2017 from 2016, mainly due to the rising protectionism of the US administration, as well as China’s restrictive measures of overseas investments in certain industries. Nevertheless, the US remains a very attractive destination for Chinese ODI, both in terms of M&A targets and market opportunities. Once keep a close relationship with PRC companies in receive ODI, Canada has been largely ignored since 2013 and only receive USD 3.4 billion ODI in 2017 compared with USD 21.6 billion in 2012.
Latin America saw a decline in Chinese ODI flow. Chinese foreign direct investments (FDI) in Latin America, aren’t uniform and are still relatively muted. Brazil is the largest recipient of investment from China across LATAM with aggregate USD 8.9 billion in announced investments in 2017, followed by Peru (USD 2.9 billion), Argentina (USD 1.1 billion),and Mexico (USD 0.1 billion).
Chinese investment in Oceania also experienced a drop in 2017. However, given a relatively smaller size of the economy and population, Chinese investment in Australia (USD 5 billion) is still impressive in 2017, driven by coal and agriculture sectors.
Commodity sector continue to outpace other sectors
The composition of ODI flow has also changed. Since August 2017 there have been no recorded Chinese acquisitions in property, sport and entertainment – the areas specifically targeted by the authorities. As the share of ODI in the service sector declined, the shares of ODI in commodity and energy sectors started to rise (Figure 6). In particular, investment in commodity and energy sectors accounted for 49.4% of total ODI flow in 2017, way above 29% in 2016. Meanwhile, the share of investment in the manufacturing, wholesale and retail, and information technology sectors declined slightly.
Europe continued to be the largest recipient of Chinese ODI in the period of 2016-2017. The share of Chinese investment flowing to the continent increased sharply from 18% in 2013 to 53.4% in 2017. In particular, the sharpest increase is recorded in the Switzerland (USD 45.4 billion), as ChemChina bought Syngenta-a Swiss seed and chemical company in June 2017 and to date is the biggest overseas deal involving a Chinese company. The ODI in UK surged to USD 19 billion in 2017 compared with approximately USD 11 billion in 2016, reflecting a more optimistic expectation for its economic recovery despite the country’s decision to exit the EU. Russia also received more investment from China in 2017 of USD 10 billion compared with merely 2 billion in 2016, with its economic prospects having improved owing to higher commodity prices. However, the ODI in France, Germany and Italy experienced a slump due to their effort to screen foreign investments in order to avoid hostile takeovers.
Asia ranked the second largest recipient of Chinese ODI investment in terms of ODI flows. Singapore ranked the first of the China’s ODI flow received in 2017 among Asia countries, which amounted to USD 13 billion, due to its superior business environment, access to South-east Asian markets, and close links with China. Despite tense political relations with China, the ODI flow to India increased quickly to USD 3.1 billion in 2017 from just below 1 billion in 2016, reflecting the country’s growth prospects are the brightest across major economies. Japan also received a higher ODI of approximately USD 3 billion in 2017 compared with merely USD 0.7 billion in 2016. Benefited from Belt and Road Initiatives (BRI), ODI flows to some BRI countries increased e.g. Malaysia, Thailand, Iran, Pakistan and Sri Lanka, as these countries have emerged as key nodes on the BRI and keep a welcoming attitude towards Chinese investment.
North America also saw an increase in its share of ODI, with the United States accounting for over 75% of flows and stocks in North America. However, the FDI flow to US slipped 54.7% to $23.7bn in 2017 from 2016, mainly due to the rising protectionism of the US administration, as well as China’s restrictive measures of overseas investments in certain industries. Nevertheless, the US remains a very attractive destination for Chinese ODI, both in terms of M&A targets and market opportunities. Once keep a close relationship with PRC companies in receive ODI, Canada has been largely ignored since 2013 and only receive USD 3.4 billion ODI in 2017 compared with USD 21.6 billion in 2012.
Latin America saw a decline in Chinese ODI flow. Chinese foreign direct investments (FDI) in Latin America, aren’t uniform and are still relatively muted. Brazil is the largest recipient of investment from China across LATAM with aggregate USD 8.9 billion in announced investments in 2017, followed by Peru (USD 2.9 billion), Argentina (USD 1.1 billion),and Mexico (USD 0.1 billion).
Chinese investment in Oceania also experienced a drop in 2017. However, given a relatively smaller size of the economy and population, Chinese investment in Australia (USD 5 billion) is still impressive in 2017, driven by coal and agriculture sectors.
Commodity sector continue to outpace other sectors
The composition of ODI flow has also changed. Since August 2017 there have been no recorded Chinese acquisitions in property, sport and entertainment – the areas specifically targeted by the authorities. As the share of ODI in the service sector declined, the shares of ODI in commodity and energy sectors started to rise (Figure 6). In particular, investment in commodity and energy sectors accounted for 49.4% of total ODI flow in 2017, way above 29% in 2016. Meanwhile, the share of investment in the manufacturing, wholesale and retail, and information technology sectors declined slightly.
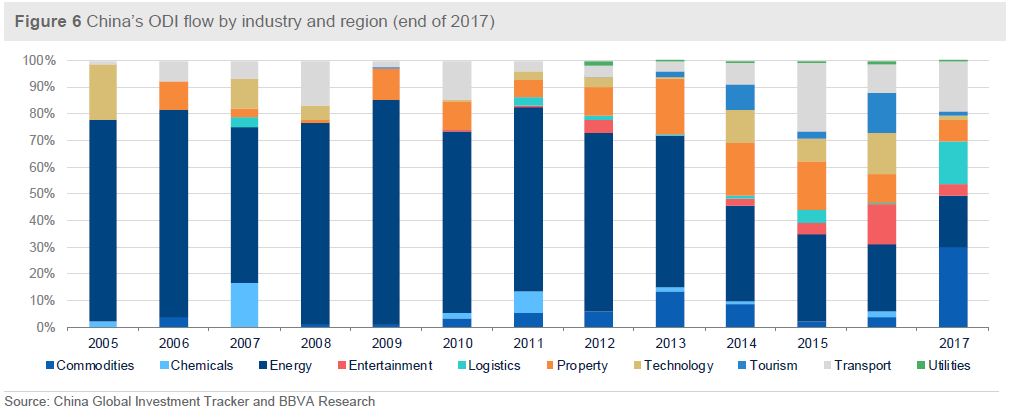 Agriculture accounted for 29% of the total ODI flow in 2017 compared with merely 3% in 2016. In 2017,10.4% of ODI was invested in green field, reflecting that corporates in China pursue better food quality imports, and the usage of green materials. ODI to transport and logistics sectors also rallied (19% of total ODI flow), benefiting from the Belt and Road Initiatives (BRI).
Europe accounted for the lion share of total ODI flow in the commodity sector (USD 75.5 billion), led by large-scale investments in agriculture (Switzerland), oil and gas (Russian) and alternative (Greece and UK). Latin America came in second, led by investments in agriculture (Brazil) and hydro (Brazil and Peru).
SOEs outperformed POEs
In 2017, investment shifted toward state-owned enterprises (SOEs), underpinned by large acquisitions. The private Chinese companies are still subject to the authorities’ higher scrutiny as China’s government clamped down illegal capital outflows. The restrictive measures adopted in August 2017 are mainly targeted at private enterprises, which required private firms to report their overseas investment plans to the government and seek approval if their investment involves sensitive countries or industries.
In contrast, the SOEs’ are expected to outperform their private peers as many of their overseas investment projects are tied to the government’s favoured BRI strategy. Moreover, their dominance in international construction projects can give them more opportunities and experiences to make investment related to construction projects. However, the ODI of Chinese SOEs could be substantially aided by concessionary financing from state-controlled banks, which has increasingly caused foreign concerns over the fairness of the playing field.
New tailwinds and headwinds to China’s ODI
A number of tailwinds and headwinds have emerged and are expected to shape the pattern of China’s ODI going forward.
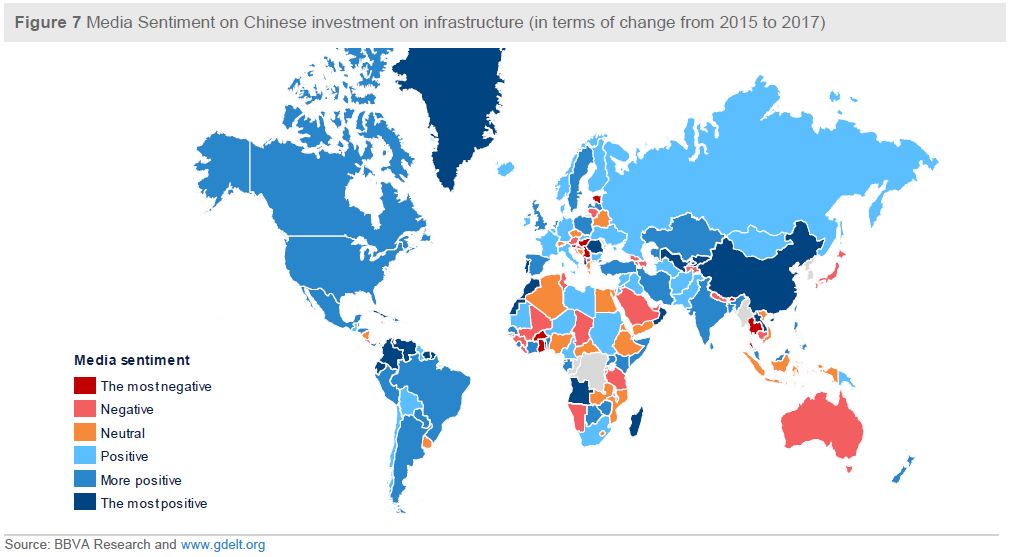
Encouragingly, many foreign countries’ views toward China’s investment have somewhat improved over the past two years despite the rise in the populism around the globe. Using Big Data and information from the media (GDELT), we measure the media coverage and sentiment on news related to the BRI initiative. Reassuringly, we find that the evolution of media sentiment of Chinese investment in infrastructure has improved in most countries in 2017 compared to 2015 (Figure 7).
Agriculture accounted for 29% of the total ODI flow in 2017 compared with merely 3% in 2016. In 2017,10.4% of ODI was invested in green field, reflecting that corporates in China pursue better food quality imports, and the usage of green materials. ODI to transport and logistics sectors also rallied (19% of total ODI flow), benefiting from the Belt and Road Initiatives (BRI).
Europe accounted for the lion share of total ODI flow in the commodity sector (USD 75.5 billion), led by large-scale investments in agriculture (Switzerland), oil and gas (Russian) and alternative (Greece and UK). Latin America came in second, led by investments in agriculture (Brazil) and hydro (Brazil and Peru).
SOEs outperformed POEs
In 2017, investment shifted toward state-owned enterprises (SOEs), underpinned by large acquisitions. The private Chinese companies are still subject to the authorities’ higher scrutiny as China’s government clamped down illegal capital outflows. The restrictive measures adopted in August 2017 are mainly targeted at private enterprises, which required private firms to report their overseas investment plans to the government and seek approval if their investment involves sensitive countries or industries.
In contrast, the SOEs’ are expected to outperform their private peers as many of their overseas investment projects are tied to the government’s favoured BRI strategy. Moreover, their dominance in international construction projects can give them more opportunities and experiences to make investment related to construction projects. However, the ODI of Chinese SOEs could be substantially aided by concessionary financing from state-controlled banks, which has increasingly caused foreign concerns over the fairness of the playing field.
New tailwinds and headwinds to China’s ODI
A number of tailwinds and headwinds have emerged and are expected to shape the pattern of China’s ODI going forward.
Encouragingly, many foreign countries’ views toward China’s investment have somewhat improved over the past two years despite the rise in the populism around the globe. Using Big Data and information from the media (GDELT), we measure the media coverage and sentiment on news related to the BRI initiative. Reassuringly, we find that the evolution of media sentiment of Chinese investment in infrastructure has improved in most countries in 2017 compared to 2015 (Figure 7).
 Adding to the tailwinds of China’s ODI are some government-led initiatives. Under the Belt and Road Initiatives (BRI), China created a USD 40 billion Silk Road Fund to boost infrastructure investments. Additionally, Beijing spearheaded the creation of a USD 50 billion Asian Infrastructure Investment Bank (AIIB), a USD 50 billion BRICS New Development Bank (NDB). China has also set up two ear-marked funds for its cooperation with Latin America in 2015 - China LAC Industrial Cooperation Investment Fund and the China-Latin America Infrastructure Fund. ODI flows to these regions will be greatly aided by improved economic integration and financing for infrastructure investments. Latin America is another region that is bound to receive more ODI on the back on new bilateral lending and investment deals.
However, headwinds to China’s ODI exist not only at home but also abroad. Anti-globalization movements have intensified in recent years and the international environment has become increasingly uncertain and unstable. The US has expressed increasing concern about Chinese attempts to acquire technology. The EU has unveiled proposals of a new framework to screen foreign investments to avoid hostile takeovers in some sensitive sectors; this idea was pushed by France and supported by Germany and Italy. More recently, Australia is to tighten rules on foreign investment in electricity infrastructure and agricultural land, amid concerns about growing Chinese influence in business, politics and society.
What trends will define Chinese ODI looking forward?
Despite the uncertain global political and economic environment, outbound investment by Chinese firms is likely to rise over the long term, with the authorities’ effort to boost Belt and Road Initiatives and support of overseas acquisitions that allow Chinese firms to acquire advanced technology and strategic assets. Continued growing investment and trade links between China and BRI countries are expected amid connectivity improvement in the next few years. China’s various industrial sectors will benefit via government-backed entities and to a lesser degree, multilateral entities. These government-led initiatives will help to improve economic integration and expand the market for Chinese goods and services overseas, all of which will open opportunities for Chinese companies abroad.
Supported by China’s discount financing, immediate beneficiaries will be seen in the engineering & construction, survey & design, railway signalling systems and rolling stock, as well as in the steel machinery and aerospace and defence exports. Over time we expect operator of ports and railways and other infrastructure, to gain from higher volumes initiated by increased bilateral trade between China and BRI countries. Moreover, mining, transportation infrastructure, manufacturing and information transmission sectors will also be benefited.
The industry growth driver for China’s ODI will move from the property market, hotels, and entertainment to the infrastructure sector. SOEs will still dominate China’s ODI. Government support for initiatives such as BRI and AIIB would not only fuel China’s infrastructure-related sectors but also boost bilateral trade over the medium term with upgraded interconnectivity. These initiatives may also promote increased RMB usage in funding for infrastructure projects and trade deals.
Adding to the tailwinds of China’s ODI are some government-led initiatives. Under the Belt and Road Initiatives (BRI), China created a USD 40 billion Silk Road Fund to boost infrastructure investments. Additionally, Beijing spearheaded the creation of a USD 50 billion Asian Infrastructure Investment Bank (AIIB), a USD 50 billion BRICS New Development Bank (NDB). China has also set up two ear-marked funds for its cooperation with Latin America in 2015 - China LAC Industrial Cooperation Investment Fund and the China-Latin America Infrastructure Fund. ODI flows to these regions will be greatly aided by improved economic integration and financing for infrastructure investments. Latin America is another region that is bound to receive more ODI on the back on new bilateral lending and investment deals.
However, headwinds to China’s ODI exist not only at home but also abroad. Anti-globalization movements have intensified in recent years and the international environment has become increasingly uncertain and unstable. The US has expressed increasing concern about Chinese attempts to acquire technology. The EU has unveiled proposals of a new framework to screen foreign investments to avoid hostile takeovers in some sensitive sectors; this idea was pushed by France and supported by Germany and Italy. More recently, Australia is to tighten rules on foreign investment in electricity infrastructure and agricultural land, amid concerns about growing Chinese influence in business, politics and society.
What trends will define Chinese ODI looking forward?
Despite the uncertain global political and economic environment, outbound investment by Chinese firms is likely to rise over the long term, with the authorities’ effort to boost Belt and Road Initiatives and support of overseas acquisitions that allow Chinese firms to acquire advanced technology and strategic assets. Continued growing investment and trade links between China and BRI countries are expected amid connectivity improvement in the next few years. China’s various industrial sectors will benefit via government-backed entities and to a lesser degree, multilateral entities. These government-led initiatives will help to improve economic integration and expand the market for Chinese goods and services overseas, all of which will open opportunities for Chinese companies abroad.
Supported by China’s discount financing, immediate beneficiaries will be seen in the engineering & construction, survey & design, railway signalling systems and rolling stock, as well as in the steel machinery and aerospace and defence exports. Over time we expect operator of ports and railways and other infrastructure, to gain from higher volumes initiated by increased bilateral trade between China and BRI countries. Moreover, mining, transportation infrastructure, manufacturing and information transmission sectors will also be benefited.
The industry growth driver for China’s ODI will move from the property market, hotels, and entertainment to the infrastructure sector. SOEs will still dominate China’s ODI. Government support for initiatives such as BRI and AIIB would not only fuel China’s infrastructure-related sectors but also boost bilateral trade over the medium term with upgraded interconnectivity. These initiatives may also promote increased RMB usage in funding for infrastructure projects and trade deals.
