Hong Hao: A Definitive Guide to China's Economic Cycle Part II – New High
2017-09-18 IMI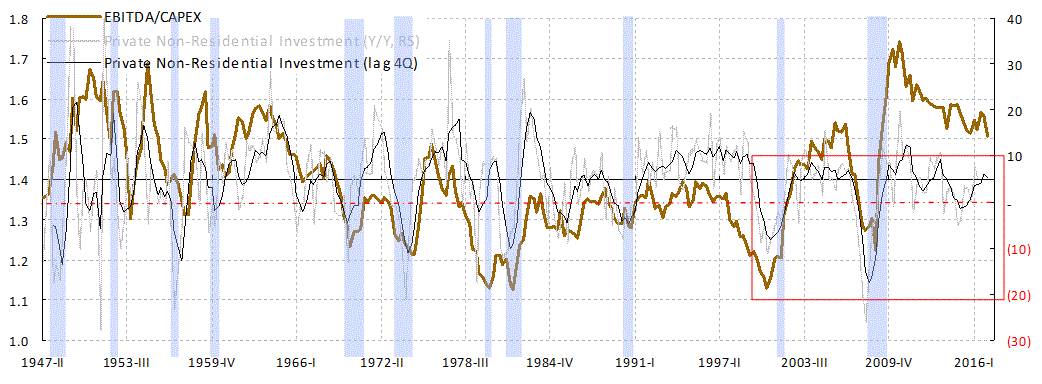
 We believe a cycle means sustained and simultaneous upward or downward movements across key economic variables. The trend has to be pronounced, pervasive and persistent. Wesley Mitchell, an Economic Cycle guru, outlined the classic definition of business cycles as “fluctuation in aggregate economic activities”. A cycle must “consist of simultaneous expansion in many economic activities followed by similarly general recessions, (must be) recurrent … and not divisible into shorter cycles of similar magnitude and character”.
Once we extend the chart backward beyond 2000, the quasi-Juglar cycle starts to fade into the more frequent fluctuations in the US investment growth since 1947 (i.e. not recurrent). Our data show that the inception of a new investment cycle tends to begin with a substantially more negative growth rate (i.e. the cycle observed since 2000 is divisible into shorter cycles of similar magnitude and character). In short, the chart does not fit the classic definition of cycles. Indeed, the previous two bottoms of investment growth are concurrent with the US recession in 2002 and 2009. A new cycle will likely initiate with investment growth rate once again falls to its recession level.
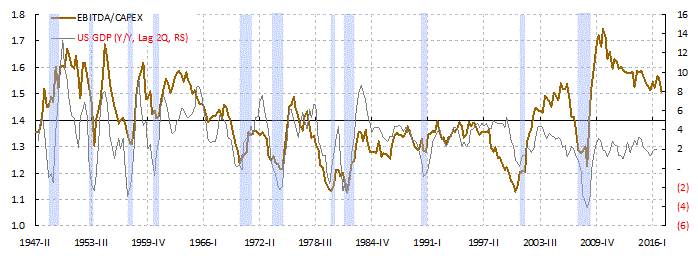
Instead, we calculate the history of US Return on Investment (RoI) by comparing the aggregated EBITDA and Capex of US firms since 1947. We show that this measure consistently leads the US private non-residential investment by two to four quarters, and the US GDP growth by two quarters (Focus Chart 1, top and mid panels). The reason is intuitive – when investment generates good return, it attracts more investment. And vice versa.
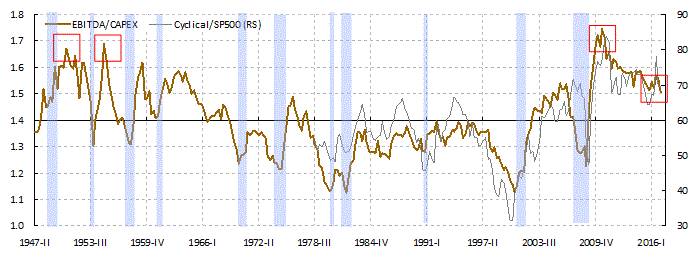
The US investment return has been declining since 2012. It explains why US firms deploy its capital to buy back stocks, instead of reinvesting in Capex. It also explains the volatility and the bear market in commodities since 2012 (Focus Chart 1, lower panel). Indeed, this persistent decline in US RoI was the basis of our call for a severe commodity bear market back in 2013 (“Black Horse and Black Swan”, 20131207). Subsequently, oil plunged from USD100+ to USD28, iron from USD 140 to USD40 and rebar steel from RMB 3,600 to RMB1,800, before their recovery in late 2015.
The Twelve-Year Cycle
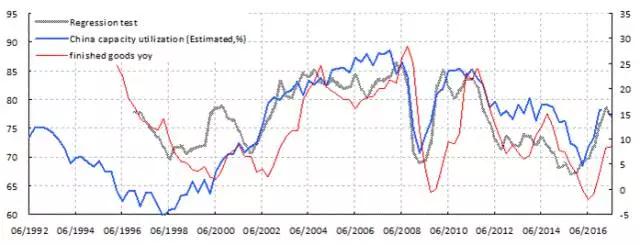
Another client approached us, with a chart showing that the growth rate of China’s industrial finished goods inventory bottomed in 2016 and started to rise. The low points of the growth rate are consistent with the levels seen in 3Q2009 and 4Q2002 – previous cyclical bottoms. Visually, the bottom in 2016 appears to be a significant low (Focus Chart 2, top panel). Thus, my client posited that the momentum of inventory restocking will likely continue.
Focus Chart 2: The 3-year property inventory cycle lags M1, coincides with rebar price and leads finished goods inventory.
We believe a cycle means sustained and simultaneous upward or downward movements across key economic variables. The trend has to be pronounced, pervasive and persistent. Wesley Mitchell, an Economic Cycle guru, outlined the classic definition of business cycles as “fluctuation in aggregate economic activities”. A cycle must “consist of simultaneous expansion in many economic activities followed by similarly general recessions, (must be) recurrent … and not divisible into shorter cycles of similar magnitude and character”.
Once we extend the chart backward beyond 2000, the quasi-Juglar cycle starts to fade into the more frequent fluctuations in the US investment growth since 1947 (i.e. not recurrent). Our data show that the inception of a new investment cycle tends to begin with a substantially more negative growth rate (i.e. the cycle observed since 2000 is divisible into shorter cycles of similar magnitude and character). In short, the chart does not fit the classic definition of cycles. Indeed, the previous two bottoms of investment growth are concurrent with the US recession in 2002 and 2009. A new cycle will likely initiate with investment growth rate once again falls to its recession level.
Instead, we calculate the history of US Return on Investment (RoI) by comparing the aggregated EBITDA and Capex of US firms since 1947. We show that this measure consistently leads the US private non-residential investment by two to four quarters, and the US GDP growth by two quarters (Focus Chart 1, top and mid panels). The reason is intuitive – when investment generates good return, it attracts more investment. And vice versa.
The US investment return has been declining since 2012. It explains why US firms deploy its capital to buy back stocks, instead of reinvesting in Capex. It also explains the volatility and the bear market in commodities since 2012 (Focus Chart 1, lower panel). Indeed, this persistent decline in US RoI was the basis of our call for a severe commodity bear market back in 2013 (“Black Horse and Black Swan”, 20131207). Subsequently, oil plunged from USD100+ to USD28, iron from USD 140 to USD40 and rebar steel from RMB 3,600 to RMB1,800, before their recovery in late 2015.
The Twelve-Year Cycle
Another client approached us, with a chart showing that the growth rate of China’s industrial finished goods inventory bottomed in 2016 and started to rise. The low points of the growth rate are consistent with the levels seen in 3Q2009 and 4Q2002 – previous cyclical bottoms. Visually, the bottom in 2016 appears to be a significant low (Focus Chart 2, top panel). Thus, my client posited that the momentum of inventory restocking will likely continue.
Focus Chart 2: The 3-year property inventory cycle lags M1, coincides with rebar price and leads finished goods inventory.
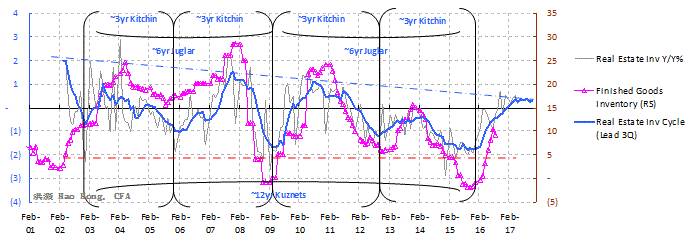
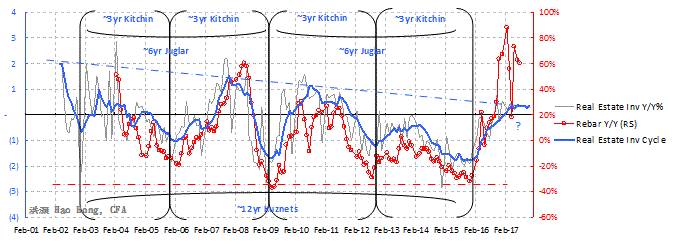
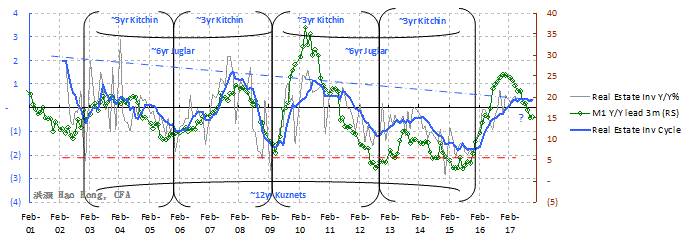 In the first part of “A Definitive Guide to China’s Economic Cycle”, we discussed China’s three-year property inventory investment cycle with supporting data and charts. Our quantitative model shows that the growth rate of China’s property investment, once filtered out the noises from higher-frequency observations, demonstrates a persistent three-year cycle. This cycle is similar in length as the three-year Kitchin Inventory Cycle. Two inventory cycles make a six-year Juglar Investment Cycle. And two Juglar Cycle equates one twelve-year Kuznets Building Cycle. We then applied this 3-year Kitchin Inventory Cycle to explain the cycles in China’s other key economic variables, such as money supply, stock market, rebar steel, inflation and bond yield.
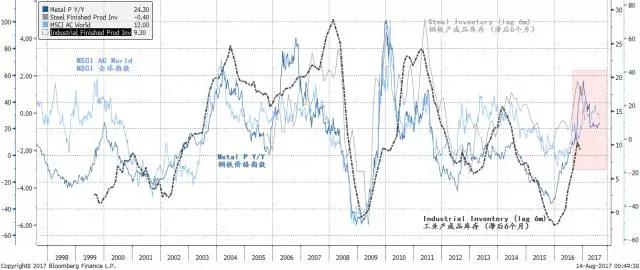
We note that the three-year property inventory cycle is peaking, or has peaked in 2Q. Already, July’s economic data have begun to disappoint. The property inventory cycle leads the cycle of industrial finished goods by around six months (Focus Chart 2, top panel). The cycle in China’s capacity utilization demonstrates a similar lead time, too (Focus Chart 3). Importantly, M1 narrow money supply growth and stock prices in turn lead the property inventory cycle by more than three months (Focus Chart 2, bottom panel).While restocking activities could extend a little further, it is already in the price (Focus Chart 4). And the momentum of restocking will wane soon, if history is a guide.
Focus Chart 3: Capacity utilization leads finished goods inventory by more than 6 months.
In the first part of “A Definitive Guide to China’s Economic Cycle”, we discussed China’s three-year property inventory investment cycle with supporting data and charts. Our quantitative model shows that the growth rate of China’s property investment, once filtered out the noises from higher-frequency observations, demonstrates a persistent three-year cycle. This cycle is similar in length as the three-year Kitchin Inventory Cycle. Two inventory cycles make a six-year Juglar Investment Cycle. And two Juglar Cycle equates one twelve-year Kuznets Building Cycle. We then applied this 3-year Kitchin Inventory Cycle to explain the cycles in China’s other key economic variables, such as money supply, stock market, rebar steel, inflation and bond yield.
We note that the three-year property inventory cycle is peaking, or has peaked in 2Q. Already, July’s economic data have begun to disappoint. The property inventory cycle leads the cycle of industrial finished goods by around six months (Focus Chart 2, top panel). The cycle in China’s capacity utilization demonstrates a similar lead time, too (Focus Chart 3). Importantly, M1 narrow money supply growth and stock prices in turn lead the property inventory cycle by more than three months (Focus Chart 2, bottom panel).While restocking activities could extend a little further, it is already in the price (Focus Chart 4). And the momentum of restocking will wane soon, if history is a guide.
Focus Chart 3: Capacity utilization leads finished goods inventory by more than 6 months.
 Focus Chart 4: The restocking is largely in the price; the momentum of stocks and metal is waning.
 Ancient Chinese Philosophy about Cycles
Unfortunately, doubts arise, as there appears to be little theoretical explanations for the alleged cycles, despite clear data evidence. In our March report on China’s three-year economic cycle, we offer the three-year duration of residential building construction as a hypothesis to explain China’s property investment cycle. But nagging questions remain. Paul Samuelson once dismissed the appearance of long waves as “simply historical accidents”.
Even Kondratieff, the economist who conceived the long-wave theory, sounded hesitant when he footnoted that he had “no intention of laying the foundations for an appropriate theory of long waves” in his original paper. After all, the accuracy of cycle prediction is inversely correlated with the length of the cycle. The longer the cycle, the more vague and inscrutable the lurid details in the economic data will become. We can use inflation and growth data to divide China’s economic growth stage into four quadrants, namely, reflation, recovery, overheat and recession. We can demonstrate clearly that the Chinese economy traverse through each of these growth stages in order, from recovery to “recession” since 2009. But since 2012, it seems to be stuck in between reflation and recession, following an “L-shaped” trajectory as suggested by the “authoritative figure” last May (Focus Chart 5). China’s economic cycle has turned murky.
Focus Chart 5: China’s investment clock is stuck in “L-shape”
Ancient Chinese Philosophy about Cycles
Unfortunately, doubts arise, as there appears to be little theoretical explanations for the alleged cycles, despite clear data evidence. In our March report on China’s three-year economic cycle, we offer the three-year duration of residential building construction as a hypothesis to explain China’s property investment cycle. But nagging questions remain. Paul Samuelson once dismissed the appearance of long waves as “simply historical accidents”.
Even Kondratieff, the economist who conceived the long-wave theory, sounded hesitant when he footnoted that he had “no intention of laying the foundations for an appropriate theory of long waves” in his original paper. After all, the accuracy of cycle prediction is inversely correlated with the length of the cycle. The longer the cycle, the more vague and inscrutable the lurid details in the economic data will become. We can use inflation and growth data to divide China’s economic growth stage into four quadrants, namely, reflation, recovery, overheat and recession. We can demonstrate clearly that the Chinese economy traverse through each of these growth stages in order, from recovery to “recession” since 2009. But since 2012, it seems to be stuck in between reflation and recession, following an “L-shaped” trajectory as suggested by the “authoritative figure” last May (Focus Chart 5). China’s economic cycle has turned murky.
Focus Chart 5: China’s investment clock is stuck in “L-shape”
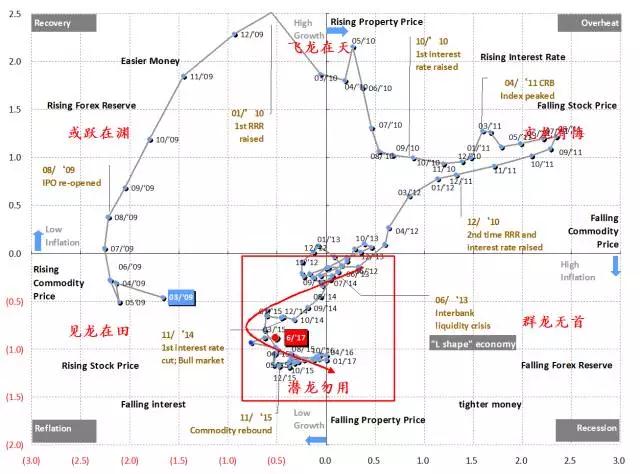 The Chinese ancient philosophy is full of discussions regarding cycles long before Jevons’s sun-spot theory, which initiated the serious research into economic cycles in the west. The I-Ching, for instance, is the oldest and most profound of the ancient Chinese classics. Essentially, the I-Ching is a book of divination based on cycles. In one of its most significant diagrams, the “Qian Diagram” (乾卦, the Diagram of the Sky), the I-Ching uses different states of a dragon to signify a complete circulation in the economic cycle. For instance, “the Dragon appearing in the field” (见龙在田)refers to recovery, “the Dragon on the wing in the sky” (飞龙在天) implies prosperity and “the dragon lying hidden in the deep” (潜龙勿用) suggests depression. Until today, some Chinese research and academic institutes still incorporate the theories of the I-Ching into their economic and market forecasts.
Other Chinese classics write explicitly about a twelve-year cycle. Sima Qian’s magnum opus, “Records of the Grand Historian”, widely regarded as one of the most significant Chinese history classics, combines the Jupiter Chronology with Chinese theory of “Five Elements” to describe the agricultural cycle - from harvest, crop failure, drought, and eventually to severe famine at the end of every twelve years. “Huainanzi” describes the process of how smaller three-year cycles embedded in a larger twelve-year cycles, with “crop output declining every three years, famine happening every six year, and a serious crop failure occurring every twelve years”. “Discourses on Salt and Iron”, another Chinese ancient classic, records a similar twelve-year agricultural cycle.
These ancient Chinese classics are roughly consistent with Jevons’s eleven-year sun-spot cycle based on Heinrich Schwabe’s discovery of the solar activity cycle. As solar activities affect climate changes, the similar durations of these cycles documented in both Chinese and the western cultures are likely to be more than mere happenstances. Their duration of twelve years is consistent with four shorter, three-year property investment cycles that we have demonstrated in our own research into China’s economic cycles.
The Chinese ancient philosophy is full of discussions regarding cycles long before Jevons’s sun-spot theory, which initiated the serious research into economic cycles in the west. The I-Ching, for instance, is the oldest and most profound of the ancient Chinese classics. Essentially, the I-Ching is a book of divination based on cycles. In one of its most significant diagrams, the “Qian Diagram” (乾卦, the Diagram of the Sky), the I-Ching uses different states of a dragon to signify a complete circulation in the economic cycle. For instance, “the Dragon appearing in the field” (见龙在田)refers to recovery, “the Dragon on the wing in the sky” (飞龙在天) implies prosperity and “the dragon lying hidden in the deep” (潜龙勿用) suggests depression. Until today, some Chinese research and academic institutes still incorporate the theories of the I-Ching into their economic and market forecasts.
Other Chinese classics write explicitly about a twelve-year cycle. Sima Qian’s magnum opus, “Records of the Grand Historian”, widely regarded as one of the most significant Chinese history classics, combines the Jupiter Chronology with Chinese theory of “Five Elements” to describe the agricultural cycle - from harvest, crop failure, drought, and eventually to severe famine at the end of every twelve years. “Huainanzi” describes the process of how smaller three-year cycles embedded in a larger twelve-year cycles, with “crop output declining every three years, famine happening every six year, and a serious crop failure occurring every twelve years”. “Discourses on Salt and Iron”, another Chinese ancient classic, records a similar twelve-year agricultural cycle.
These ancient Chinese classics are roughly consistent with Jevons’s eleven-year sun-spot cycle based on Heinrich Schwabe’s discovery of the solar activity cycle. As solar activities affect climate changes, the similar durations of these cycles documented in both Chinese and the western cultures are likely to be more than mere happenstances. Their duration of twelve years is consistent with four shorter, three-year property investment cycles that we have demonstrated in our own research into China’s economic cycles.
