Hong Hao: Great Powers Collide
2018-05-07 IMI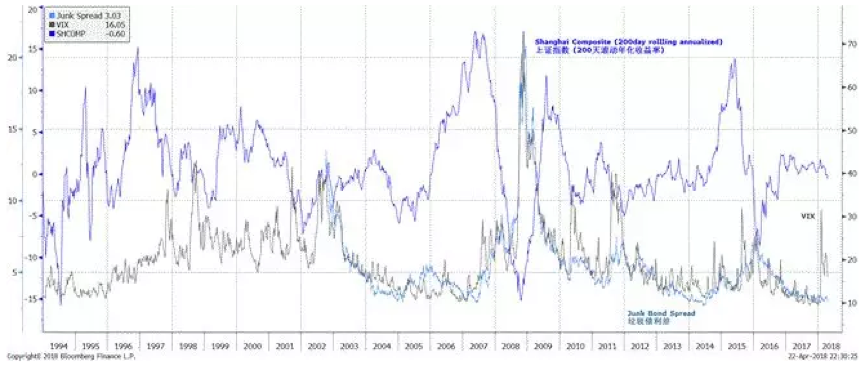 Meanwhile, China’s is working towards the goal of autarky, especially in the top echelon of global supply chain, and is developing naval prowess that could one day threaten the global trade system that is architected by the US, with the US navy as the security guarantor. Now that WTO covers more than 90% of global trade, the US can no longer use rapid inclusion of certain country as the bargaining chip, as it did in the 1950s to South Korea and to Poland in the 1960s.
As such, the trade disputes are increasingly bilateral and acrimonious, as Trump’s White House emphasizes “reciprocity” in its tenets of trade policy. It has slapped on steel tariff and then allowed exemptions to quickly align Europe, Japan, South Korea, India and Australia with the US camp. And the remaining common interests between Russia and China render the situation an increasingly uncanny feeling of the Cold War. China and Russia both voted against military action in Syria, for instance.
Despite some soul searching after the fall of ZTE, one of China’s bids towards global high-tech leadership, the market price actions seem to be implying some tic-for-tac retaliations in the coming months. In Chart 1, we have shown the almost perfect inverse correlation between the Shanghai Composite, the VIX and the junk bond spread. We previously documented this peculiar relationship in our note titled “The Great China Bubble: Anniversary Lessons and Outlook” (20160613). The burst of China’s stock market bubble in June 2015 (“The Great China Bubble: Lessons from 800 Years of History” 20150616) foreshadowed the surge in global market volatility from June 2016, induced by Brexit and later by the surprising outcome of the US election.
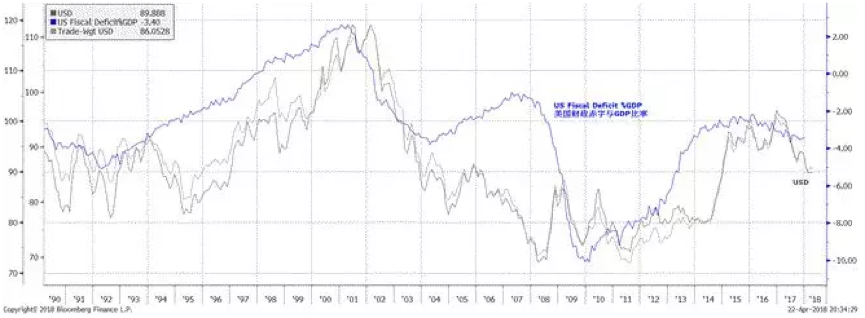
With the potential escalation of the trade disputes, the market is now rightly concerned about the dollar. The trade disputes threaten to undo the benefits from the Trump tax cut, and undermine the durability in the economy recovery. Already, leading economic indicators globally are rolling over. In history, the dollar has been highly correlated with the US fiscal deficit. When the deficit worsened, the dollar tended to weaken – as it is now (Chart 2). As such, a weak dollar is a sign of fundamental weakness, rather than an indication of abundant liquidity.
Chart 2: US fiscal deficit is worsening, and the dollar is breaking down.
Meanwhile, China’s is working towards the goal of autarky, especially in the top echelon of global supply chain, and is developing naval prowess that could one day threaten the global trade system that is architected by the US, with the US navy as the security guarantor. Now that WTO covers more than 90% of global trade, the US can no longer use rapid inclusion of certain country as the bargaining chip, as it did in the 1950s to South Korea and to Poland in the 1960s.
As such, the trade disputes are increasingly bilateral and acrimonious, as Trump’s White House emphasizes “reciprocity” in its tenets of trade policy. It has slapped on steel tariff and then allowed exemptions to quickly align Europe, Japan, South Korea, India and Australia with the US camp. And the remaining common interests between Russia and China render the situation an increasingly uncanny feeling of the Cold War. China and Russia both voted against military action in Syria, for instance.
Despite some soul searching after the fall of ZTE, one of China’s bids towards global high-tech leadership, the market price actions seem to be implying some tic-for-tac retaliations in the coming months. In Chart 1, we have shown the almost perfect inverse correlation between the Shanghai Composite, the VIX and the junk bond spread. We previously documented this peculiar relationship in our note titled “The Great China Bubble: Anniversary Lessons and Outlook” (20160613). The burst of China’s stock market bubble in June 2015 (“The Great China Bubble: Lessons from 800 Years of History” 20150616) foreshadowed the surge in global market volatility from June 2016, induced by Brexit and later by the surprising outcome of the US election.
With the potential escalation of the trade disputes, the market is now rightly concerned about the dollar. The trade disputes threaten to undo the benefits from the Trump tax cut, and undermine the durability in the economy recovery. Already, leading economic indicators globally are rolling over. In history, the dollar has been highly correlated with the US fiscal deficit. When the deficit worsened, the dollar tended to weaken – as it is now (Chart 2). As such, a weak dollar is a sign of fundamental weakness, rather than an indication of abundant liquidity.
Chart 2: US fiscal deficit is worsening, and the dollar is breaking down.
 China cutting RRR to counter the fall in FX funds position and the trade war; but rotation from stocks to bonds continues. In a relatively surprising move, the PBoC cut RRR, while maintaining that its monetary stance is prudent and neutral. The stock market’s enthusiasm about the cut quickly faded, while bond yield plunged.
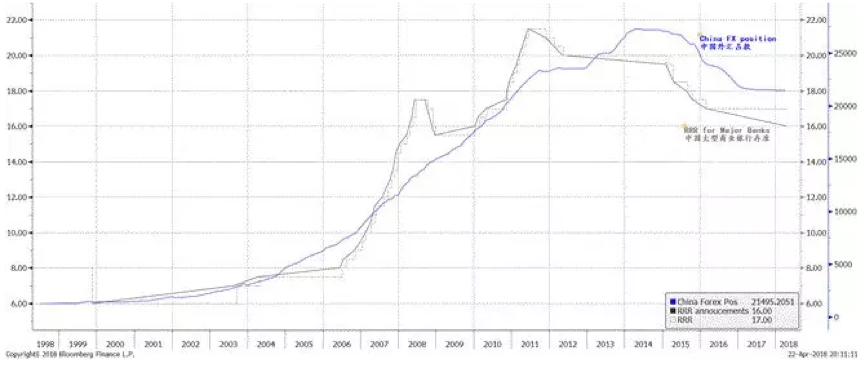
We note that China’s funds outstanding for FX has been falling since 2014, and thus the way the PBoC creates money has gradually changed away from forex recycling. As such, holding a very high reserve requirement by commercial banks is no longer required (Chart 3). Any further RRR cut should not be interpreted as the PBoC loosening its monetary policy, especially at a time when the risk of property bubble is still elevated, and real interest rate is still not high.
Chart 3: The PBoC cut RRR in response to falling funds outstanding for FX.
China cutting RRR to counter the fall in FX funds position and the trade war; but rotation from stocks to bonds continues. In a relatively surprising move, the PBoC cut RRR, while maintaining that its monetary stance is prudent and neutral. The stock market’s enthusiasm about the cut quickly faded, while bond yield plunged.
We note that China’s funds outstanding for FX has been falling since 2014, and thus the way the PBoC creates money has gradually changed away from forex recycling. As such, holding a very high reserve requirement by commercial banks is no longer required (Chart 3). Any further RRR cut should not be interpreted as the PBoC loosening its monetary policy, especially at a time when the risk of property bubble is still elevated, and real interest rate is still not high.
Chart 3: The PBoC cut RRR in response to falling funds outstanding for FX.
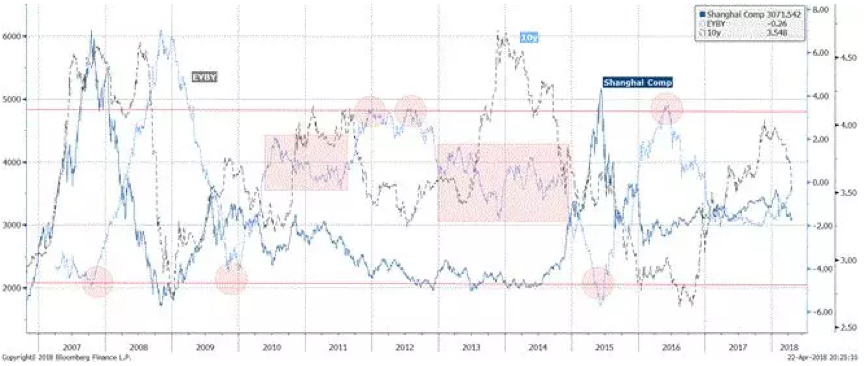
 Since late January this year, China’s long bond yield has been plunging, while stocks have cheapened. Even so, stocks, especially large cap blue chips that had rallied hard in the past two years, are still expensive relative to bonds, as suggested by our EYBY model. Incidentally, the A50 large-cap index has been the worst performing major index this year. Long bond yield, as well as the relative valuation comparison between bonds and stocks, tends to move in protracted trends, as history suggests. For now, with a slowing economy and limited inflation pressure, it is likely that such trends of falling long bond yields and falling stock prices will persist – till the trends exhaust.
Recently, we observe that off-balance sheet items are gradually being brought back onto balance sheet, as evidenced by the narrowing growth gap between M2 broad money supply and credit. However, demand for loans remains weak, probably as a result of a slowing economy. Consequently, money is flowing into bonds rather than stocks. (in our previous reports titled “Outlook 2018: View from the Peak” on 20171206, and “The Year of the Dog: Lessons from 2017” on 20180131, we have discussed the likelihood of such investment style rotation in mid 1Q2018). The plunge in long bond yield has been as dramatic as its surge in the last quarter of 2017.
Chart 4: Our EYBY model suggests funds continue to rotate from stocks to bonds.
Since late January this year, China’s long bond yield has been plunging, while stocks have cheapened. Even so, stocks, especially large cap blue chips that had rallied hard in the past two years, are still expensive relative to bonds, as suggested by our EYBY model. Incidentally, the A50 large-cap index has been the worst performing major index this year. Long bond yield, as well as the relative valuation comparison between bonds and stocks, tends to move in protracted trends, as history suggests. For now, with a slowing economy and limited inflation pressure, it is likely that such trends of falling long bond yields and falling stock prices will persist – till the trends exhaust.
Recently, we observe that off-balance sheet items are gradually being brought back onto balance sheet, as evidenced by the narrowing growth gap between M2 broad money supply and credit. However, demand for loans remains weak, probably as a result of a slowing economy. Consequently, money is flowing into bonds rather than stocks. (in our previous reports titled “Outlook 2018: View from the Peak” on 20171206, and “The Year of the Dog: Lessons from 2017” on 20180131, we have discussed the likelihood of such investment style rotation in mid 1Q2018). The plunge in long bond yield has been as dramatic as its surge in the last quarter of 2017.
Chart 4: Our EYBY model suggests funds continue to rotate from stocks to bonds.