Hong Hao: A Definitive Guide to Speculating in China
2018-06-28 IMI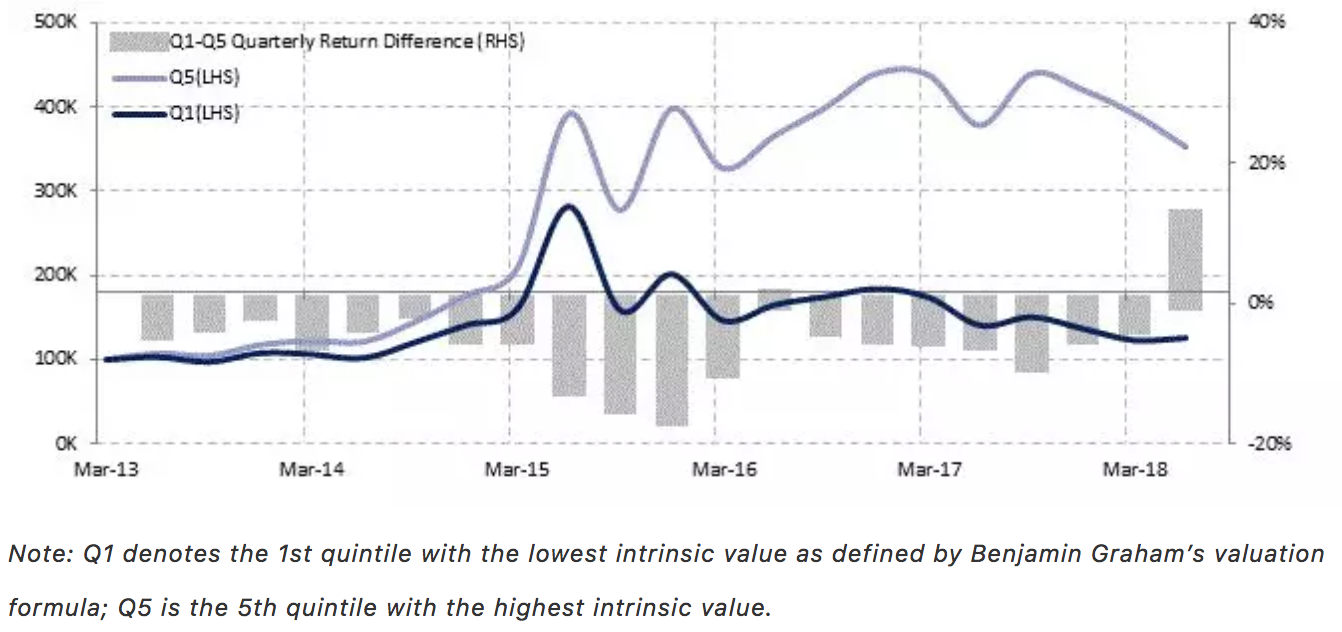 Our statistical analysis shows that value as a factor for stock picking has not been significant, and the stock portfolio based on this factor has indeed underperformed (see later discussions). Even after modification to take into account growth when estimating value using Benjamin Graham’s methodology discussed in detail later, the ensuing portfolio of stocks with high intrinsic value still has begun to underperform after 1Q18 (Exhibit 1). The Chinese stock market is back to its good old self – speculative, short-sighted and temperamental.
Defining Value. But Value Won’t Work.
Consensus defines value relative to price, instead of intrinsic value. Value investing as a long-term investment strategy has been misconstrued in China. Many apply low P/E or P/B valuation multiples as a shorthand for value. Even more just consider large-cap blue chips as proxies for value. Unfortunately, stocks are cheap for a reason most of the time. And low valuation can be a sign of low company quality, static growth, and thus high risk.
Size is not an indication of value, either – especially in China. Many of the large-cap companies in China have SOE background, and are nothing more than a symbol of bloated state support over the years. Their market size is granted by the state, not earned. As such, the larger the size, the more inefficient and mismanaged they are prone to be – precisely the opposite of value.
Benjamin Graham’s valuation formula. So how should one define value? It should be defined relative to the intrinsic value derived from a company’s growth potential, instead of relative to the market price that is subject to wild mood swings between excessive optimism and pessimism.
In his investment magnum opus “The Intelligent Investor”, Benjamin Graham defined value as follows:
“Most of the writing of security analysts on formal appraisals relates to the valuation of growth stocks. Our study of the various methods has led us to suggest a foreshortened and quite simple formula for the valuation of growth stocks, which is intended to produce figure fairly close to those resulting from the more refined mathematical calculations. Our formula is:
Value = Current (Normal) Earnings * (8.5 plus twice the expected annual growth rate)”.
Simply re-arranging Graham’s formula, we will have (Normal) P/E = 8.5 + 2*g.
That is, a company’s valuation should equal prevailing market return plus a premium for growth. We apply this definition of intrinsic value to portfolio construction. And we find that stocks with low intrinsic value have consistently and substantially underperformed those with high intrinsic value for the past five years, until 1Q18.
In short, three years after the burst of “the Great China Bubble”, value has stopped to perform. Many of the familiar blue chips, such as some famous Chinese liquor brands, now indeed rank very low when using Graham’s definition of value – simply because their stock prices have been bid up. There is indeed an investment style shift after 1Q18. We have discussed the likelihood of such style shift in our outlook report “Outlook 2018: View from the Peak” on 20171207. Speculation is back on.
The Return Factors in China
Stock selection based on size, momentum, and earnings revision work. Given that value in either its popular form or revised form will not work, we use factor analysis to identify the factors that will yield the best return. We have used the usual suspects, such as size, sentiment, earnings revision, momentum, etc. Our findings are summarized in Exhibit 2 (for A shares) and Exhibit 3 (for Hong Kong).
Exhibit 2: In A shares, size, earnings revision and momentum work, with momentum reversal
Our statistical analysis shows that value as a factor for stock picking has not been significant, and the stock portfolio based on this factor has indeed underperformed (see later discussions). Even after modification to take into account growth when estimating value using Benjamin Graham’s methodology discussed in detail later, the ensuing portfolio of stocks with high intrinsic value still has begun to underperform after 1Q18 (Exhibit 1). The Chinese stock market is back to its good old self – speculative, short-sighted and temperamental.
Defining Value. But Value Won’t Work.
Consensus defines value relative to price, instead of intrinsic value. Value investing as a long-term investment strategy has been misconstrued in China. Many apply low P/E or P/B valuation multiples as a shorthand for value. Even more just consider large-cap blue chips as proxies for value. Unfortunately, stocks are cheap for a reason most of the time. And low valuation can be a sign of low company quality, static growth, and thus high risk.
Size is not an indication of value, either – especially in China. Many of the large-cap companies in China have SOE background, and are nothing more than a symbol of bloated state support over the years. Their market size is granted by the state, not earned. As such, the larger the size, the more inefficient and mismanaged they are prone to be – precisely the opposite of value.
Benjamin Graham’s valuation formula. So how should one define value? It should be defined relative to the intrinsic value derived from a company’s growth potential, instead of relative to the market price that is subject to wild mood swings between excessive optimism and pessimism.
In his investment magnum opus “The Intelligent Investor”, Benjamin Graham defined value as follows:
“Most of the writing of security analysts on formal appraisals relates to the valuation of growth stocks. Our study of the various methods has led us to suggest a foreshortened and quite simple formula for the valuation of growth stocks, which is intended to produce figure fairly close to those resulting from the more refined mathematical calculations. Our formula is:
Value = Current (Normal) Earnings * (8.5 plus twice the expected annual growth rate)”.
Simply re-arranging Graham’s formula, we will have (Normal) P/E = 8.5 + 2*g.
That is, a company’s valuation should equal prevailing market return plus a premium for growth. We apply this definition of intrinsic value to portfolio construction. And we find that stocks with low intrinsic value have consistently and substantially underperformed those with high intrinsic value for the past five years, until 1Q18.
In short, three years after the burst of “the Great China Bubble”, value has stopped to perform. Many of the familiar blue chips, such as some famous Chinese liquor brands, now indeed rank very low when using Graham’s definition of value – simply because their stock prices have been bid up. There is indeed an investment style shift after 1Q18. We have discussed the likelihood of such style shift in our outlook report “Outlook 2018: View from the Peak” on 20171207. Speculation is back on.
The Return Factors in China
Stock selection based on size, momentum, and earnings revision work. Given that value in either its popular form or revised form will not work, we use factor analysis to identify the factors that will yield the best return. We have used the usual suspects, such as size, sentiment, earnings revision, momentum, etc. Our findings are summarized in Exhibit 2 (for A shares) and Exhibit 3 (for Hong Kong).
Exhibit 2: In A shares, size, earnings revision and momentum work, with momentum reversal
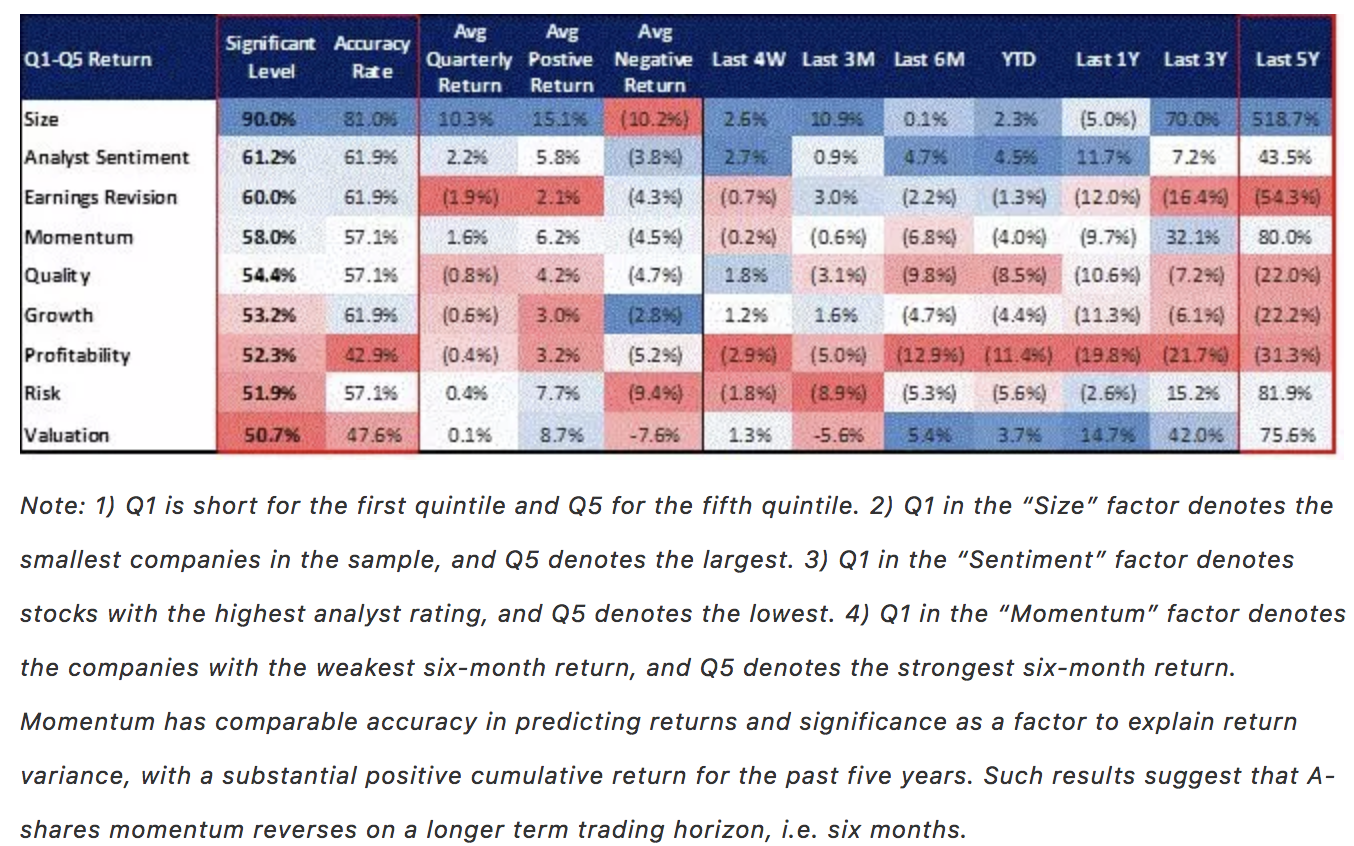 Our conclusion is that stocks with small size, low earnings revision, as well as weak six-month momentum produce better return in the A shares. These are the factors that we find explain the return variance the best amongst all the factors that we have tested (Exhibit 2). The Hong Kong market is the same, except that stocks with the strongest six-month momentum tend to produce best return (Exhibit 3). Hereafter, we focus on the momentum and size factors, two of the most important factors determining stock return in both A shares and Hong Kong.
A Shares are a speculative game. In A Shares, price momentum tends to reverse on the six-month horizon, but persist on a shorter time interval. And Hong Kong is the opposite. That is, while in Hong Kong, strong price momentum is a confirmation of the quality of a company, and continues to reward investors for owning the stock for longer term, it remains merely a price phenomenon in A Shares. Strong momentum in the A Shares reverses in six months to reward those who are willing to reap capital gains by passing on a stock that has risen to the next person. As such, the A Shares are a speculative game.
Exhibit 3: In Hong Kong, size, earnings revision, momentum also work, but with persistent momentum
Our conclusion is that stocks with small size, low earnings revision, as well as weak six-month momentum produce better return in the A shares. These are the factors that we find explain the return variance the best amongst all the factors that we have tested (Exhibit 2). The Hong Kong market is the same, except that stocks with the strongest six-month momentum tend to produce best return (Exhibit 3). Hereafter, we focus on the momentum and size factors, two of the most important factors determining stock return in both A shares and Hong Kong.
A Shares are a speculative game. In A Shares, price momentum tends to reverse on the six-month horizon, but persist on a shorter time interval. And Hong Kong is the opposite. That is, while in Hong Kong, strong price momentum is a confirmation of the quality of a company, and continues to reward investors for owning the stock for longer term, it remains merely a price phenomenon in A Shares. Strong momentum in the A Shares reverses in six months to reward those who are willing to reap capital gains by passing on a stock that has risen to the next person. As such, the A Shares are a speculative game.
Exhibit 3: In Hong Kong, size, earnings revision, momentum also work, but with persistent momentum
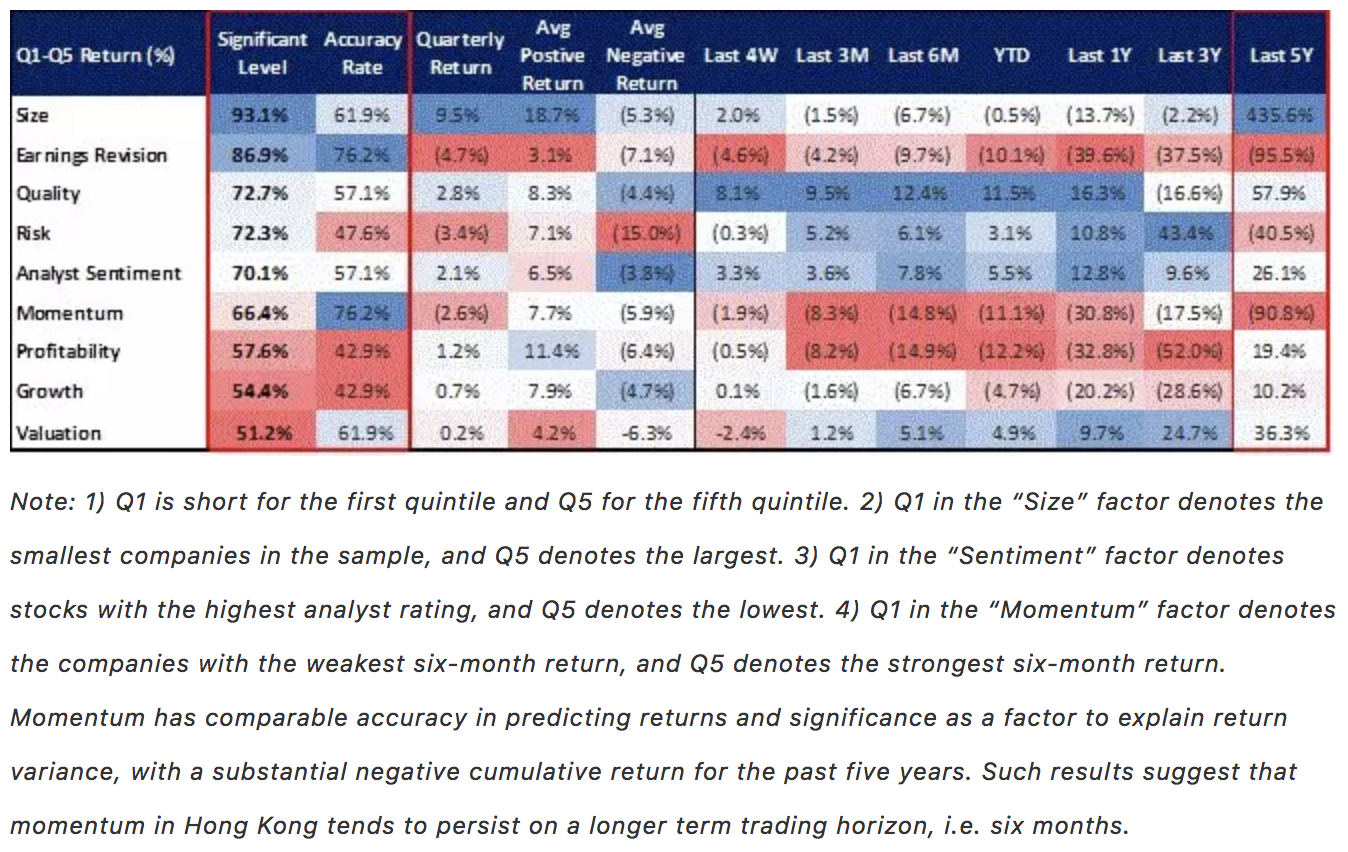 Size is the most significant factor in all markets. In both markets, size is the most significant factor determining stock return. The smaller the company size, the better the return. Over the past five years, small companies return over 500% in A Shares, and over 400% in Hong Kong.
Seeing these results, many would be quick to come to the conclusion that it is entirely due to rampant speculation. Given the reputation of the mainland Chinese market, and the stock market crash three years ago, such notion would easily find receptive audience. But the small-firm effect is a market anomaly long ago documented by Eugene Fama, a Nobel laureate. Similar observations can be made in the European market as well. As such, simply dismissing the small-firm effect as the result of speculation is hasty.
Why Small-cap Investing Works in the Long Run?
Large caps fund the excess return in small caps. Given the significance of the small-firm size effect, the glaring question is: who is on the other side of the trade to fund the excess return of the investing in small companies? As small vs. big companies are two mutually exclusive groups that make up the entire stock market, conclusion must follow that the opposite side of the small-cap trade must be the group that is trading large caps. The larger the group of large-cap buyers, and the more money sunk into large caps, the higher will be the excess return from investing in small caps.
Blindly believing in large caps is ignoring historical evidence from data, and is intellectually imprudent. Some argue that large caps offer more certainty, and thus should command a premium. But it is precisely because of this certainty that large-cap investing is a less risky undertaking. And basic finance theory dictates that higher risks tend to come with higher return.
Some believe large caps should have a “liquidity premium”, as they offer easy exits from a losing position. But it is precisely because of such good trading liquidity, holders of large caps will be more prone to speculate what the next person is willing to pay for his/her holding, instead of considering carefully the long-term prospective return as if s/he were the owner of the business. “This behavior is not the outcome of a wrong-headed propensity. It is an inevitable result of an investment market organized with a view to so-called ‘liquidity’”, as Keynes wrote. “For it is, so to speak, a game of Snap, of Old Maid, of Musical Chairs --- a pastime in which he is victor who says Snap neither too soon nor too late, who passed the Old Maid to his neighbor before the game is over, who secures a chair for himself when the music stops.”
Small caps are for the long run. The aftermath of speculation in a market organized around the perception liquidity can also be seen in terms of Graham’s valuation formula aforementioned. In Graham’s valuation formula, the only unknown variable that is subject to the influences of liquidity and sentiment is the long-term growth rate.
Holders of large caps with good liquidity hence are offered chances daily to guess what the growth rate will be in the eyes of the opposite side of his trade, and thus picking “not those faces which he himself finds the prettiest, but those which he thinks likeliest to catch the fancy of the other competitors, all of whom are looking at the problem from the same point of view.” In this sense, large-cap investing is indeed closer speculation – contrary to consensus. And the gyrations from guessing what the growth will be in the eyes of the trading counterparts represent the portion of price volatility not able to be explained by the changes in fundamentals, as Prof. Robert Shiller long ago documented.
Holders of small caps, on the other hand, tend not to have such a luxury, given the lack of liquidity in terms of lower trading volume, higher bid-ask spread and other transactional costs. They instead have to focus upon estimating what the long-term growth rate will be, and then stick with it. That is, the lack of liquidity in small caps indeed compels their holders to think long term like an owner. It is really a blessing in disguise.
How to Speculate in China
Small caps investing should continue to work. The eccentric and non-consensus conclusions from our analysis in this report are likely to receive a healthy dose of skepticism and criticism. Although logics and data analysis support our conclusions, given the fact that the country’s affairs continue to be managed by a top-down mantra to pick national champions, as well as the entrenched credence in large caps, small caps will remain a prodigal choice to many, and their excess return will continue to be funded by leakage from large caps.
Small caps are for the long term. For the near term, momentum reversal will continue to work in A Shares, as long as the market remains speculative as driven by predominantly investment in large caps. Combined with our proprietary gauge of market sentiment, it makes timing the market possible. For instance, we warned investors of the pending market crash with our report “The Year of the Dog: Lessons from 2017” on 31 January 2018.
Shanghai Composite to stay below 3300 for six months or more. In our report “Outlook 2018: View from the Peak” published on 20171204, we estimated that for the twelve months following the issuance of our forecast, the trading range for the Shanghai Composite should be 2800-3800, with the composite trading below 3300 for roughly six months or more. We also forecasted a sharp style shift in around the middle of 1Q18. Since our forecast, the trading range for the Shanghai Composite has been 3034-3587. And the composite has been trading below 3300 for almost six months.
Exhibit 4: For the past twenty years, a covert price ratio between Hong Kong and A-Shares
Size is the most significant factor in all markets. In both markets, size is the most significant factor determining stock return. The smaller the company size, the better the return. Over the past five years, small companies return over 500% in A Shares, and over 400% in Hong Kong.
Seeing these results, many would be quick to come to the conclusion that it is entirely due to rampant speculation. Given the reputation of the mainland Chinese market, and the stock market crash three years ago, such notion would easily find receptive audience. But the small-firm effect is a market anomaly long ago documented by Eugene Fama, a Nobel laureate. Similar observations can be made in the European market as well. As such, simply dismissing the small-firm effect as the result of speculation is hasty.
Why Small-cap Investing Works in the Long Run?
Large caps fund the excess return in small caps. Given the significance of the small-firm size effect, the glaring question is: who is on the other side of the trade to fund the excess return of the investing in small companies? As small vs. big companies are two mutually exclusive groups that make up the entire stock market, conclusion must follow that the opposite side of the small-cap trade must be the group that is trading large caps. The larger the group of large-cap buyers, and the more money sunk into large caps, the higher will be the excess return from investing in small caps.
Blindly believing in large caps is ignoring historical evidence from data, and is intellectually imprudent. Some argue that large caps offer more certainty, and thus should command a premium. But it is precisely because of this certainty that large-cap investing is a less risky undertaking. And basic finance theory dictates that higher risks tend to come with higher return.
Some believe large caps should have a “liquidity premium”, as they offer easy exits from a losing position. But it is precisely because of such good trading liquidity, holders of large caps will be more prone to speculate what the next person is willing to pay for his/her holding, instead of considering carefully the long-term prospective return as if s/he were the owner of the business. “This behavior is not the outcome of a wrong-headed propensity. It is an inevitable result of an investment market organized with a view to so-called ‘liquidity’”, as Keynes wrote. “For it is, so to speak, a game of Snap, of Old Maid, of Musical Chairs --- a pastime in which he is victor who says Snap neither too soon nor too late, who passed the Old Maid to his neighbor before the game is over, who secures a chair for himself when the music stops.”
Small caps are for the long run. The aftermath of speculation in a market organized around the perception liquidity can also be seen in terms of Graham’s valuation formula aforementioned. In Graham’s valuation formula, the only unknown variable that is subject to the influences of liquidity and sentiment is the long-term growth rate.
Holders of large caps with good liquidity hence are offered chances daily to guess what the growth rate will be in the eyes of the opposite side of his trade, and thus picking “not those faces which he himself finds the prettiest, but those which he thinks likeliest to catch the fancy of the other competitors, all of whom are looking at the problem from the same point of view.” In this sense, large-cap investing is indeed closer speculation – contrary to consensus. And the gyrations from guessing what the growth will be in the eyes of the trading counterparts represent the portion of price volatility not able to be explained by the changes in fundamentals, as Prof. Robert Shiller long ago documented.
Holders of small caps, on the other hand, tend not to have such a luxury, given the lack of liquidity in terms of lower trading volume, higher bid-ask spread and other transactional costs. They instead have to focus upon estimating what the long-term growth rate will be, and then stick with it. That is, the lack of liquidity in small caps indeed compels their holders to think long term like an owner. It is really a blessing in disguise.
How to Speculate in China
Small caps investing should continue to work. The eccentric and non-consensus conclusions from our analysis in this report are likely to receive a healthy dose of skepticism and criticism. Although logics and data analysis support our conclusions, given the fact that the country’s affairs continue to be managed by a top-down mantra to pick national champions, as well as the entrenched credence in large caps, small caps will remain a prodigal choice to many, and their excess return will continue to be funded by leakage from large caps.
Small caps are for the long term. For the near term, momentum reversal will continue to work in A Shares, as long as the market remains speculative as driven by predominantly investment in large caps. Combined with our proprietary gauge of market sentiment, it makes timing the market possible. For instance, we warned investors of the pending market crash with our report “The Year of the Dog: Lessons from 2017” on 31 January 2018.
Shanghai Composite to stay below 3300 for six months or more. In our report “Outlook 2018: View from the Peak” published on 20171204, we estimated that for the twelve months following the issuance of our forecast, the trading range for the Shanghai Composite should be 2800-3800, with the composite trading below 3300 for roughly six months or more. We also forecasted a sharp style shift in around the middle of 1Q18. Since our forecast, the trading range for the Shanghai Composite has been 3034-3587. And the composite has been trading below 3300 for almost six months.
Exhibit 4: For the past twenty years, a covert price ratio between Hong Kong and A-Shares
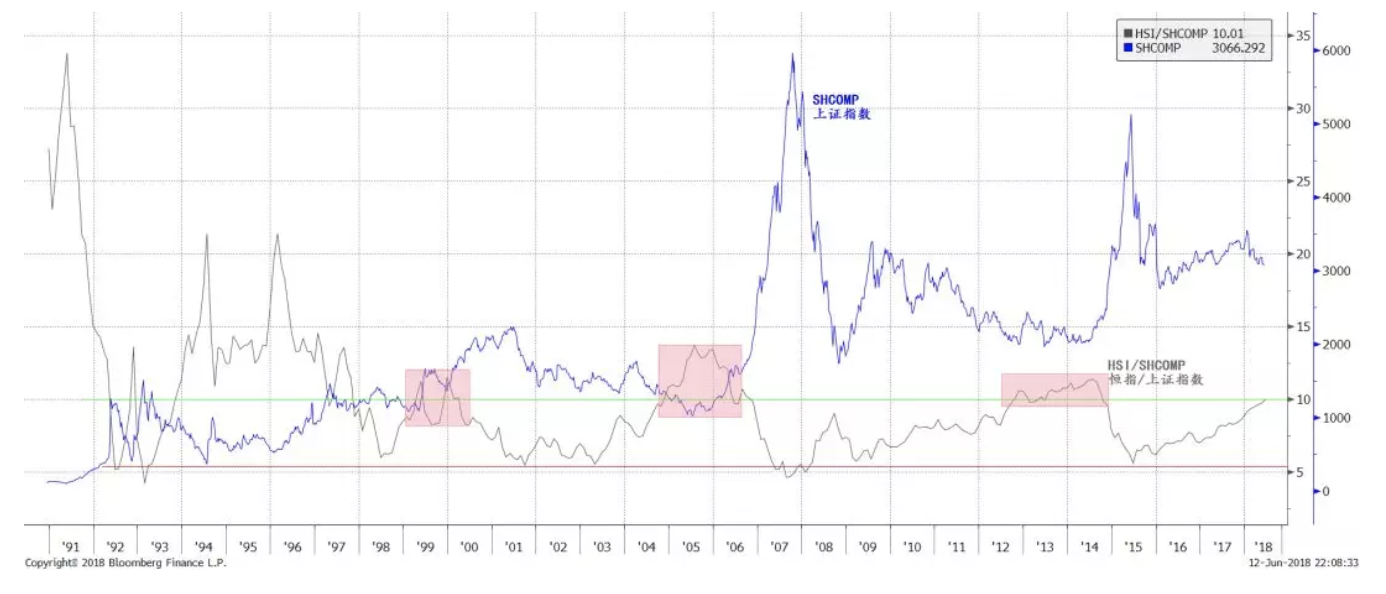 As for the Hang Seng index, we observe a covert price ratio between the Hang Seng and the Shanghai Composite. The ratio is bounded roughly between 5 and 10. Historically, whenever the ratio touched 5, the Shanghai Composite tended to peak, as in late 2007 and mid-2015. But when the ratio approached 10, as now, there tended to be accelerated downward pressure on the Shanghai Composite, before the index could finally bottom out, as denoted in the red-shaded areas in Exhibit 4. This covert trading multiplier between Hong Kong and Shanghai could be the result of different growth forecasts by the two markets that are bound by the underlying Chinese economy.
ChiNext should continue its outperformance, but less sure about the prospects of absolute return. Further, our forecast in our Outlook 2018 report was for small caps and ChiNext to outperform large caps, especially the SSE50 large-cap index. So far, the SSE50 large-cap index has been one of the worst-performing indices globally. The ChiNext surged 20% when it was recovering from the January sell-off, but recently is giving back most of the YTD gains while maintaining outperformance relative to large caps.
While small caps in the US and HK are making new highs, it is less obvious to us whether the ChiNext could offer absolute return for now, although relative performance continues to be likely. We continue to like healthcare, consumer and utility as stated in our outlook report, three best performing sectors YTD.
More RRR cuts are likely. As the PBoC cuts RRR to replace MLF, its balance sheet is growing more slowly, and can even shrink (please see our report “2H18: Rough Sailing” on 20180521). PBoC liquidity retrenchment tends to depress asset prices, increase market volatility and put pressure on RMB exchange rate.
In closing, let us quote Keynes once again:
“A collapse in the price of equities … may have been due to the weakening either of speculative confidence or of the state of credit. But whereas the weakening of either is enough to cause a collapse recovery requires the revival of both. For whilst the weakening of credit is sufficient to bring about a collapse, its strengthening, though a necessary condition of recovery, is not a sufficient condition”.
As for the Hang Seng index, we observe a covert price ratio between the Hang Seng and the Shanghai Composite. The ratio is bounded roughly between 5 and 10. Historically, whenever the ratio touched 5, the Shanghai Composite tended to peak, as in late 2007 and mid-2015. But when the ratio approached 10, as now, there tended to be accelerated downward pressure on the Shanghai Composite, before the index could finally bottom out, as denoted in the red-shaded areas in Exhibit 4. This covert trading multiplier between Hong Kong and Shanghai could be the result of different growth forecasts by the two markets that are bound by the underlying Chinese economy.
ChiNext should continue its outperformance, but less sure about the prospects of absolute return. Further, our forecast in our Outlook 2018 report was for small caps and ChiNext to outperform large caps, especially the SSE50 large-cap index. So far, the SSE50 large-cap index has been one of the worst-performing indices globally. The ChiNext surged 20% when it was recovering from the January sell-off, but recently is giving back most of the YTD gains while maintaining outperformance relative to large caps.
While small caps in the US and HK are making new highs, it is less obvious to us whether the ChiNext could offer absolute return for now, although relative performance continues to be likely. We continue to like healthcare, consumer and utility as stated in our outlook report, three best performing sectors YTD.
More RRR cuts are likely. As the PBoC cuts RRR to replace MLF, its balance sheet is growing more slowly, and can even shrink (please see our report “2H18: Rough Sailing” on 20180521). PBoC liquidity retrenchment tends to depress asset prices, increase market volatility and put pressure on RMB exchange rate.
In closing, let us quote Keynes once again:
“A collapse in the price of equities … may have been due to the weakening either of speculative confidence or of the state of credit. But whereas the weakening of either is enough to cause a collapse recovery requires the revival of both. For whilst the weakening of credit is sufficient to bring about a collapse, its strengthening, though a necessary condition of recovery, is not a sufficient condition”.
