Dong Jinyue and Xia Le: China Economic Outlook 1st Quarter 2018
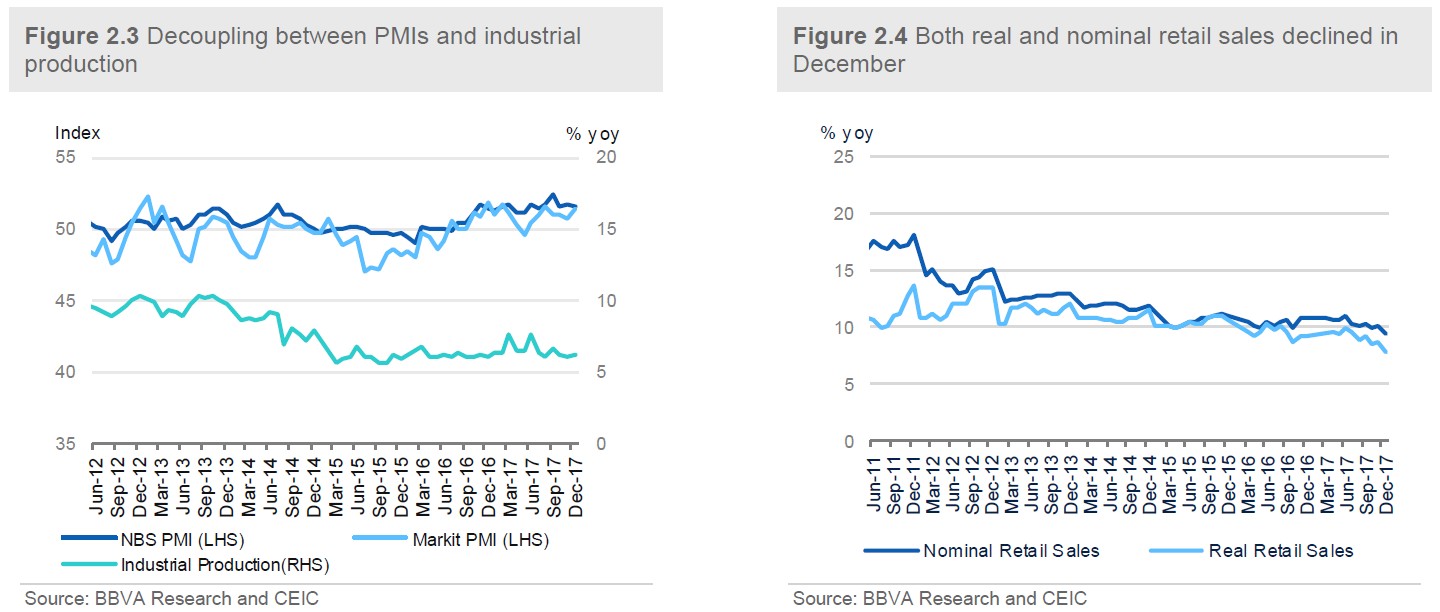
2018-02-06 IMI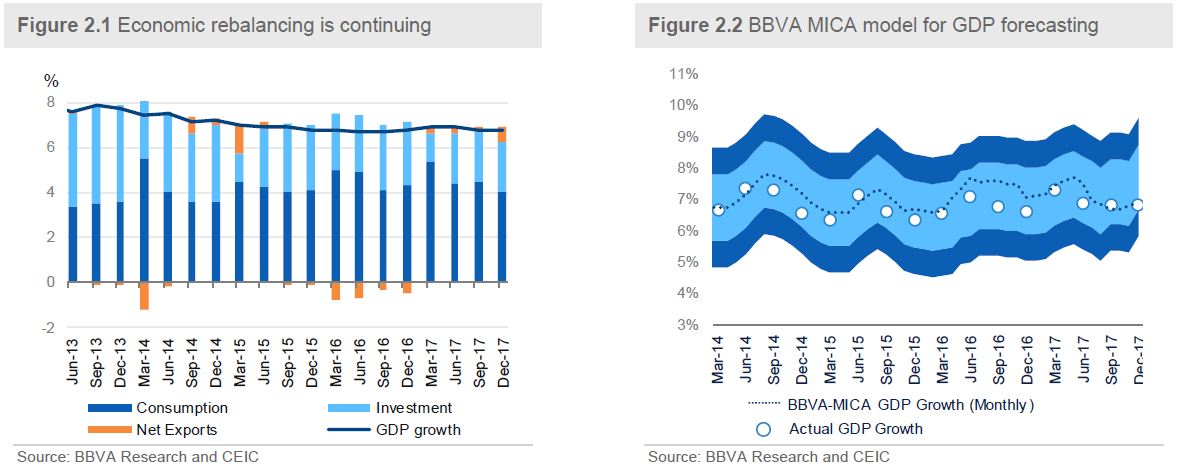 On the supply side, activity indicators are quite sluggish in December. Industrial production marginally increased to 6.2% y/y from 6.1% y/y previously (consensus: 6.1% y/y). Meanwhile, the different indicators of producers’ sentiment sent mixed signals. China’s official manufacturing PMI decreased to 51.6 in December from 51.8 in the previous month (Consensus: 51.6). While the Caixin China Manufacturing PMI, which includes a survey sample tilting toward SMEs and exporters, picked up to 51.5 in December (versus consensus 50.7) from 50.8 in the previous month (Figure 2.3)
The divergence between the official PMI and Caixin PMI as well as the anemic growth in industrial production confirmed our assessment that some growth headwinds such as the RMB appreciation and the enforcement of environmental policy tend to have a greater adverse impact on growth. Overall, the supply-side reform and the enforcement of environmental policy have led to production disruption.
The demand side is also subject to downward pressure. Retail sales growth slowed down significantly to 9.4% y/y in December from 10.2% y/y in the previous month (consensus: 10.2% y/y). (Figure 2.4) The slowdown was led by auto sales, which grew by 2.2% y/y in December compared to a 6.4% y/y growth in July, mainly due to the expiration of fiscal subsidy for passenger car purchase. The only silver lining is the rapid growth of online sales, surging 28% y/y in 2017 as a whole, significantly surpassing the aggregate retail sales growth at 10.2% in 2017.
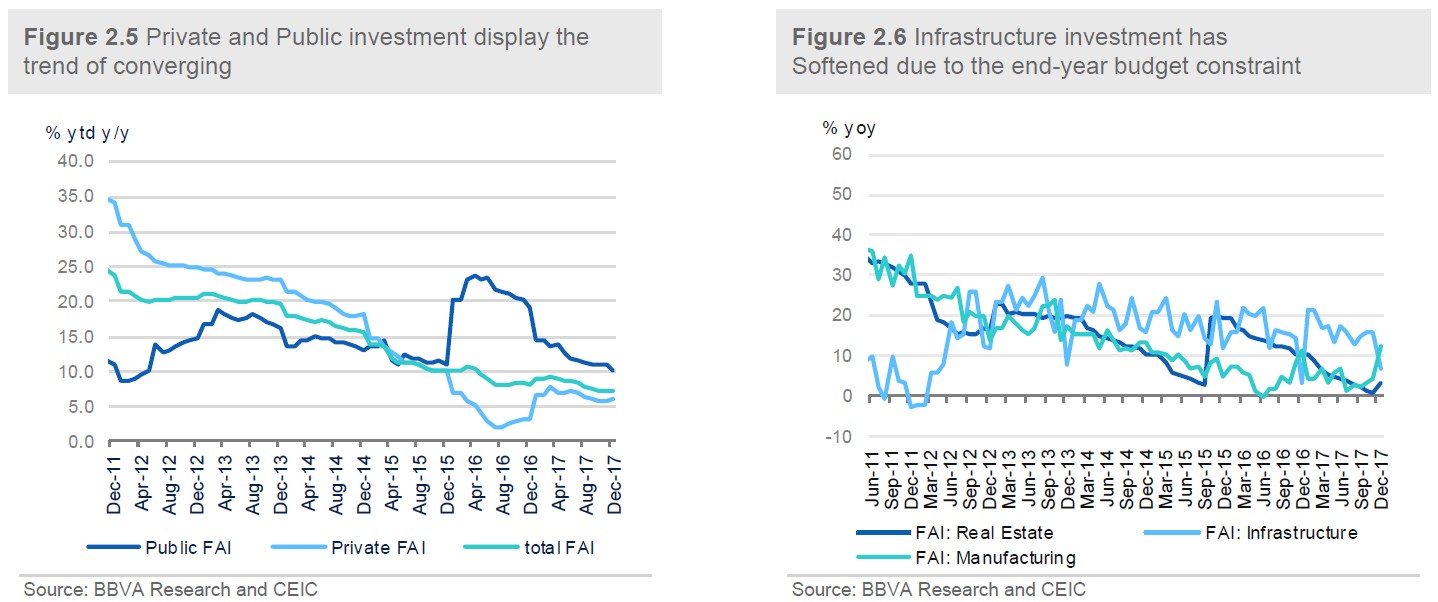
Demand-side weakness is also reflected by sluggish fixed asset investment which remained at 7.2% ytd y/y, the same with the previous reading (consensus: 7.1% ytd y/y), indicating investment was constrained by financial tightening. Moreover, the slowdown in investment is quite diverging among different categories as real estate and infrastructure sectors declined significantly while manufacturing investment displayed some pick-up. This is quite policy-led as the authorities had the end-year budget constraint thus lowered infrastructure investment. Moreover, the tightening measures on housing market continued. (Figure 2.6) The good news is that the growth of private investment increased to 9.2% ytd y/y in December from 4.8% ytd y/y previously, which is in line with the manufacturing investment pick-up as well as the Caixin PMI surpassing NBS PMI in December. (Figure 2.5)
On the supply side, activity indicators are quite sluggish in December. Industrial production marginally increased to 6.2% y/y from 6.1% y/y previously (consensus: 6.1% y/y). Meanwhile, the different indicators of producers’ sentiment sent mixed signals. China’s official manufacturing PMI decreased to 51.6 in December from 51.8 in the previous month (Consensus: 51.6). While the Caixin China Manufacturing PMI, which includes a survey sample tilting toward SMEs and exporters, picked up to 51.5 in December (versus consensus 50.7) from 50.8 in the previous month (Figure 2.3)
The divergence between the official PMI and Caixin PMI as well as the anemic growth in industrial production confirmed our assessment that some growth headwinds such as the RMB appreciation and the enforcement of environmental policy tend to have a greater adverse impact on growth. Overall, the supply-side reform and the enforcement of environmental policy have led to production disruption.
The demand side is also subject to downward pressure. Retail sales growth slowed down significantly to 9.4% y/y in December from 10.2% y/y in the previous month (consensus: 10.2% y/y). (Figure 2.4) The slowdown was led by auto sales, which grew by 2.2% y/y in December compared to a 6.4% y/y growth in July, mainly due to the expiration of fiscal subsidy for passenger car purchase. The only silver lining is the rapid growth of online sales, surging 28% y/y in 2017 as a whole, significantly surpassing the aggregate retail sales growth at 10.2% in 2017.
Demand-side weakness is also reflected by sluggish fixed asset investment which remained at 7.2% ytd y/y, the same with the previous reading (consensus: 7.1% ytd y/y), indicating investment was constrained by financial tightening. Moreover, the slowdown in investment is quite diverging among different categories as real estate and infrastructure sectors declined significantly while manufacturing investment displayed some pick-up. This is quite policy-led as the authorities had the end-year budget constraint thus lowered infrastructure investment. Moreover, the tightening measures on housing market continued. (Figure 2.6) The good news is that the growth of private investment increased to 9.2% ytd y/y in December from 4.8% ytd y/y previously, which is in line with the manufacturing investment pick-up as well as the Caixin PMI surpassing NBS PMI in December. (Figure 2.5)
 The effect of supply-side shocks on price indictors will continue
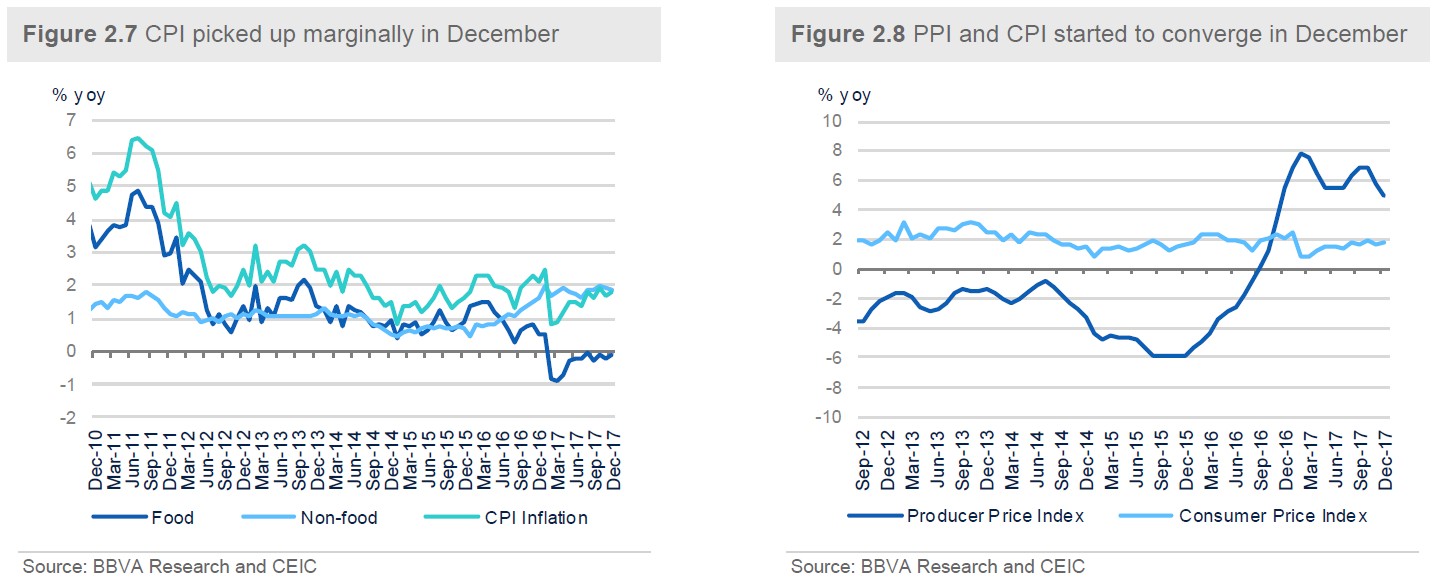
Headline CPI inflation picked up marginally to 1.8% y/y in December from 1.7% in the previous month, above market consensus of 1.7%.The uptick in CPI inflation was driven by food prices as their negative contribution to year-on-year price increase narrowed in December. Moreover, non-food price also increased, supported by the high crude oil price (Figure 2.7)
On the other hand, PPI decreased significantly to 4.9% y/y in December from 5.8% in the previous month (Consensus: 4.8%), which is the lowest within the year, mainly driven by the base effect. (Figure 2.8) That being said, CPI and PPI were converging in December. However, in the future, we predict the policy-led disruptions of supply side will bolster up PPI and widen their gap again. That means, we believe the rigidity of PPI will be high in this year given the on-going supply side reform and production reduction for environmental protection. Moreover, we forecast CPI will only modestly increase to around 2.3% in this year driven by a gradual recovery of food price and a high energy price.
The effect of supply-side shocks on price indictors will continue
Headline CPI inflation picked up marginally to 1.8% y/y in December from 1.7% in the previous month, above market consensus of 1.7%.The uptick in CPI inflation was driven by food prices as their negative contribution to year-on-year price increase narrowed in December. Moreover, non-food price also increased, supported by the high crude oil price (Figure 2.7)
On the other hand, PPI decreased significantly to 4.9% y/y in December from 5.8% in the previous month (Consensus: 4.8%), which is the lowest within the year, mainly driven by the base effect. (Figure 2.8) That being said, CPI and PPI were converging in December. However, in the future, we predict the policy-led disruptions of supply side will bolster up PPI and widen their gap again. That means, we believe the rigidity of PPI will be high in this year given the on-going supply side reform and production reduction for environmental protection. Moreover, we forecast CPI will only modestly increase to around 2.3% in this year driven by a gradual recovery of food price and a high energy price.
 Monetary prudence helped to contain credit boom
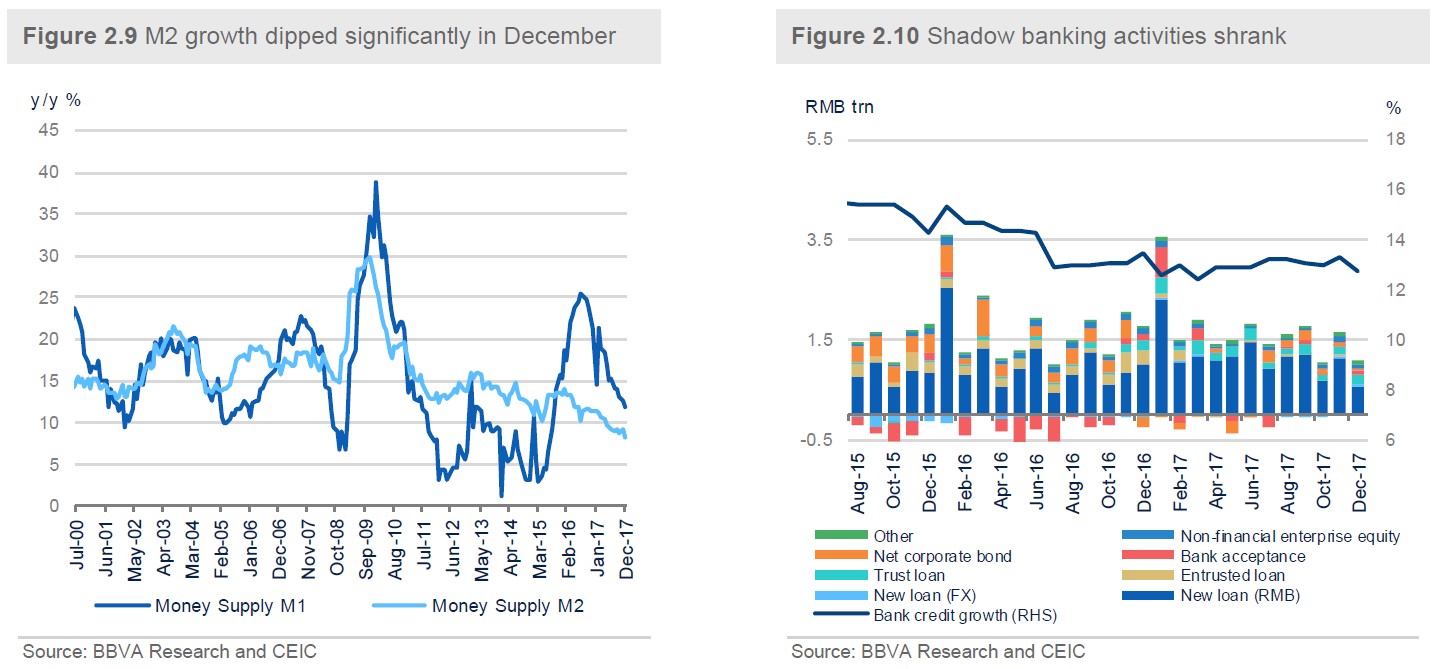
Starting from end-2016, the authorities fine-tuned their monetary policy stance from “accommodative” to “prudent”. In practice, the PBoC even guided market interest rates to a higher level so as to curb shadow banking activities and contain credit boom. These measures have maintained the effect through the year as M2 growth dipped to its historical low of 8.2% y/y in December, compared with the previous month’s reading at 9.1% YoY (consensus: 9.2% YoY). (Figure 2.13)
Meanwhile, the growth of new loans and total social financing also decreased significantly in December. In particular, total social financing declined to RMB 1,140 billion (prior: RMB 1,619.6 billion; consensus: RMB 1,500 billion) in December and New yuan loans also dropped to RMB 584.4 bn (prior: RMB 1,120 billion; consensus: RMB 1,000 billion). (Figure 2.14)
The low credit data in December reflected the effect of financial sector deleveraging as banks shrank their shadow banking business. Moreover, the end-year Macro Prudential Assessment also played a role on low credit expansion as banks lowered their lending in December. On the other hand, enterprises and household also had lower capital demand due to the ongoing corporate deleveraging and housing market tightening. We believe this is quite temporary as it is mainly driven by seasonal effect. We predict M2 growth will maintain at a moderated level in 2018 given the financial tightening continues.
Monetary prudence helped to contain credit boom
Starting from end-2016, the authorities fine-tuned their monetary policy stance from “accommodative” to “prudent”. In practice, the PBoC even guided market interest rates to a higher level so as to curb shadow banking activities and contain credit boom. These measures have maintained the effect through the year as M2 growth dipped to its historical low of 8.2% y/y in December, compared with the previous month’s reading at 9.1% YoY (consensus: 9.2% YoY). (Figure 2.13)
Meanwhile, the growth of new loans and total social financing also decreased significantly in December. In particular, total social financing declined to RMB 1,140 billion (prior: RMB 1,619.6 billion; consensus: RMB 1,500 billion) in December and New yuan loans also dropped to RMB 584.4 bn (prior: RMB 1,120 billion; consensus: RMB 1,000 billion). (Figure 2.14)
The low credit data in December reflected the effect of financial sector deleveraging as banks shrank their shadow banking business. Moreover, the end-year Macro Prudential Assessment also played a role on low credit expansion as banks lowered their lending in December. On the other hand, enterprises and household also had lower capital demand due to the ongoing corporate deleveraging and housing market tightening. We believe this is quite temporary as it is mainly driven by seasonal effect. We predict M2 growth will maintain at a moderated level in 2018 given the financial tightening continues.
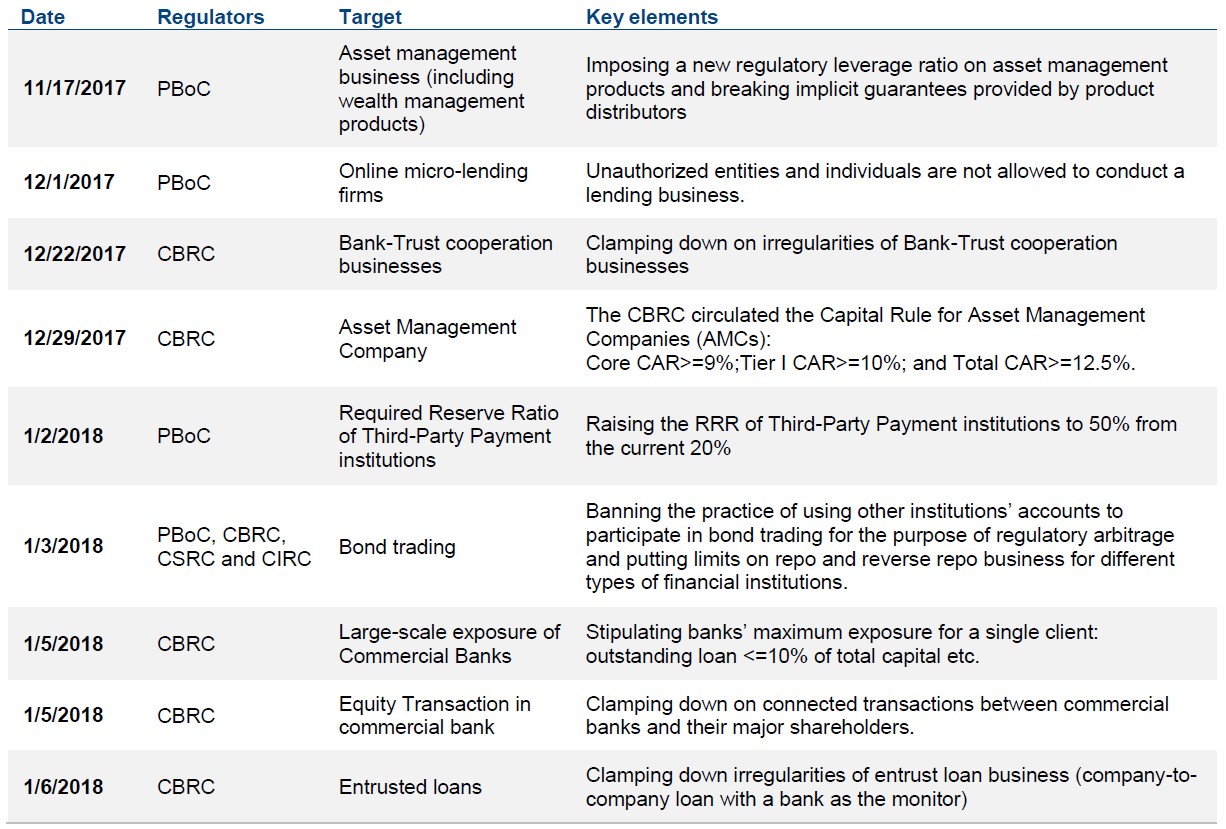
 Prudent monetary policy and regulatory tightening continued in the aftermath of the 19th Party’s Congress. The recent regulatory changes are shown in the following table. These regulatory changes touched upon a lot of areas in the financial sector, in particular the ones related to shadow banking activities: the cooperation business between banks and trust companies, entrust loans and wealthy management products, etc. All of them are regarded as key elements in China’s ballooning shadow banking activities. Moreover, the regulators have also tightened the regulations on bond trading so as to severe the linkage between shadow banking activities and the bond market. The authorities have become tougher on third-party payment institutions as many shadow banking activities are now disguised as Fintech businesses. Overall, these tightening measures can be considered as the embodiment of the new regulatory principle set in the recently concluded 19th Party’s Congress. We expect them to bring negative but manageable shocks to China’s financial market, in particular the bond market, in the next couple of years.
 Housing markets continued to cool down due to the tightening measures
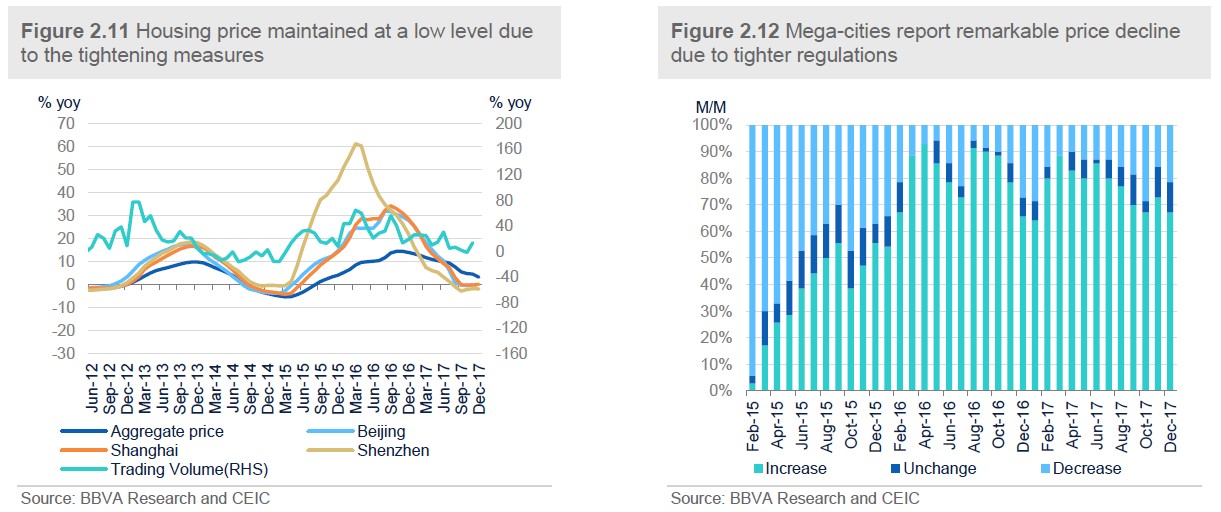
The tightening measures on the property market have effectively moderated price increases and frozen the trading volume in Tier 1 cities (Figure 2.15). As more local authorities started to deploy tightening measures in cities other than tier 1, housing bubbles now seem to ease further. However, there are still much more cities reporting housing price increasing than the cities reporting decreasing, mainly are smaller cities. (Figure 2.16) On top of imposing home purchase restrictions, the authorities also use financial tools to contain housing bubbles, such as increasing the interest rate of mortgage loans. Moreover, the authorities particularly forbid home buyers from borrowing short-term loans to pay for their down payment, in a bid to keep household leverage at a manageable level.
Altogether, although the housing market tightening measures helped to ease housing bubble and maintain financial stability, we believe that housing market cooling down will drag on growth this year.
Housing markets continued to cool down due to the tightening measures
The tightening measures on the property market have effectively moderated price increases and frozen the trading volume in Tier 1 cities (Figure 2.15). As more local authorities started to deploy tightening measures in cities other than tier 1, housing bubbles now seem to ease further. However, there are still much more cities reporting housing price increasing than the cities reporting decreasing, mainly are smaller cities. (Figure 2.16) On top of imposing home purchase restrictions, the authorities also use financial tools to contain housing bubbles, such as increasing the interest rate of mortgage loans. Moreover, the authorities particularly forbid home buyers from borrowing short-term loans to pay for their down payment, in a bid to keep household leverage at a manageable level.
Altogether, although the housing market tightening measures helped to ease housing bubble and maintain financial stability, we believe that housing market cooling down will drag on growth this year.
 Divergence of exports and imports at end-year
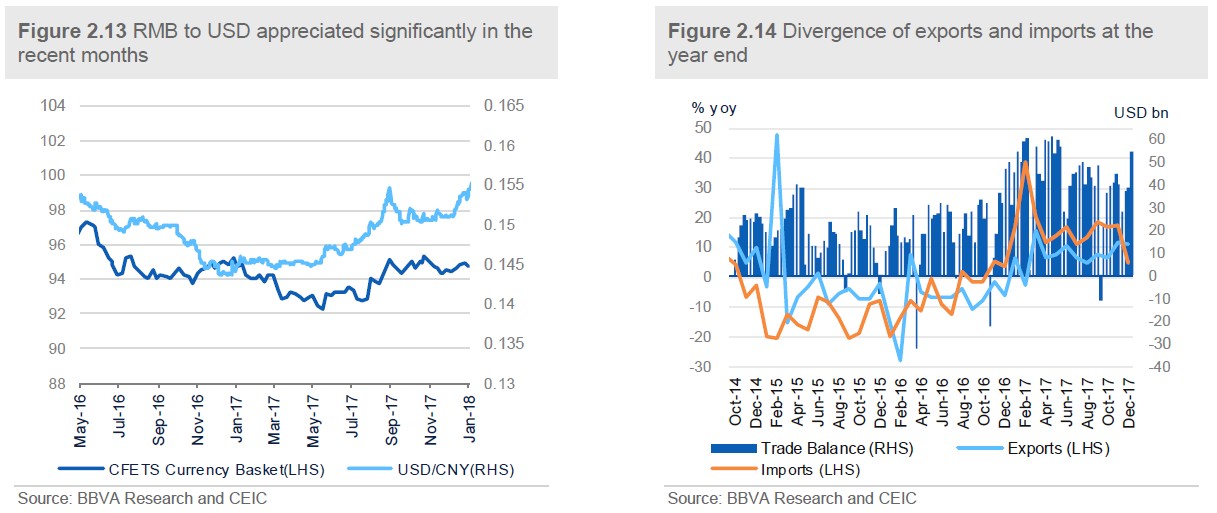
In December, the growth of exports (in USD terms) marginally decreased to 10.9% y/y (versus consensus: 10.8% y/y) from the previous reading of 11.5% while imports significantly dropped to a year-on-year growth of 4.5% (versus consensus: 15.1% y/y; prior: 17.6% y/y). As a result, the balance of trade expanded to USD 54.69 billion in December from USD 38.98 billion in the previous month. (Figure 2.10)
Due to the continuing recovery of global economy, exports at the end-year still maintained at a relatively high level. On the other hand, the significant drop of imports was mainly due to: (i) a production reduction for environmental protection in winter; (ii) a high inventory and (iii) a high base effect. Given the significant appreciation of RMB to USD exchange rate in December, it seems that it has not transmitted to exports and imports yet. However, we believe a continuing currency appreciation might push up imports while decrease exports in the short term.
For 2017 as a whole, total exports increased to 8% y/y in terms of US Dollar, compared with -7% y/y in 2016; total imports increased to 16.7% y/y in terms of US Dollar, compared with -5.3% in 2016. We predict that exports will maintain a sustainable growth in 2018, mainly due to the US tax cut effect following with a worldwide tax reduction, as well as a continuing global growth recovery. On the other hand, we predict a modestly slower growth rate of imports compared with that of 2017, due to the continuing deleveraging in financial sector and in the over-capacity industries.
The unexpected RMB appreciation
The RMB exchange rate experienced a sharp appreciation recently on the backdrop of a sluggish USD. Accumulatively, the RMB has appreciated by 5.3% against the USD since the beginning of the third quarter of 2017 and by 0.9% since the beginning of the New Year. It is noted that the RMB appreciation during this period is not only against the USD but also against the CFETS currency basket. (Figure 2.9) Despite the persist weakness of the USD, the strong rebound of the RMB also benefits from the ever-increasing restrictions under the capital account. Moreover, the recent recovery of the macro economy also supported the RMB exchange rate.
Divergence of exports and imports at end-year
In December, the growth of exports (in USD terms) marginally decreased to 10.9% y/y (versus consensus: 10.8% y/y) from the previous reading of 11.5% while imports significantly dropped to a year-on-year growth of 4.5% (versus consensus: 15.1% y/y; prior: 17.6% y/y). As a result, the balance of trade expanded to USD 54.69 billion in December from USD 38.98 billion in the previous month. (Figure 2.10)
Due to the continuing recovery of global economy, exports at the end-year still maintained at a relatively high level. On the other hand, the significant drop of imports was mainly due to: (i) a production reduction for environmental protection in winter; (ii) a high inventory and (iii) a high base effect. Given the significant appreciation of RMB to USD exchange rate in December, it seems that it has not transmitted to exports and imports yet. However, we believe a continuing currency appreciation might push up imports while decrease exports in the short term.
For 2017 as a whole, total exports increased to 8% y/y in terms of US Dollar, compared with -7% y/y in 2016; total imports increased to 16.7% y/y in terms of US Dollar, compared with -5.3% in 2016. We predict that exports will maintain a sustainable growth in 2018, mainly due to the US tax cut effect following with a worldwide tax reduction, as well as a continuing global growth recovery. On the other hand, we predict a modestly slower growth rate of imports compared with that of 2017, due to the continuing deleveraging in financial sector and in the over-capacity industries.
The unexpected RMB appreciation
The RMB exchange rate experienced a sharp appreciation recently on the backdrop of a sluggish USD. Accumulatively, the RMB has appreciated by 5.3% against the USD since the beginning of the third quarter of 2017 and by 0.9% since the beginning of the New Year. It is noted that the RMB appreciation during this period is not only against the USD but also against the CFETS currency basket. (Figure 2.9) Despite the persist weakness of the USD, the strong rebound of the RMB also benefits from the ever-increasing restrictions under the capital account. Moreover, the recent recovery of the macro economy also supported the RMB exchange rate.
 Risks to BOP eased mainly due to the recent RMB appreciation and the authorities’ measures
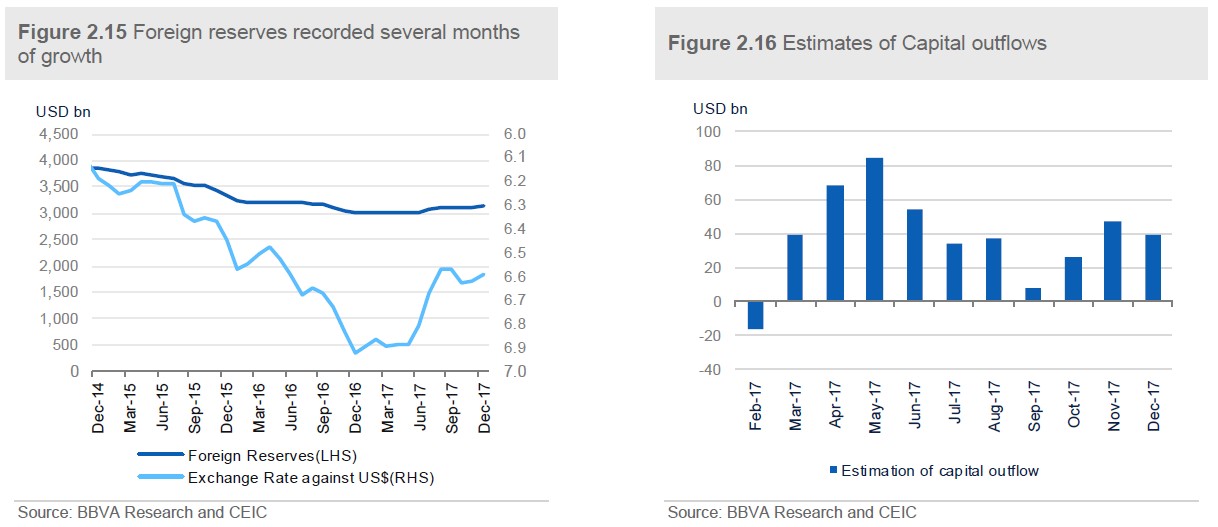
Foreign reserves continued to grow in the fourth quarter and reach USD 3.14 trillion at end-December, up from USD 3.12 trillion in the previous month. (Figure 2.11) Barring the favourable valuation effects of non-USD foreign reserves over the past several months (mainly due to a depreciation of USD), the narrowed capital outflows due to strict regulation measures also contributed to the growth of foreign reserves. In particular, we estimate that capital outflows amounted to USD 39.7 billion in December, down from USD 47.3 billion in the previous month. (Figure 2.12)
The recent sharp RMB appreciation, together with the authorities’ measures of “restrict capital outflows and promote capital inflows”, will continue to mitigate risks to China’s Balance of Payment (BOP) and help to avert a vicious spiral of currency depreciation and capital flight.
Risks to BOP eased mainly due to the recent RMB appreciation and the authorities’ measures
Foreign reserves continued to grow in the fourth quarter and reach USD 3.14 trillion at end-December, up from USD 3.12 trillion in the previous month. (Figure 2.11) Barring the favourable valuation effects of non-USD foreign reserves over the past several months (mainly due to a depreciation of USD), the narrowed capital outflows due to strict regulation measures also contributed to the growth of foreign reserves. In particular, we estimate that capital outflows amounted to USD 39.7 billion in December, down from USD 47.3 billion in the previous month. (Figure 2.12)
The recent sharp RMB appreciation, together with the authorities’ measures of “restrict capital outflows and promote capital inflows”, will continue to mitigate risks to China’s Balance of Payment (BOP) and help to avert a vicious spiral of currency depreciation and capital flight.
 3. Entering “great moderation” with optimism
Some upward revision of short-run GDP
China’s growth has exhibited some new developments in the second half of 2017 and the final GDP growth outturn is actually better-than-expected. However, signs of moderation emerged in the 2H of 2017 due to a number of policy tightening including monetary prudence, regulatory efforts to curb shadow banking activities and overheating property market. On the other hand, these policy initiatives have helped to mitigate several tail risks to the economy and financial stability, increasing the likelihood of a soft-landing scenario for the world’s second largest economy.
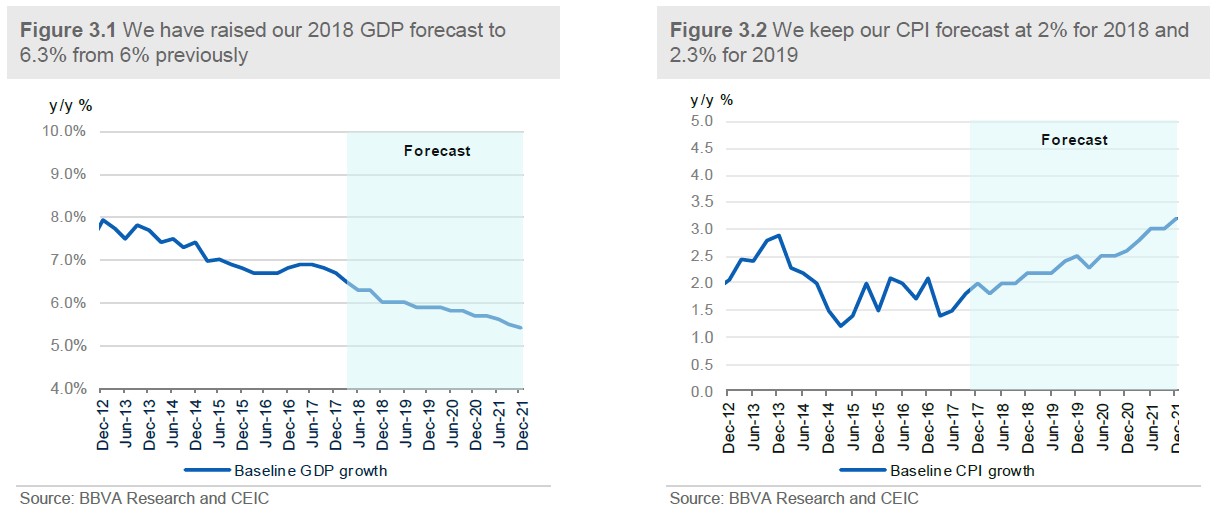
Accordingly, we raise our 2018 growth forecast to 6.3% from 6% previously and maintain 2019 forecasting at 6%, reflecting the strong 2017 growth and mitigated financial risks. However, they are still somewhat lower than the market consensus (Bloomberg consensus: 6.5% for 2018 and 6.2% for 2019). Nevertheless, we anticipate that the authorities broadly maintain the policy mix in the next couple of years over the concern of financial stability. In addition, we believe that the growth will be mainly driven by domestic consumption this year. Specifically, we predict consumption will contribute to around 4.5% (versus: 4.1% in 2017) for GDP growth, dominating investment’s contribution of 1.6% (versus: 2.2% in 2017) and net export’s contribution at 0.2% (versus: 0.5% in 2017).
Regarding inflation, we remain our 2018 monthly average projection of CPI at 2% in 2018 and 2.3% in 2019 (Bloomberg: 2.3% for 2018 and 2.2% for 2019) due to lower-than-expected food prices in the last year (Figure 3.2). Looking ahead, the CPI and PPI will finally converge in the long term. CPI is expected to trend up gradually after the food-prices rebound from the current low level. Meanwhile, the PPI will gradually slow its pace as the supply-side reform proceeds. That being said, supply-side shocks caused by overcapacity elimination are likely to have diminishing marginal impact on price levels as investors gradually factor it into their expectations.
3. Entering “great moderation” with optimism
Some upward revision of short-run GDP
China’s growth has exhibited some new developments in the second half of 2017 and the final GDP growth outturn is actually better-than-expected. However, signs of moderation emerged in the 2H of 2017 due to a number of policy tightening including monetary prudence, regulatory efforts to curb shadow banking activities and overheating property market. On the other hand, these policy initiatives have helped to mitigate several tail risks to the economy and financial stability, increasing the likelihood of a soft-landing scenario for the world’s second largest economy.
Accordingly, we raise our 2018 growth forecast to 6.3% from 6% previously and maintain 2019 forecasting at 6%, reflecting the strong 2017 growth and mitigated financial risks. However, they are still somewhat lower than the market consensus (Bloomberg consensus: 6.5% for 2018 and 6.2% for 2019). Nevertheless, we anticipate that the authorities broadly maintain the policy mix in the next couple of years over the concern of financial stability. In addition, we believe that the growth will be mainly driven by domestic consumption this year. Specifically, we predict consumption will contribute to around 4.5% (versus: 4.1% in 2017) for GDP growth, dominating investment’s contribution of 1.6% (versus: 2.2% in 2017) and net export’s contribution at 0.2% (versus: 0.5% in 2017).
Regarding inflation, we remain our 2018 monthly average projection of CPI at 2% in 2018 and 2.3% in 2019 (Bloomberg: 2.3% for 2018 and 2.2% for 2019) due to lower-than-expected food prices in the last year (Figure 3.2). Looking ahead, the CPI and PPI will finally converge in the long term. CPI is expected to trend up gradually after the food-prices rebound from the current low level. Meanwhile, the PPI will gradually slow its pace as the supply-side reform proceeds. That being said, supply-side shocks caused by overcapacity elimination are likely to have diminishing marginal impact on price levels as investors gradually factor it into their expectations.
 Mild currency depreciation will continue with a measured pace
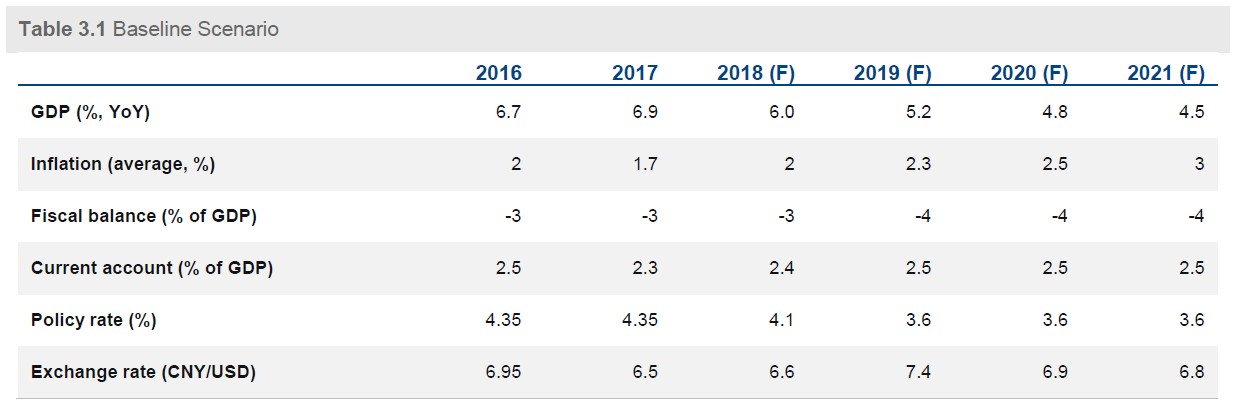
The recent strong performance of the RMB has made us revise our projections of the exchange rate in the short term, mainly in the pace but not in the direction. We anticipate that the exchange rate will depreciate to 6.6 at end-2018 from end-2017 outturn at 6.5 with a very mild pace. Such a trajectory means a relatively stable value against the CFETS currency basket, which has become the important anchor of the RMB given that the authorities still need a competitive export sector to offset any negative shock to the economy in the course of policy tightening. (Table 3.1) At the same time, the weak US dollar has given China’s authorities more room to introduce more two-way movements to the RMB exchange rate. That being said, the volatility of USDCNY is set to rise this year.
We believe that a “clean float” remains the authorities’ ultimate goal of exchange rate reform. The floating of the RMB might take place in the second half of 2019, which could make the exchange rate overshoot to 7.4 during a short period but ultimately go back to its long-term equilibrium level of around 6.8.
Mild currency depreciation will continue with a measured pace
The recent strong performance of the RMB has made us revise our projections of the exchange rate in the short term, mainly in the pace but not in the direction. We anticipate that the exchange rate will depreciate to 6.6 at end-2018 from end-2017 outturn at 6.5 with a very mild pace. Such a trajectory means a relatively stable value against the CFETS currency basket, which has become the important anchor of the RMB given that the authorities still need a competitive export sector to offset any negative shock to the economy in the course of policy tightening. (Table 3.1) At the same time, the weak US dollar has given China’s authorities more room to introduce more two-way movements to the RMB exchange rate. That being said, the volatility of USDCNY is set to rise this year.
We believe that a “clean float” remains the authorities’ ultimate goal of exchange rate reform. The floating of the RMB might take place in the second half of 2019, which could make the exchange rate overshoot to 7.4 during a short period but ultimately go back to its long-term equilibrium level of around 6.8.
 Monetary and fiscal policy outlook
A combination of a prudent monetary policy with tightening bias and a fiscal easing is predicted to be the main framework of the macro policy in 2018. A prudent monetary policy is consistent with the authorities’ emphasis on maintaining financial stability and curtailing the rising risks in housing bubbles, debt overhang and shadow banking activities. At the same time, more regulations on shadow banking and the property sector are expected to be unveiled on top of those in place, which could lead to an additional tightening of credit conditions and weigh on growth.
Corresponding to the US interest rate hike in 2018, we do not think the PBoC will follow to increase the benchmark lending rate and deposit rate. This is because the current RMB exchange rate and low inflation environment do not urgently require an interest rate hike. Moreover, as the financial deleveraging is continuing, the market interest rate has a tendency to be high, which lowers the urgent need for interest rate hike in China. On the other hand, considering the capital flight risk due to the US interest rate hike, as China still has a closed capital account, the authorities could apply various regulatory measures to control capital outflows.
Under the framework of monetary policy tightening, some unconventional monetary instruments will also be implemented, in order to maintain liquidity in the banking sector. For instance, Standing Lending Facilities (SLF) and Medium-term Lending Facilities (MLF) will continue to be applied. Based on the international experience, the central bank is likely to control the short-term interest rate and let the market determine the yield curve. Thus, we predict that more short-term liquidity tools (such as SLF and 7-day pledged repo rates) might be implemented as against the medium-term or long-term tools (such as MLF).
Contrast with the prudent monetary policy, pro-growth fiscal policy initiatives have to be deployed to sustain growth throughout the year. Although the authorities announced a conservative fiscal budget deficit of -3.0% (compared with our -3.5% prediction) for 2018, we believe that the final deficit will be larger if we take into account adjustments for some extra-budget items.
To correspond to the recent US large-scale tax cuts, the authorities seemingly aspire to cut tax accordingly, such as lowering payroll tax, etc. The influences of US tax cuts might trigger capital outflow and repatriation of profits to the US, also, it will strengthen the USD and put the depreciation pressure on RMB. Thus, we believe the corresponding tax cut in China is not avoidable.
China will enter “Great Moderation” period in the long term
We attempt to gauge China’s potential GDP till 2035 using traditional Cobb-Douglas production function by forecasting total factor productivity (A), labor (L) and capital formation (K). In our model, we set the capital share at 34% while the labor share is 66%. We calculate the potential output according to the formula
Monetary and fiscal policy outlook
A combination of a prudent monetary policy with tightening bias and a fiscal easing is predicted to be the main framework of the macro policy in 2018. A prudent monetary policy is consistent with the authorities’ emphasis on maintaining financial stability and curtailing the rising risks in housing bubbles, debt overhang and shadow banking activities. At the same time, more regulations on shadow banking and the property sector are expected to be unveiled on top of those in place, which could lead to an additional tightening of credit conditions and weigh on growth.
Corresponding to the US interest rate hike in 2018, we do not think the PBoC will follow to increase the benchmark lending rate and deposit rate. This is because the current RMB exchange rate and low inflation environment do not urgently require an interest rate hike. Moreover, as the financial deleveraging is continuing, the market interest rate has a tendency to be high, which lowers the urgent need for interest rate hike in China. On the other hand, considering the capital flight risk due to the US interest rate hike, as China still has a closed capital account, the authorities could apply various regulatory measures to control capital outflows.
Under the framework of monetary policy tightening, some unconventional monetary instruments will also be implemented, in order to maintain liquidity in the banking sector. For instance, Standing Lending Facilities (SLF) and Medium-term Lending Facilities (MLF) will continue to be applied. Based on the international experience, the central bank is likely to control the short-term interest rate and let the market determine the yield curve. Thus, we predict that more short-term liquidity tools (such as SLF and 7-day pledged repo rates) might be implemented as against the medium-term or long-term tools (such as MLF).
Contrast with the prudent monetary policy, pro-growth fiscal policy initiatives have to be deployed to sustain growth throughout the year. Although the authorities announced a conservative fiscal budget deficit of -3.0% (compared with our -3.5% prediction) for 2018, we believe that the final deficit will be larger if we take into account adjustments for some extra-budget items.
To correspond to the recent US large-scale tax cuts, the authorities seemingly aspire to cut tax accordingly, such as lowering payroll tax, etc. The influences of US tax cuts might trigger capital outflow and repatriation of profits to the US, also, it will strengthen the USD and put the depreciation pressure on RMB. Thus, we believe the corresponding tax cut in China is not avoidable.
China will enter “Great Moderation” period in the long term
We attempt to gauge China’s potential GDP till 2035 using traditional Cobb-Douglas production function by forecasting total factor productivity (A), labor (L) and capital formation (K). In our model, we set the capital share at 34% while the labor share is 66%. We calculate the potential output according to the formula
