Wu Qiong, Ye Bingnan and Steve Wang: RMB Factor in FX & Rates Markets
2017-04-14 IMI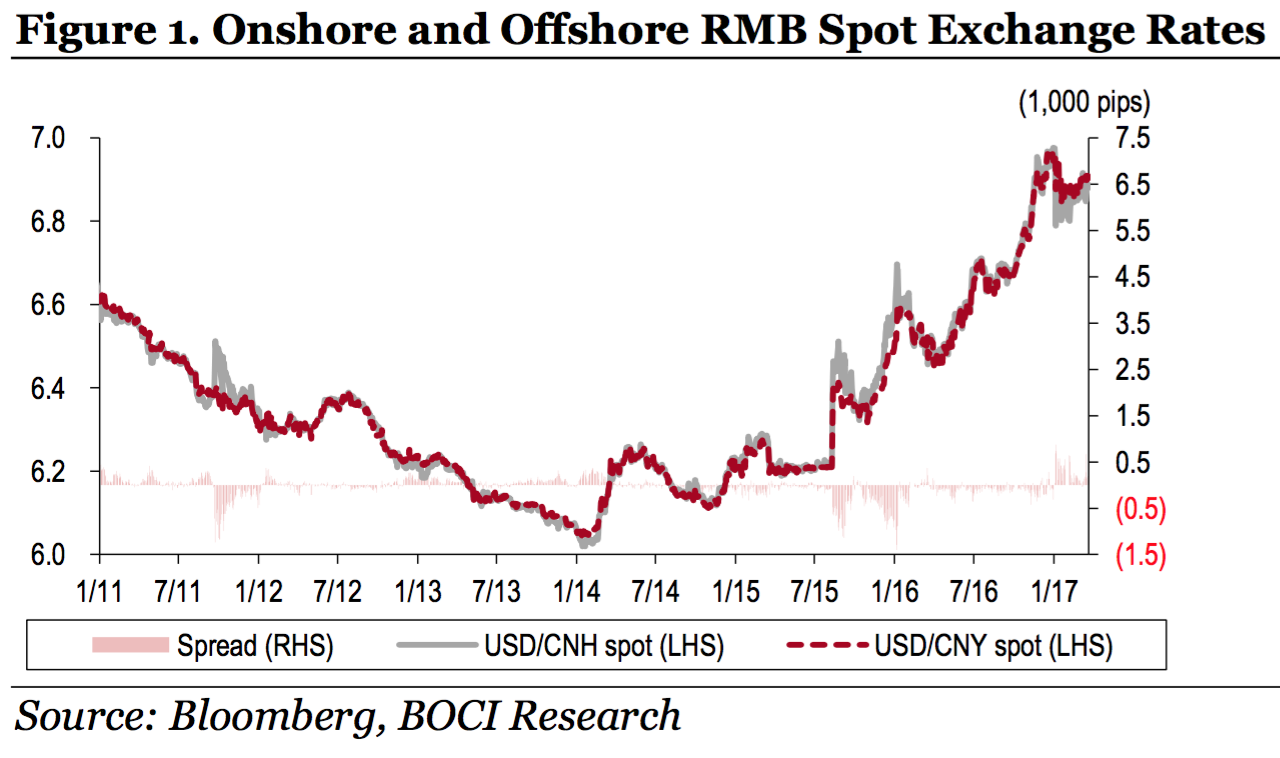 More Stability since New Year
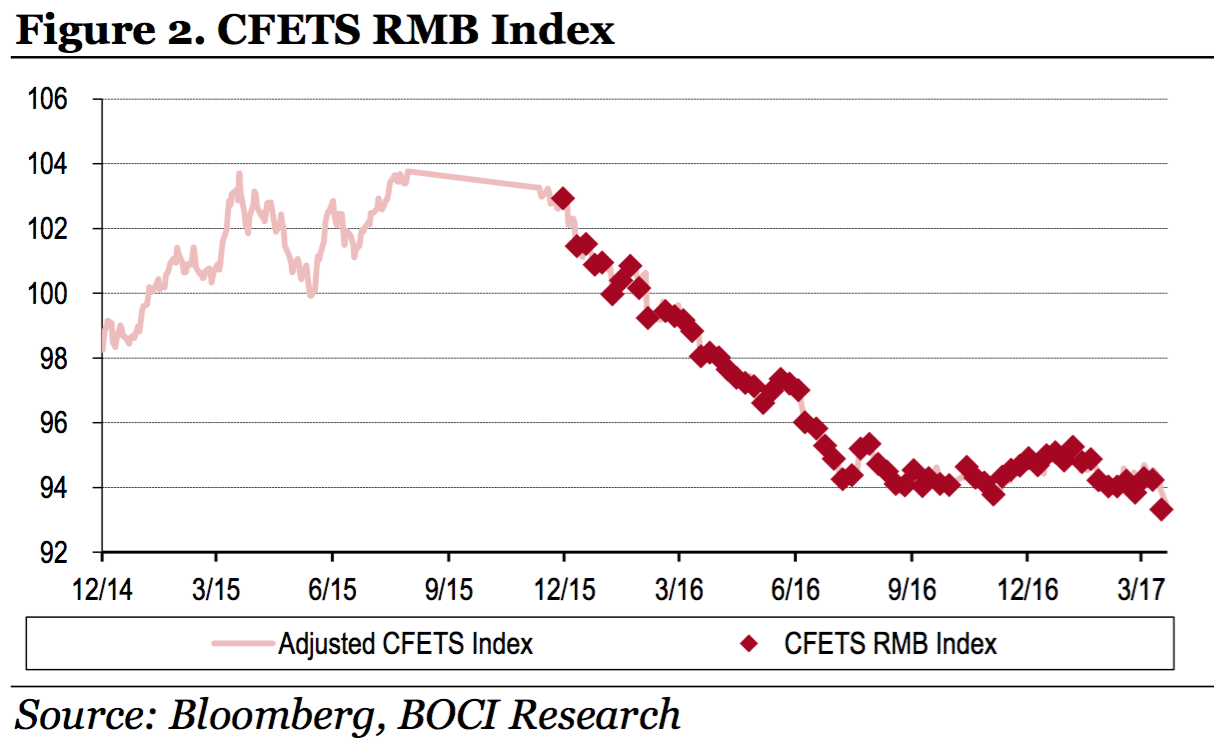
RMB stabilises since New Year. The USD index eased off from its December peak in January but regained some ground in Februarybefore retreating in March. The index touched the 99.51 low at end- January before stepping back to above102 at the beginning of March. After the Fed raised its benchmark rate, the dollar bull is taking a breather with the dollar index falling below 100 recently. Against such a backdrop, RMB spot rebounded in early January and then traded fairly steadily afterwards despite the recent USD swings, with the current trading level at 6.88 (vs. 6.945 at end-2016). At the same time, the CFETS RMB basket index has been largely range-bound since the middle of last year, ranging from 93.32 to 95.32 (see Figure 2), reflecting good stability against a basket of major currencies (currently at 24), a goal China has been promoting. If the introduction of the CFETS RMB index in late 2015 could be viewed as a policy move to focus on RMB’s link to a currency basket, it has allowed the RMB to price more independently from the USD and to secure more stability.
More Stability since New Year
RMB stabilises since New Year. The USD index eased off from its December peak in January but regained some ground in Februarybefore retreating in March. The index touched the 99.51 low at end- January before stepping back to above102 at the beginning of March. After the Fed raised its benchmark rate, the dollar bull is taking a breather with the dollar index falling below 100 recently. Against such a backdrop, RMB spot rebounded in early January and then traded fairly steadily afterwards despite the recent USD swings, with the current trading level at 6.88 (vs. 6.945 at end-2016). At the same time, the CFETS RMB basket index has been largely range-bound since the middle of last year, ranging from 93.32 to 95.32 (see Figure 2), reflecting good stability against a basket of major currencies (currently at 24), a goal China has been promoting. If the introduction of the CFETS RMB index in late 2015 could be viewed as a policy move to focus on RMB’s link to a currency basket, it has allowed the RMB to price more independently from the USD and to secure more stability.
 Latest market signals show expectations of further RMB weakness abated. The Bloomberg composite forecast on 4Q17 USD/CNY rate has fallen to the 7.09 level from 7.17 at the beginning of this year, as many economists now see less RMB declines by the end of 2017. The offshore CNH has been trading more expensively vs. the onshore CNY for most of the times since 2017, while the price gap between offshore CNH and onshore CNY has narrowed down to 100pips from as wide as nearly 900pips in January. However, due to a tightened offshore RMB liquidity, the offshore CNH is no longer viewed as a strong indicator for RMB’s direction.
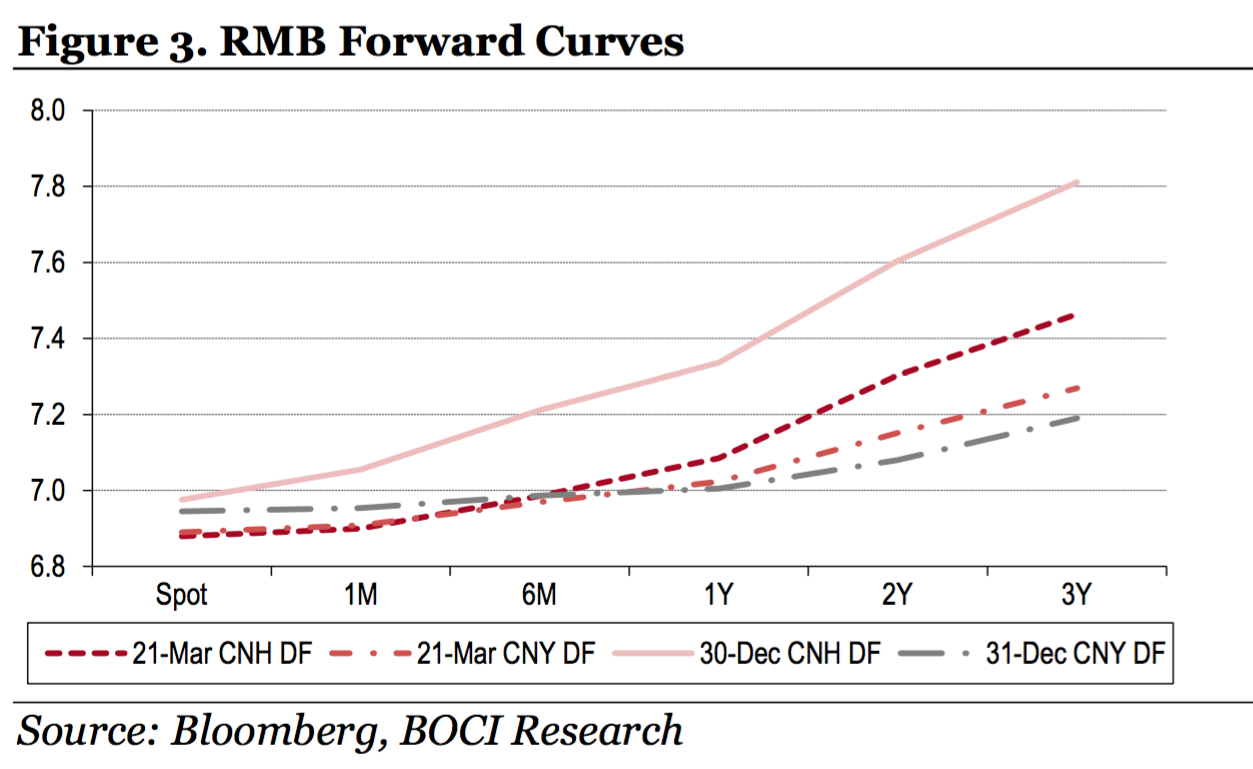
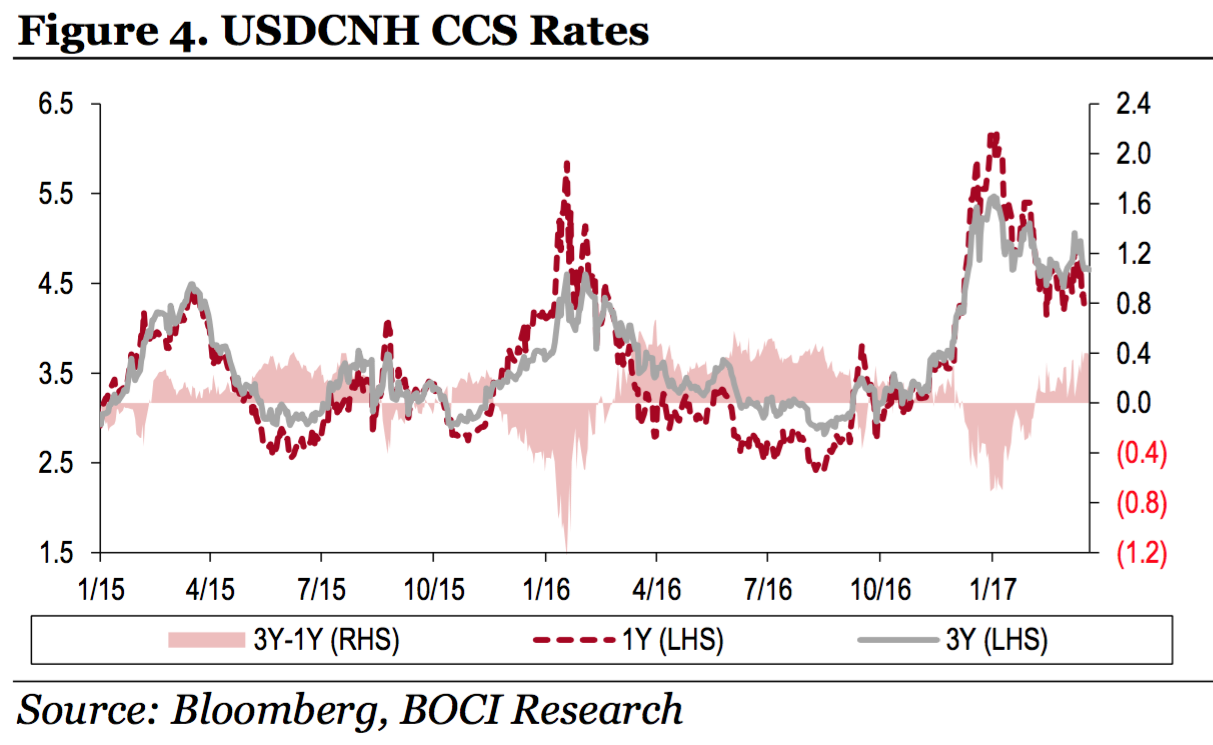
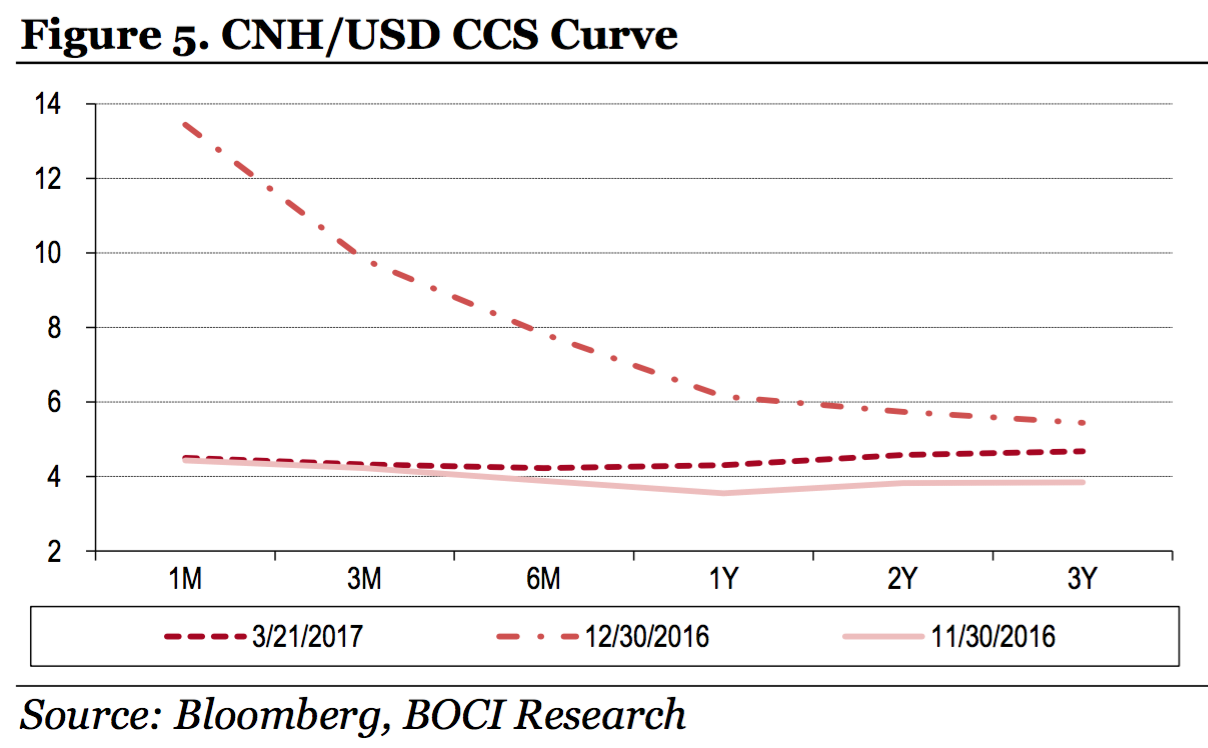
In the forward markets, the CNH forward curve has moved downwards and flattened significantly in 2017, as the long end has dropped the most (see Figure 3). In contrast, the CNY forward curve steepened slightly as the spot declined since the beginning of the year. CCS rates fell across the board and the CCS curve became no longer inverted, with the CCS rates returning to near the levels seen in November last year (see Figures 4 and 5).
Latest market signals show expectations of further RMB weakness abated. The Bloomberg composite forecast on 4Q17 USD/CNY rate has fallen to the 7.09 level from 7.17 at the beginning of this year, as many economists now see less RMB declines by the end of 2017. The offshore CNH has been trading more expensively vs. the onshore CNY for most of the times since 2017, while the price gap between offshore CNH and onshore CNY has narrowed down to 100pips from as wide as nearly 900pips in January. However, due to a tightened offshore RMB liquidity, the offshore CNH is no longer viewed as a strong indicator for RMB’s direction.
In the forward markets, the CNH forward curve has moved downwards and flattened significantly in 2017, as the long end has dropped the most (see Figure 3). In contrast, the CNY forward curve steepened slightly as the spot declined since the beginning of the year. CCS rates fell across the board and the CCS curve became no longer inverted, with the CCS rates returning to near the levels seen in November last year (see Figures 4 and 5).
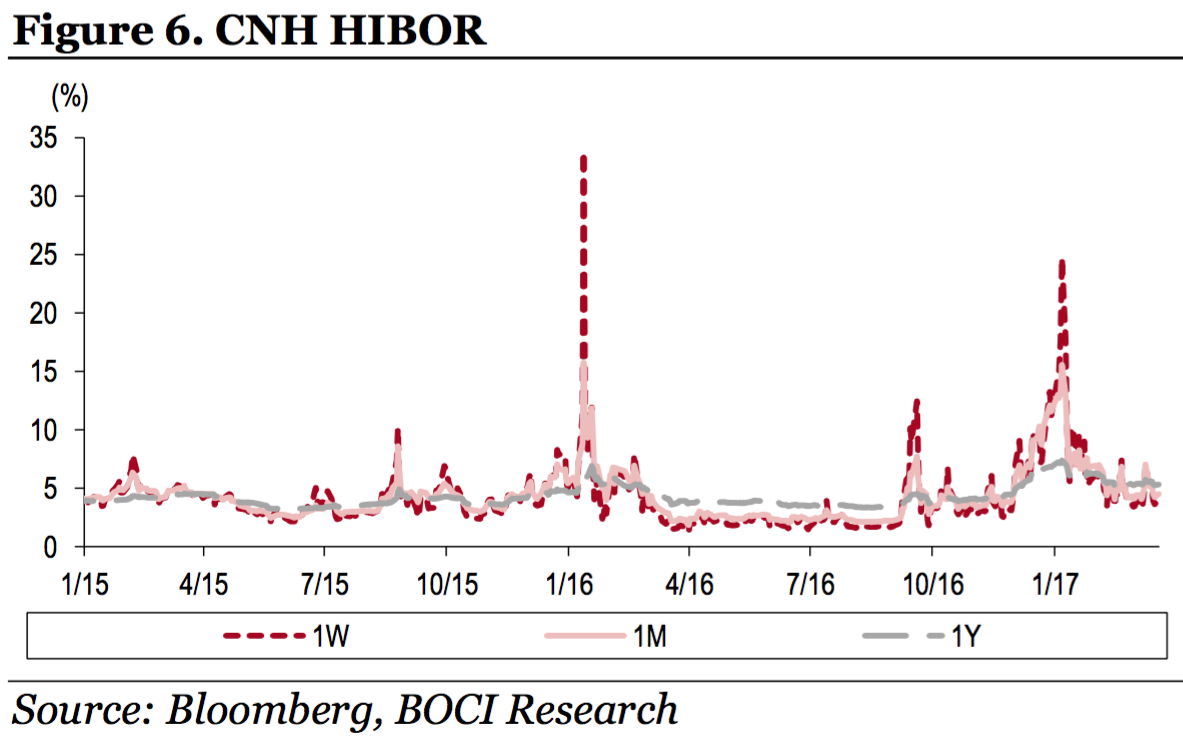
 Tightened offshore RMB liquidity also eased. After tightening up dramatically at the beginning of the year, the money market rates have now fallen back to a normal level. On 9 January, the CNH HIBOR overnight rate and the 7-day CNH HIBOR once surged to 61.33% and 24.73%, respectively, but then fell back quickly to normal levels in mid-January and now trade at c.2.3% and 4.4%, respectively (Figure 6).
 China’s capital outflows have recently slowed significantly. The long slide of China’s forex reserves has ended in March after falling below the US$3trn level in January for the first time in nearly six years. The reserve level rose back to above US$3trnlast month.
Since the start of 2017, China’s capital outflow pressure has eased off significantly. Among a number of signs, firstly, the demand for bank FX settlement has picked up, while the demand for bank FX sale has weakened. In January-February, banks recorded net sales of US$29.3bn worth of FX, down 63% compared to the November-December period and down 67% YoY. Secondly, the balance of cross-border overseas FX financing continued to grow and the total amount of FX loans incurred by onshore enterprises continued to decline, resulting in a decreased non-banking sector’s FX payout deficit. In January-February, non-banking sector’s net foreign-related payment decreased to US$7.8bn, down 78% compared to the November-December period and down 91% YoY.
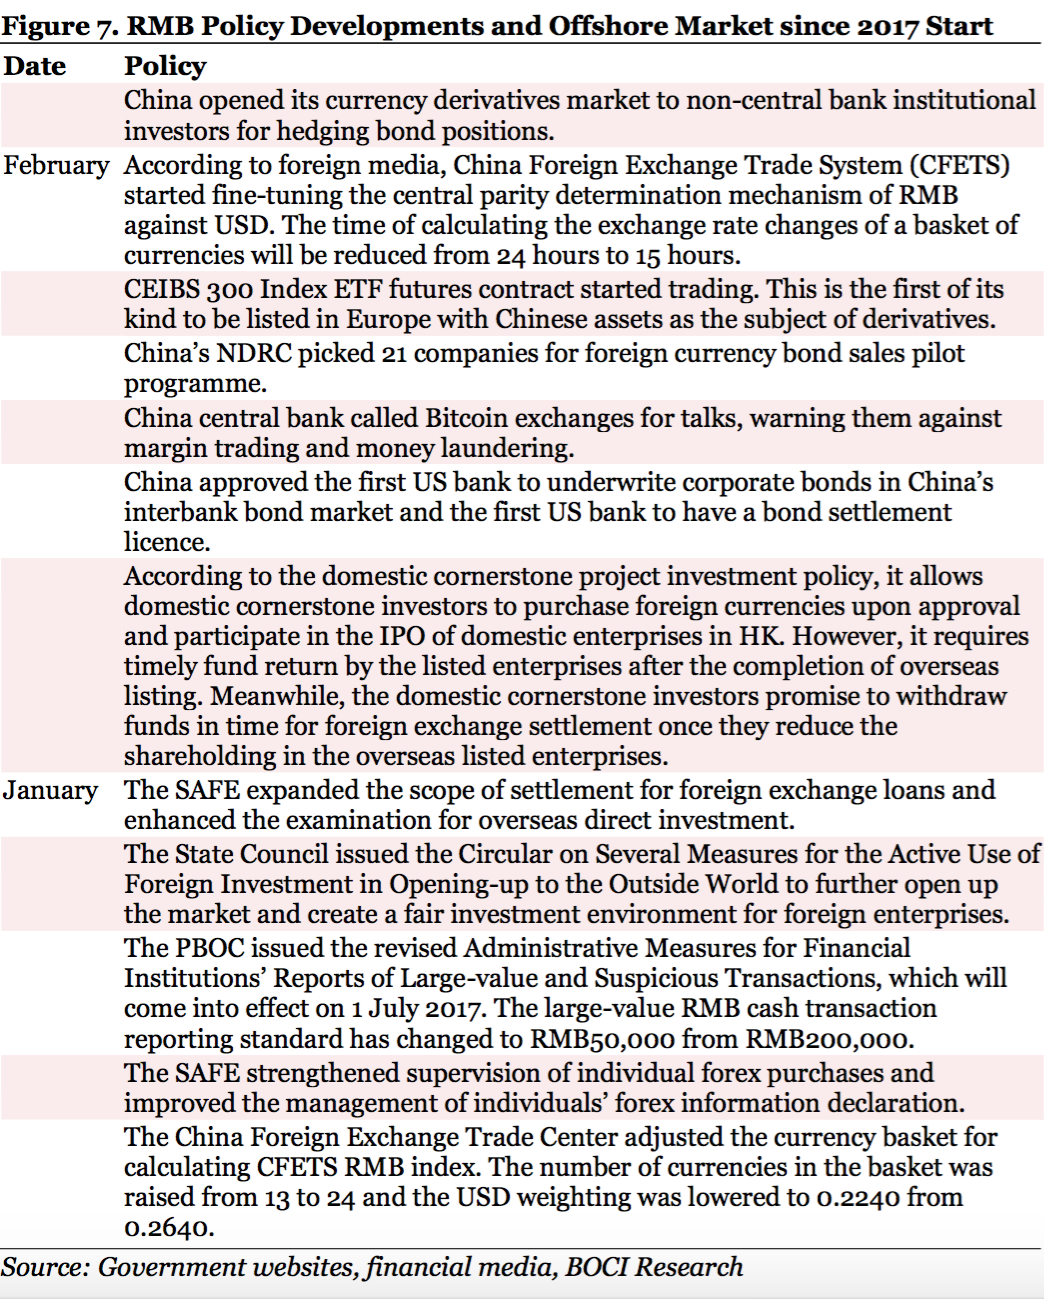
The more balanced FX supply/demand was supported by multiple factors. The latest economic indicators demonstrate that China’s economy has stabilised, and market expectations of further RMB depreciation have thus eased. Meanwhile, as the PBOC shifts to a prudent and neutral monetary policy position, money market rates have edged higher. The higher rates have also helped to alleviate the downward pressure on RMB from the rising US rates. In addition, Chinese regulators have stepped up scrutiny on RMB cross-border payments and foreign direct investments from both individuals and enterprises, mainly targeting money laundering and illicit outbound investment transactions (Figure 7). On the other hand, new policy measures that encourage inflows of foreign capital and the relaxation of cross-border financing restrictions have been conducive to balance out the cross-border capital outflows.
China’s capital outflows have recently slowed significantly. The long slide of China’s forex reserves has ended in March after falling below the US$3trn level in January for the first time in nearly six years. The reserve level rose back to above US$3trnlast month.
Since the start of 2017, China’s capital outflow pressure has eased off significantly. Among a number of signs, firstly, the demand for bank FX settlement has picked up, while the demand for bank FX sale has weakened. In January-February, banks recorded net sales of US$29.3bn worth of FX, down 63% compared to the November-December period and down 67% YoY. Secondly, the balance of cross-border overseas FX financing continued to grow and the total amount of FX loans incurred by onshore enterprises continued to decline, resulting in a decreased non-banking sector’s FX payout deficit. In January-February, non-banking sector’s net foreign-related payment decreased to US$7.8bn, down 78% compared to the November-December period and down 91% YoY.
The more balanced FX supply/demand was supported by multiple factors. The latest economic indicators demonstrate that China’s economy has stabilised, and market expectations of further RMB depreciation have thus eased. Meanwhile, as the PBOC shifts to a prudent and neutral monetary policy position, money market rates have edged higher. The higher rates have also helped to alleviate the downward pressure on RMB from the rising US rates. In addition, Chinese regulators have stepped up scrutiny on RMB cross-border payments and foreign direct investments from both individuals and enterprises, mainly targeting money laundering and illicit outbound investment transactions (Figure 7). On the other hand, new policy measures that encourage inflows of foreign capital and the relaxation of cross-border financing restrictions have been conducive to balance out the cross-border capital outflows.
 2017 RMB Outlook
Looking ahead, we believe RMB is likely to be largely stable in 2017, although periods of modest depreciation (possibly in 2H17) due to global and local factors may arise at times. China’s recently-displayed economic stability will continue to offer support to the currency. On the monetary policy front, China would maintain an independent monetary policy primarily driven by its own economic objectives. It is widely expected that the Fed will raise short-term interest rates for three times in total this year; we also see modest pressure on PBOC to tighten up monetary policies this year through targeted channels but not straight-forward policy rate hikes.
On the other hand, the PBOC’s recent policy stance shift from “slightly loose” to “prudent and neutral” has pushed money market rates higher, which has also helped to ease the pressure from narrowed interest rate differentials due to the Fed hikes. At the recent NPC meeting, policymakers reaffirmed its policy stance to control risks arising from the housing market and the fast-expanding credits. We believe the central bank may mildly tighten liquidity conditions to curb the fast credit expansion, which could further push up money market rates.
Externally, the USD bull, in our view, has largely priced in the coming rate hikes and would need Trump’s fiscal stimulus promise to materialise before further upping the bets. Without that, there would be less fuel available to drive the dollar higher further, let alone the possible implementation of a “USD weakening policy” by the Trump administration for an export edge. With Trump’s fiscal stimulus packages still in the air, judging from the lack of details in his recent State of the Union speech to the congress, we expect to see bumps in the dollar’s path to higher ground.
China’s Rates Markets
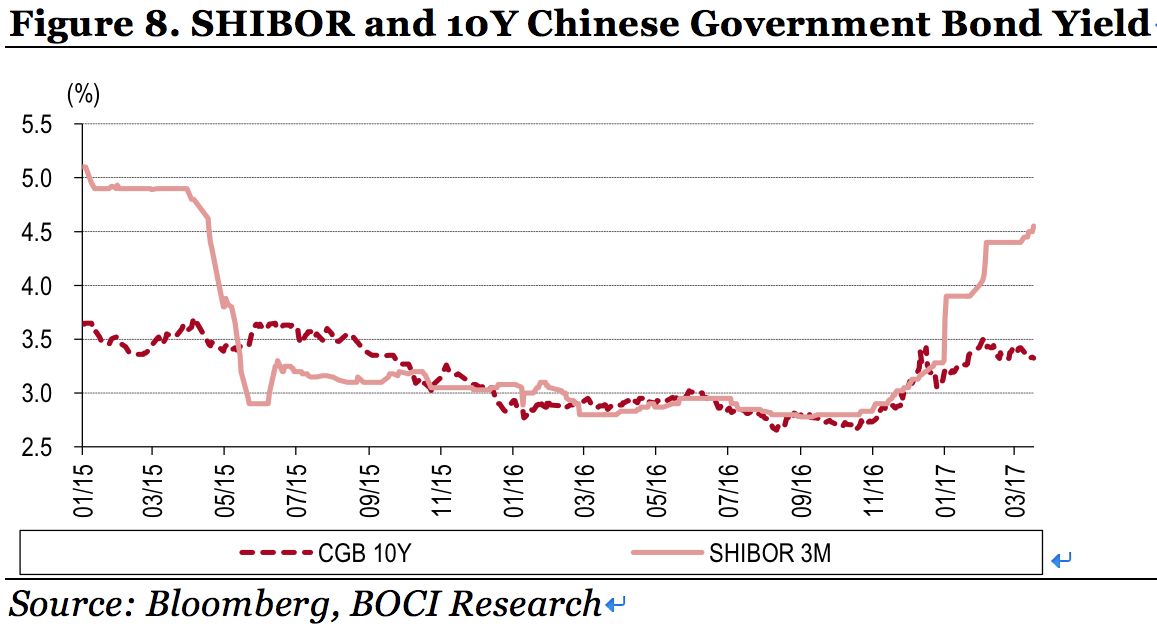
We expect China’s money market rates to move higher from the low levels seen in 2015 and 2016, but at a relatively slow pace. Both SHIBOR and bond yields have risen to close to theirend-2014 levels (Figure8) and could rise further in the near term. However, we may see some recovery during 2H17. We see the 10-year Chinese government bonds (CGB) range trading between 2.9% and 3.6% in the year.
2017 RMB Outlook
Looking ahead, we believe RMB is likely to be largely stable in 2017, although periods of modest depreciation (possibly in 2H17) due to global and local factors may arise at times. China’s recently-displayed economic stability will continue to offer support to the currency. On the monetary policy front, China would maintain an independent monetary policy primarily driven by its own economic objectives. It is widely expected that the Fed will raise short-term interest rates for three times in total this year; we also see modest pressure on PBOC to tighten up monetary policies this year through targeted channels but not straight-forward policy rate hikes.
On the other hand, the PBOC’s recent policy stance shift from “slightly loose” to “prudent and neutral” has pushed money market rates higher, which has also helped to ease the pressure from narrowed interest rate differentials due to the Fed hikes. At the recent NPC meeting, policymakers reaffirmed its policy stance to control risks arising from the housing market and the fast-expanding credits. We believe the central bank may mildly tighten liquidity conditions to curb the fast credit expansion, which could further push up money market rates.
Externally, the USD bull, in our view, has largely priced in the coming rate hikes and would need Trump’s fiscal stimulus promise to materialise before further upping the bets. Without that, there would be less fuel available to drive the dollar higher further, let alone the possible implementation of a “USD weakening policy” by the Trump administration for an export edge. With Trump’s fiscal stimulus packages still in the air, judging from the lack of details in his recent State of the Union speech to the congress, we expect to see bumps in the dollar’s path to higher ground.
China’s Rates Markets
We expect China’s money market rates to move higher from the low levels seen in 2015 and 2016, but at a relatively slow pace. Both SHIBOR and bond yields have risen to close to theirend-2014 levels (Figure8) and could rise further in the near term. However, we may see some recovery during 2H17. We see the 10-year Chinese government bonds (CGB) range trading between 2.9% and 3.6% in the year.
 Apart from external factors, we look into the domestic factors that will affect the bond yields, such as economic fundamentals, government policies, liquidity, valuation and asset allocation.
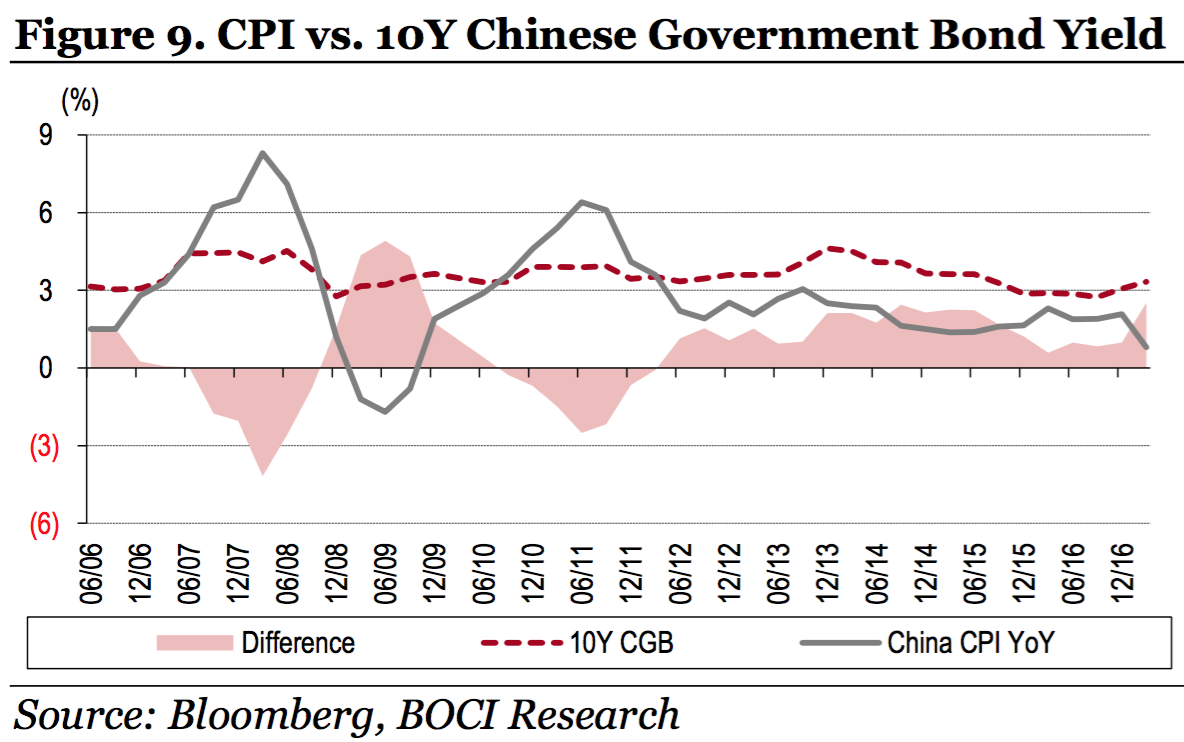
Fundamentally, the Chinese economy has shown some stability recently and may have a chance to improve further from here. The improved economic condition supports stable or higher rates. In fact, with this short-term economic recovery momentum and a low base factor, we see upside risk to the inflation expectation in 1H17. GDP growth and inflation levels may experience a “1H high and 2H low” pattern in 2017. Historical data shows that, when CPI is above 2%, the 10-year bond yield can hardly be lower than 3%. The Chinese CPI had been in the range of 2.1-2.5% since last October before dipping to 0.8% in February.
Apart from external factors, we look into the domestic factors that will affect the bond yields, such as economic fundamentals, government policies, liquidity, valuation and asset allocation.
Fundamentally, the Chinese economy has shown some stability recently and may have a chance to improve further from here. The improved economic condition supports stable or higher rates. In fact, with this short-term economic recovery momentum and a low base factor, we see upside risk to the inflation expectation in 1H17. GDP growth and inflation levels may experience a “1H high and 2H low” pattern in 2017. Historical data shows that, when CPI is above 2%, the 10-year bond yield can hardly be lower than 3%. The Chinese CPI had been in the range of 2.1-2.5% since last October before dipping to 0.8% in February.
 On the policy front, policymakers will continue to pursue a prudent & neutral monetary policy this year, and the central bank will likely continue to use liquidity tools to manage interbank liquidity and base-money supply. Overall, we are more likely to see a tightening of the monetary policy than a loosening one.
On market liquidity, we expect the liquidity situation to remain largely stable despite some monetary tightening operations. Nevertheless, money market interest rates (repo, SHIBOR, IRS) have already risen, which also pushes the interbank NCD rates and yields of wealth management products higher.
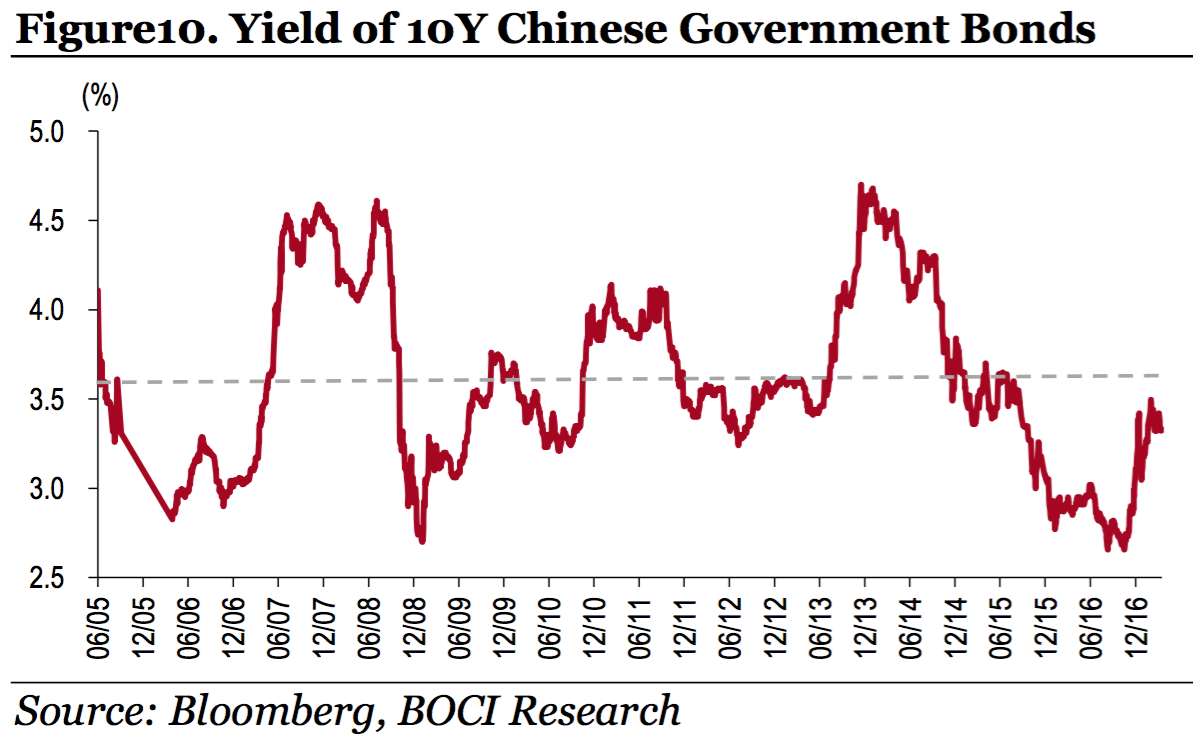
Valuation-wise, the current yield of 10-year Chinese government bonds is still lower than the historical average of 3.58% over the past 10 years (Figure10). We see a possibility for the yield to return to the level of historical average during 2017.
Finally, higher government bond yields could garner more demand from Chinese banks. Given the current benchmark lending rate at 4.35% and deposit rate at 1.5%, government bonds would become quite attractive to banks if the 10-year yield breaks above 3.5, and Chinese banks could start to allocate more assets to government bonds when the bond yields continue to climb.
On the policy front, policymakers will continue to pursue a prudent & neutral monetary policy this year, and the central bank will likely continue to use liquidity tools to manage interbank liquidity and base-money supply. Overall, we are more likely to see a tightening of the monetary policy than a loosening one.
On market liquidity, we expect the liquidity situation to remain largely stable despite some monetary tightening operations. Nevertheless, money market interest rates (repo, SHIBOR, IRS) have already risen, which also pushes the interbank NCD rates and yields of wealth management products higher.
Valuation-wise, the current yield of 10-year Chinese government bonds is still lower than the historical average of 3.58% over the past 10 years (Figure10). We see a possibility for the yield to return to the level of historical average during 2017.
Finally, higher government bond yields could garner more demand from Chinese banks. Given the current benchmark lending rate at 4.35% and deposit rate at 1.5%, government bonds would become quite attractive to banks if the 10-year yield breaks above 3.5, and Chinese banks could start to allocate more assets to government bonds when the bond yields continue to climb.
 Disclaimer: This article is for information only and does not constitute investment advice. Neither BOCI Macro and Strategy Research nor the authors themselves are responsible for any losses.
