Hong Hao: Asian Power-Market Has Reached a Historic Pivot, China Is Set to Outperform
2020-04-20 IMI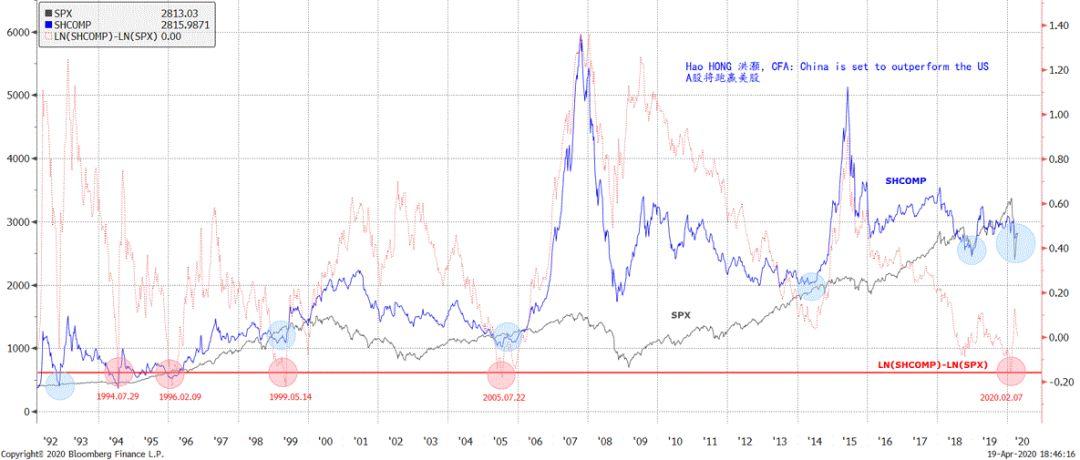 Source: Bloomberg, BOCOM Int'l estimates
China is set to outperform. Some may dismiss this observation as technical coincidence without fundamental reasons. We beg to differ. The market is not stupid, and prices reflect all available information efficiently. At this critical juncture, the US hegemony is undergoing subtle but substantial change. As the Fed is engaged in monetary debauchery, the PBoC has been approaching the economic slowdown at a measured pace with caution. Globally, the US appears to be abandoning its multilateralism that has served itself and the global community so well, and emphasizing “the art of deal” with unilateralism. Meanwhile, China’s global influence continues to grow via its Belt and Road initiative. It is now a force to be reckoned with.
In the Politburo meeting that has just concluded, the mantra is now focusing on hedging the downside of the economic slowdown by continuing to push for factor reform. While details are yet to be announced, the direction is clear: land and labor, two important factors that determine future productivity growth, will be gradually liberalized and allocated by the market. The directives also emphasize the improvement of social welfare in the long run. In the near term, macro and monetary policy will be more proactive, fiscal deficit will be increased, more special-purpose bonds will be issued, and cuts of RRR, interest rate and increase of rediscount loans are coming. With improving fundamentals on the margin, ongoing market reform for the long run and prospects of monetary easing in the near term, China is set to outperform.
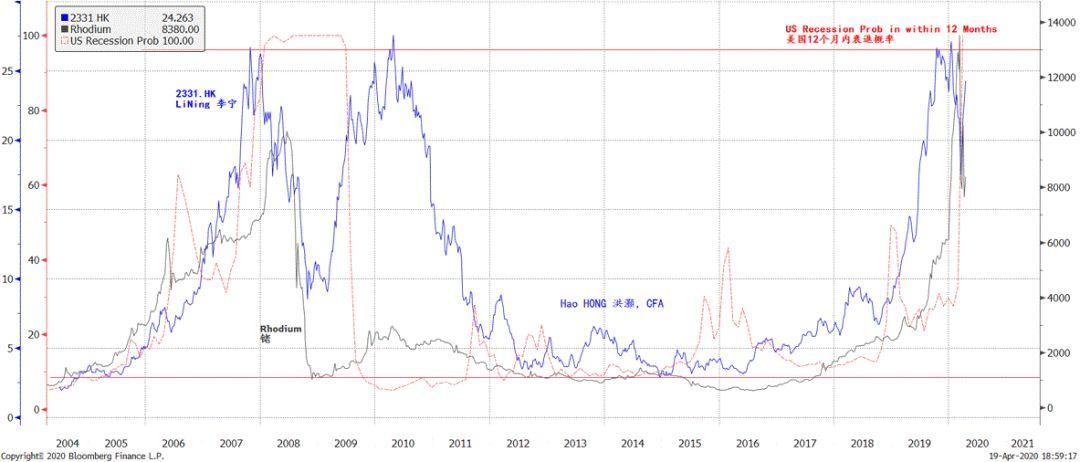
Eccentric indicators suggest a US recession. The consumer discretionary industry is particularly cyclically sensitive. Its sector performance tends to peak at or before the economic cycle peaks. And this time it is not different.
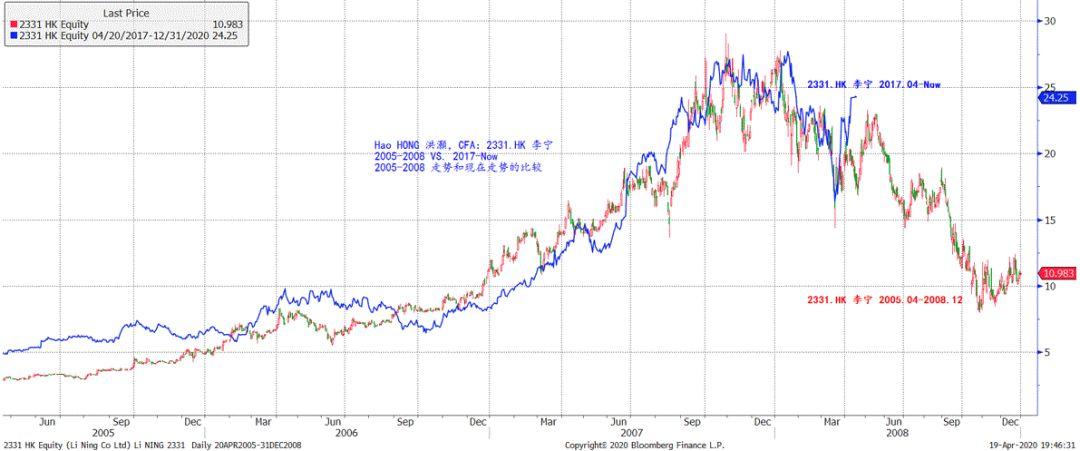
We note that since 2004, Li Ning (2331.HK) has been trading in a well-defined range, with consistent peaks and troughs. In the past two years, Li Ning has benefited from its successful restructuring, and has been one of the best performing stocks. That said, the stock has given back some of its stellar gains during the coronavirus outbreak, as the quarantine measures have hit demand for Li Ning’s sporting merchandises hard. The trend of Li Ning’s stock price in the current cycle bears strong resemblance of that during the cycle of 2005-2008. Meanwhile, the price of Rhodium, which tended to be cyclically sensitive and correlated closely with the stock price of Li Ning’s, has also peaked. Both indicators correlate closely with the probability of a US recession within twelve months (Figure 2 and 3). Such observations suggest strongly a US recession. Investors should take note.
Figure 2: Eccentric indicators suggest that the probability of a US recession within 12 months is very high.
Source: Bloomberg, BOCOM Int'l estimates
China is set to outperform. Some may dismiss this observation as technical coincidence without fundamental reasons. We beg to differ. The market is not stupid, and prices reflect all available information efficiently. At this critical juncture, the US hegemony is undergoing subtle but substantial change. As the Fed is engaged in monetary debauchery, the PBoC has been approaching the economic slowdown at a measured pace with caution. Globally, the US appears to be abandoning its multilateralism that has served itself and the global community so well, and emphasizing “the art of deal” with unilateralism. Meanwhile, China’s global influence continues to grow via its Belt and Road initiative. It is now a force to be reckoned with.
In the Politburo meeting that has just concluded, the mantra is now focusing on hedging the downside of the economic slowdown by continuing to push for factor reform. While details are yet to be announced, the direction is clear: land and labor, two important factors that determine future productivity growth, will be gradually liberalized and allocated by the market. The directives also emphasize the improvement of social welfare in the long run. In the near term, macro and monetary policy will be more proactive, fiscal deficit will be increased, more special-purpose bonds will be issued, and cuts of RRR, interest rate and increase of rediscount loans are coming. With improving fundamentals on the margin, ongoing market reform for the long run and prospects of monetary easing in the near term, China is set to outperform.
Eccentric indicators suggest a US recession. The consumer discretionary industry is particularly cyclically sensitive. Its sector performance tends to peak at or before the economic cycle peaks. And this time it is not different.
We note that since 2004, Li Ning (2331.HK) has been trading in a well-defined range, with consistent peaks and troughs. In the past two years, Li Ning has benefited from its successful restructuring, and has been one of the best performing stocks. That said, the stock has given back some of its stellar gains during the coronavirus outbreak, as the quarantine measures have hit demand for Li Ning’s sporting merchandises hard. The trend of Li Ning’s stock price in the current cycle bears strong resemblance of that during the cycle of 2005-2008. Meanwhile, the price of Rhodium, which tended to be cyclically sensitive and correlated closely with the stock price of Li Ning’s, has also peaked. Both indicators correlate closely with the probability of a US recession within twelve months (Figure 2 and 3). Such observations suggest strongly a US recession. Investors should take note.
Figure 2: Eccentric indicators suggest that the probability of a US recession within 12 months is very high.
 Source: Bloomberg, BOCOM Int'l estimates
Figure 3: LiNing (2331.HK) 2005-2008 vs 2017-Now
Source: Bloomberg, BOCOM Int'l estimates
Figure 3: LiNing (2331.HK) 2005-2008 vs 2017-Now
 Source: Bloomberg, BOCOM Int'l estimates
Further, the SHCOMP outperformed the SPX during the US recession in the early 1990’s and in early 2000’s. If the eccentric cyclical indicators suggest a US recession, they indeed embolden the case that the SHCOMP to outperform. That said, another form of relative performance could be for the SHCOMP to decline less than the SPX in a scenario of severe global recession. This form of relative performance appears to be more probable, with the SHCOMP outperforming the SPX since February, but still yields negative absolute return YTD.
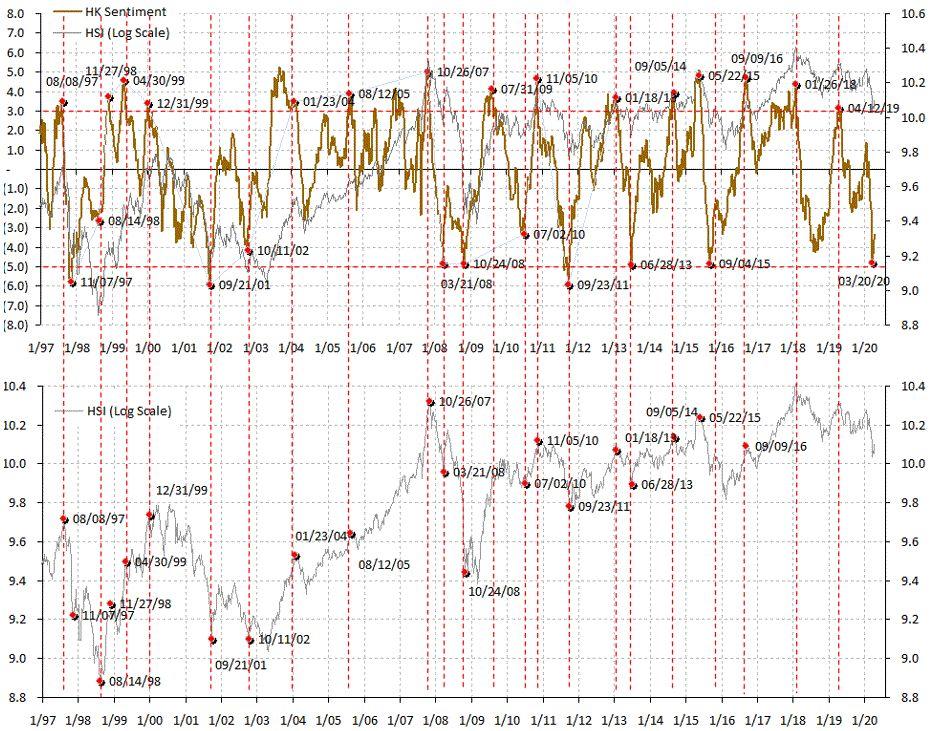
But market sentiment continues to heal from extreme pessimism, auguring well for a continuing technical rebound in the short term. Despite a strong technical rebound in the past two weeks, the market remains skeptical and cautious towards the outlook. As such, our quantitative model shows that market sentiment is healing from an extremely depressed level, yet still very pessimistic (Figure 4). Our model reached extreme pessimism around March 20, 2020, a level suggested strong technical rebound (please refer to our 20200324 pre-market report “The Fed Goes All In”, which called for a short-term technical bottom in the market.)
Figure 4: Market sentiment is healing from extreme pessimism. The technical rebound has not exhausted.
Source: Bloomberg, BOCOM Int'l estimates
Further, the SHCOMP outperformed the SPX during the US recession in the early 1990’s and in early 2000’s. If the eccentric cyclical indicators suggest a US recession, they indeed embolden the case that the SHCOMP to outperform. That said, another form of relative performance could be for the SHCOMP to decline less than the SPX in a scenario of severe global recession. This form of relative performance appears to be more probable, with the SHCOMP outperforming the SPX since February, but still yields negative absolute return YTD.
But market sentiment continues to heal from extreme pessimism, auguring well for a continuing technical rebound in the short term. Despite a strong technical rebound in the past two weeks, the market remains skeptical and cautious towards the outlook. As such, our quantitative model shows that market sentiment is healing from an extremely depressed level, yet still very pessimistic (Figure 4). Our model reached extreme pessimism around March 20, 2020, a level suggested strong technical rebound (please refer to our 20200324 pre-market report “The Fed Goes All In”, which called for a short-term technical bottom in the market.)
Figure 4: Market sentiment is healing from extreme pessimism. The technical rebound has not exhausted.
 Source: Bloomberg, BOCOM Int'l estimates
In our 20191110 report titled “Outlook 2020: Going the Distance”, we forecasted the most likely trading range of the SHCOMP in the following twelve months to be 2,700-3,200. We also forecasted that the US market will squeeze both bears and bulls in 2020. Now five months since the release of our outlook report, the SHCOMP has been trading between 2,646 and 3,127. Our trading range has worked very well, and we see no strong reason to update our index forecast. The trading plan should continue to be: when the SHCOMP trades towards the bottom end of the range, we should be more proactive; and vice versa.
Source: Bloomberg, BOCOM Int'l estimates
In our 20191110 report titled “Outlook 2020: Going the Distance”, we forecasted the most likely trading range of the SHCOMP in the following twelve months to be 2,700-3,200. We also forecasted that the US market will squeeze both bears and bulls in 2020. Now five months since the release of our outlook report, the SHCOMP has been trading between 2,646 and 3,127. Our trading range has worked very well, and we see no strong reason to update our index forecast. The trading plan should continue to be: when the SHCOMP trades towards the bottom end of the range, we should be more proactive; and vice versa.
