Hong Hao: The Next Decade: the Ebbing Waves
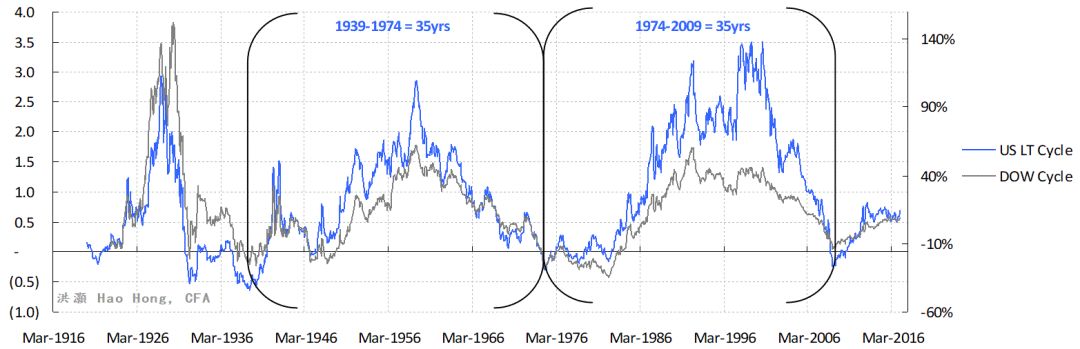
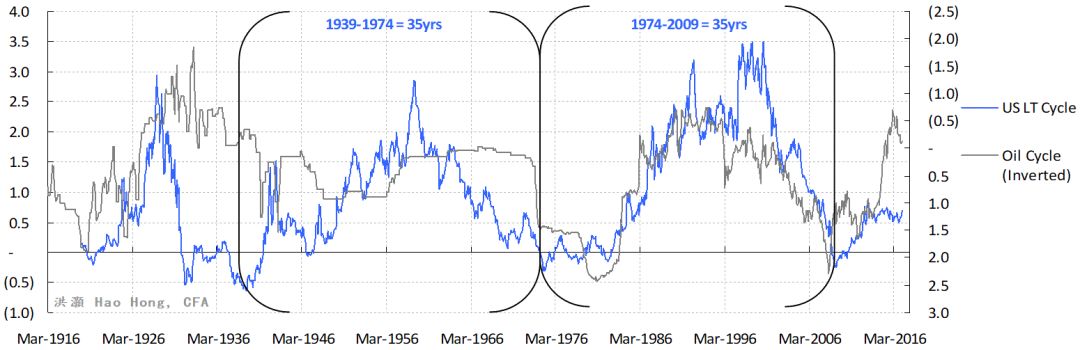
2020-01-07 IMI- Since the 1940’s, there have been two complete 35-year long waves, each consisting of around ten 3.5-year short cycles; or two 17.5-year intermediate waves each comprising five 3.5-year short cycles. The 70-year super long wave that originated in the 1940’s had ended around 2009. After ten years of expansion, around late 2020 to 1H2021, we will enter the declining phase in the first 17.5-year within the new 35-year long wave. Markets will be particularly tumultuous.
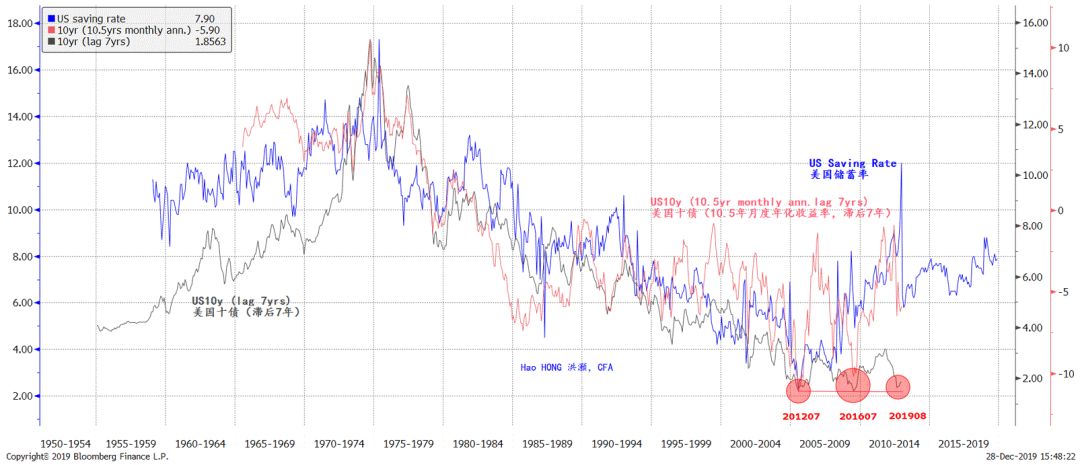
- The US saving rate correlates closely with US long yield with a 7-year lead. As the US saving rate is rising, US long yield should follow suit. Note that the US 10 year is at “generation low”, and has bottomed thrice in the summers of 2012, 2016 and 2019. Higher bond yield can be a trigger of surging market volatility in the future.
- Meanwhile, China’s working population as a percentage of the total has been declining since 2010, together with the saving and investment intensity. And the Chinese economy has gradually transformed into a consumption economy. As the pool of labor shrinks, wage must rise, together with income equality and inflation. China’s redefining the “principal contradiction” and the associated policies are helping to initiate these important structural changes. Further, to avoid falling into the middle-income trap, China must upgrade its industries and labor skills fast, as it may have passed the Lewis turning point. The accelerated “reform and opening” despite trade friction is timely.
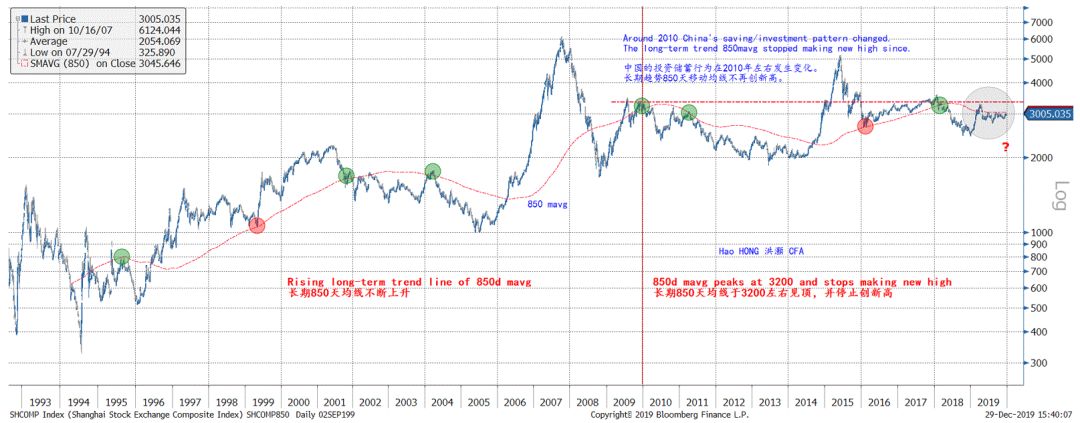
- China’s 850-day long-term trend has not made new high above 3200 since 2010. The trend is now tilted downwards. Without exogenous factors such as significant foreign inflows, trend reversal can be challenging. If China’s market has become a zero-sum game for Chinese traders profiting off each other, the investable companies worthy of large foreign inflow are indeed limited.
 Source: Bloomberg, BOCOM Int'l estimates
In this report, we would like to extend our theory about the short to intermediate economic cycle into the longer term. Intuitively, if our theory works in the short to intermediate term, and if “every cycle of higher order may be considered as the trend of the cycle of the next lower order”, as Schumpeter famously put it, our short and intermediate cycles should join into a conjuncture in which interplay of movements together makes up the direction of the economy.
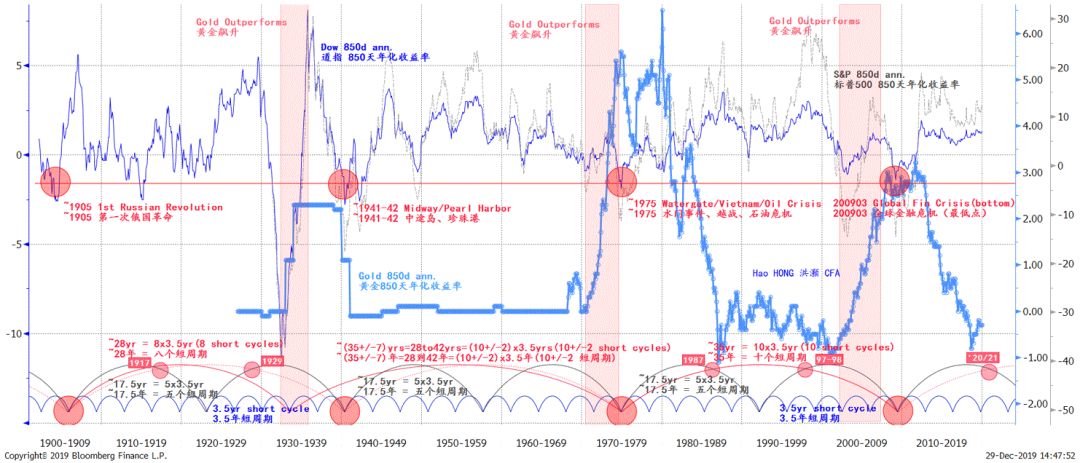
In Figure 1, we use long-term Dow Jones and Gold price series to demonstrate how the 3.5-year short cycles stack up into longer intermediate waves, and then into even longer waves. Note that we distinguish between long-term waves and short-term cycles. The term “cycle” implies recurrence and repetition, while “wave” suggests progression. And in the long run, the Dow Jones index has been a reflection of rising economic prosperity periodically punctured by wars, conflicts, crises and recessions.
We highlight a few prominent features in Figure 1:
Source: Bloomberg, BOCOM Int'l estimates
In this report, we would like to extend our theory about the short to intermediate economic cycle into the longer term. Intuitively, if our theory works in the short to intermediate term, and if “every cycle of higher order may be considered as the trend of the cycle of the next lower order”, as Schumpeter famously put it, our short and intermediate cycles should join into a conjuncture in which interplay of movements together makes up the direction of the economy.
In Figure 1, we use long-term Dow Jones and Gold price series to demonstrate how the 3.5-year short cycles stack up into longer intermediate waves, and then into even longer waves. Note that we distinguish between long-term waves and short-term cycles. The term “cycle” implies recurrence and repetition, while “wave” suggests progression. And in the long run, the Dow Jones index has been a reflection of rising economic prosperity periodically punctured by wars, conflicts, crises and recessions.
We highlight a few prominent features in Figure 1:
- We have used 850-day time span to measure the return patterns in the Dow. The inflection points in the long wave are identified as the lowest points in the return series calculation, except in 1932. (The four inflection points are highlighted in red circles on the red horizontal line)
- 70-year long wave = 2 x (35-year long wave) = 4 x (17.5-year intermediate wave) = 4 x (5 x 3.5-year short cycle) = 20 x (3.5-year short cycle); 17.5-year intermediate wave = 5 x (3.5-year short cycle). All time spans are approximated. Cycle is not clockworks. There are two complete 35-year long waves since 1900. If one instead considers 1932 as the inception of the first long wave, then the first wave will be merely extended by one cycle of ~7.5 years.
- The 70-year long wave initiated during WWII in the 1940’s had ended during the 2008-2009 global financial crisis. If so, we are unto the next long wave. During this initial rising phase within the new long wave, we have observed some developments fitting to the empirical evidences that Kondradieff discussed. For instance, Kondradieff wrote about “increasing gold production (money supply) and the enlarging world market by the assimilation of new countries”. Further, he said “during the period of the rise of the long waves, i.e., during the period of high tension in the expansion of economic forces, that, as a rule, the most disastrous and extensive wars and revolutions occurs”.
- Gold tends to fall in the rising phase of the first 17.5-year intermediate cycle within the 35-year long wave. It will then consolidate between the first and second 17.5-year intermediate cycles, before rising strongly in the second half, declining phase of the second 17.5-year cycle within the 35-year long wave (red shaded periods in Figure 1). Gold bottomed at ~1000 in late 2015, and is now at a consolidation phase. Gold is a good hedge against the downside risks during the final declining phase of the 35-year long wave.
- Late 2020 and the first half of 2021 is a critical point in time to monitor. Around this time, the 3.5-year short cycle and the first 17.5-year intermediate cycle will start to ebb simultaneously. As this instance of cyclical receding is a higher-order occurrence, i.e. the first 17.5-year intermediate cycle within a 35-year long wave, the market will be tumultuous. And we cannot rule out the possibility of a market crash similar to 1987, which happened at a similar cyclical phase with similar background. It could be the US presidential cycle, or a change in the US long bond yield – which we will discuss later.
 Source: Bloomberg, BOCOM Int'l estimates
In the US, our research suggests that the secular trend of the US saving rate tends to correlate very well with that of US long yield, with a significant lead of around 7 years, or a 7-year cycle (Figure 3). Precisely why falling savings rate corresponds to falling long yield is unclear. But early 1980 to 2009 is a period when the Japanese and then the Chinese made up for falling US saving by exporting to the US and accumulating significant current account surplus. They then recycled these surpluses into US treasury, suppressing the US long yield. Since 2009, however, the US saving rate has been rising, as US families and corporates have been endeavoring to save, deleverage and repair their balance sheets while the US government has been taking on more debt. Concurrently, the US long yield bottomed thrice in the summers of 2012, 2016 and 2019 (Figure 3). Meanwhile, China’s intensity of saving and investment had also been attenuating since around 2010 – a significant macroeconomic development we will discuss later.
2010: A watershed year in China
When we developed our China market forecasting model based on the long-term trend of 850-day moving average, we noticed a change in behavior in this long-term trend line before and after the year 2010.
Before 2010, the 850-day moving average has been rising, suggesting that the Chinese market was about sharing a growing economic pie. But after 2010, the 850-day moving average has become a converging average line around which the Shanghai Composite fluctuated. The 850-day average has peaked at 3200 and stopped making new highs, even with the bubble in 2015 when the Shanghai Composite surged above 5000. Further, the composite spent most of its time below the 850-day average after 2010 (Figure 4).
That is, since 2010, China’s stock market has become a zero-sum game in which traders try to make money off their trading counterparts, rather than investing in growing profits. For now, the Shanghai Composite is right beneath the 850-day moving average, suggesting that the composite once again is at a significant inflection point.
Figure 4: 2010 is a watershed year for China macro; and stock market has become a zero-sum game
Source: Bloomberg, BOCOM Int'l estimates
In the US, our research suggests that the secular trend of the US saving rate tends to correlate very well with that of US long yield, with a significant lead of around 7 years, or a 7-year cycle (Figure 3). Precisely why falling savings rate corresponds to falling long yield is unclear. But early 1980 to 2009 is a period when the Japanese and then the Chinese made up for falling US saving by exporting to the US and accumulating significant current account surplus. They then recycled these surpluses into US treasury, suppressing the US long yield. Since 2009, however, the US saving rate has been rising, as US families and corporates have been endeavoring to save, deleverage and repair their balance sheets while the US government has been taking on more debt. Concurrently, the US long yield bottomed thrice in the summers of 2012, 2016 and 2019 (Figure 3). Meanwhile, China’s intensity of saving and investment had also been attenuating since around 2010 – a significant macroeconomic development we will discuss later.
2010: A watershed year in China
When we developed our China market forecasting model based on the long-term trend of 850-day moving average, we noticed a change in behavior in this long-term trend line before and after the year 2010.
Before 2010, the 850-day moving average has been rising, suggesting that the Chinese market was about sharing a growing economic pie. But after 2010, the 850-day moving average has become a converging average line around which the Shanghai Composite fluctuated. The 850-day average has peaked at 3200 and stopped making new highs, even with the bubble in 2015 when the Shanghai Composite surged above 5000. Further, the composite spent most of its time below the 850-day average after 2010 (Figure 4).
That is, since 2010, China’s stock market has become a zero-sum game in which traders try to make money off their trading counterparts, rather than investing in growing profits. For now, the Shanghai Composite is right beneath the 850-day moving average, suggesting that the composite once again is at a significant inflection point.
Figure 4: 2010 is a watershed year for China macro; and stock market has become a zero-sum game
 Source: Bloomberg, BOCOM Int'l estimates
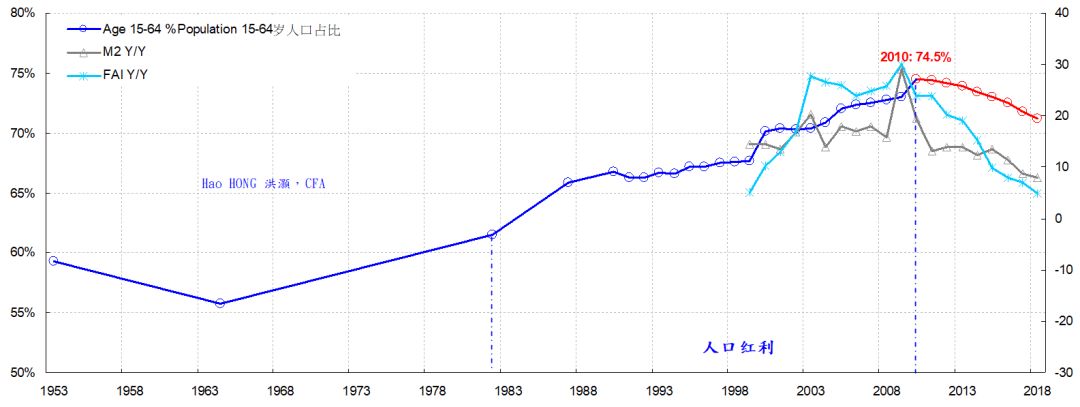
We believe the moderation in China’s saving and investment is a result of a more profound, and more secular macroeconomic change. Around 2010, China’s working population as a percentage of total population started to shrink. At about the same time, the country also arrived at its Lewis turning point at which the country’s surplus rural labor is fully absorbed into the manufacturing sector.
Aging population and the arrival of the Lewis turning point are a double whammy for China. It exacerbated the change in China’s saving and investment patterns. As shown in Figure 5, around the year 2010, China’s monetary supply and fixed asset investment have begun to decelerate rapidly, together with population aging.
Figure 5: China’s working population percentage began to shrink around 2010
Source: Bloomberg, BOCOM Int'l estimates
We believe the moderation in China’s saving and investment is a result of a more profound, and more secular macroeconomic change. Around 2010, China’s working population as a percentage of total population started to shrink. At about the same time, the country also arrived at its Lewis turning point at which the country’s surplus rural labor is fully absorbed into the manufacturing sector.
Aging population and the arrival of the Lewis turning point are a double whammy for China. It exacerbated the change in China’s saving and investment patterns. As shown in Figure 5, around the year 2010, China’s monetary supply and fixed asset investment have begun to decelerate rapidly, together with population aging.
Figure 5: China’s working population percentage began to shrink around 2010
 Source: BOCOM Int'l estimates
The consequences of the aging population are twofold. First, as the pool of labor shrinks, workers will demand higher wages and push up inflation. And improving income equality should be the second-order effect. Second, an aging population saves less and consumes more. This is reflected in falling Chinese saving rate and shrinking current account surplus as a percentage of GDP. Both have the potential to push up US long yield, if historically they have been the forces to depress it. The secular changes in China and in the US, and their effect on US long yield, are good candidates for triggering a market turmoil when the 17.5-year wave starts to recede between late 2020 and 1H2021, as forecasted by our long wave theory aforementioned.
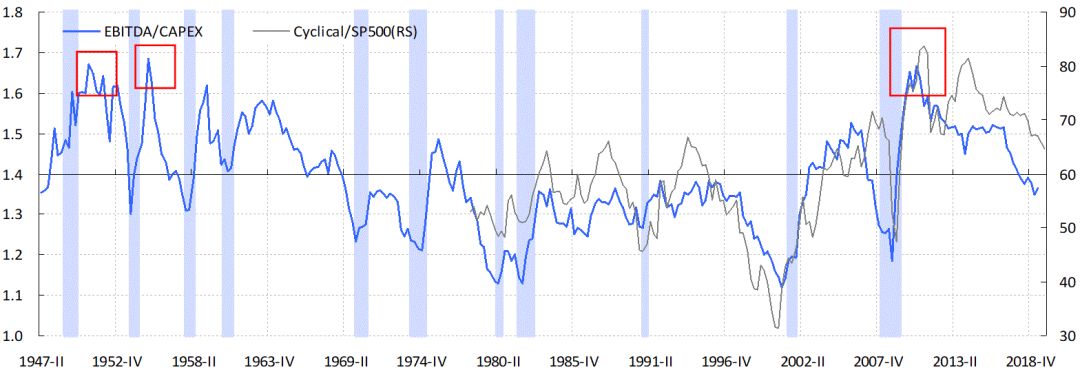
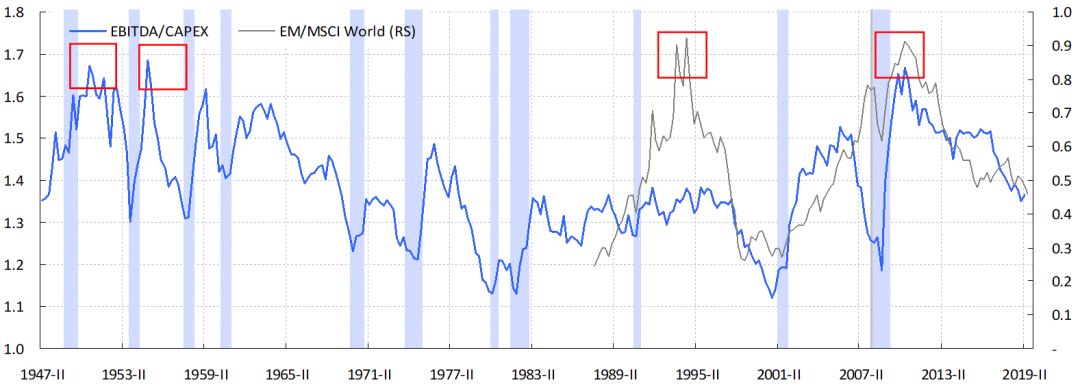
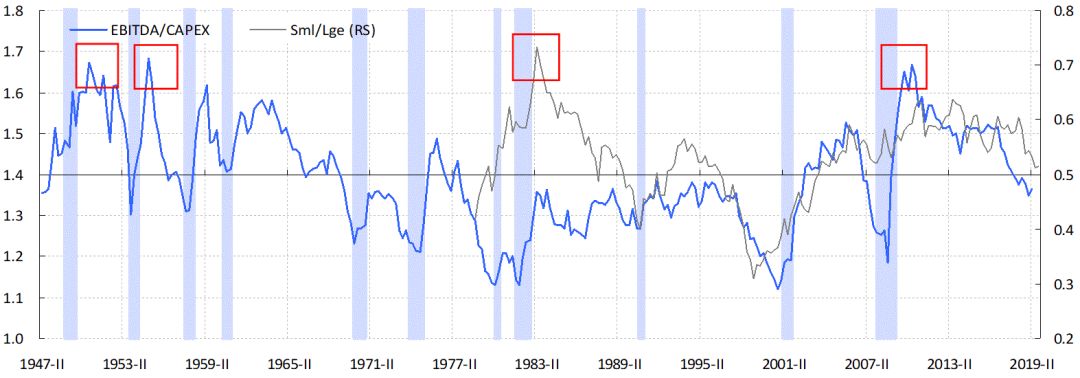
Globally, the year 2010 is also a watershed year. This is the year when US capex investment return peaked, and has been declining ever since. Since the 1940’s, this return has been correlating closely with small caps, EM, cyclicals, and the ROE of the Shanghai Composite. The relative return of all these assets have peaked in 2010 (Figure 6).
On my way to the closed-door discussion, my car negotiated its way through the ancient stone hutong into the Chang’an Avenue, from the Forbidden City that used to be the emblem of China’s imperial power when it was the center of the world, to the skyscrapers in Guomao standing as architectural tributes to China as a rising power on the global stage. The car ride is like hundreds of years of China’s past and future flashing in front of my windshield. Changes are happening, and they are fast, vertiginous and mesmerizing. At the decade’s end, no one could reckon exactly what the future holds. But we are at the front row. And we don't want to miss a thing.
Figure 6: The world’s investment return has been falling since peaking in 2010
Source: BOCOM Int'l estimates
The consequences of the aging population are twofold. First, as the pool of labor shrinks, workers will demand higher wages and push up inflation. And improving income equality should be the second-order effect. Second, an aging population saves less and consumes more. This is reflected in falling Chinese saving rate and shrinking current account surplus as a percentage of GDP. Both have the potential to push up US long yield, if historically they have been the forces to depress it. The secular changes in China and in the US, and their effect on US long yield, are good candidates for triggering a market turmoil when the 17.5-year wave starts to recede between late 2020 and 1H2021, as forecasted by our long wave theory aforementioned.
Globally, the year 2010 is also a watershed year. This is the year when US capex investment return peaked, and has been declining ever since. Since the 1940’s, this return has been correlating closely with small caps, EM, cyclicals, and the ROE of the Shanghai Composite. The relative return of all these assets have peaked in 2010 (Figure 6).
On my way to the closed-door discussion, my car negotiated its way through the ancient stone hutong into the Chang’an Avenue, from the Forbidden City that used to be the emblem of China’s imperial power when it was the center of the world, to the skyscrapers in Guomao standing as architectural tributes to China as a rising power on the global stage. The car ride is like hundreds of years of China’s past and future flashing in front of my windshield. Changes are happening, and they are fast, vertiginous and mesmerizing. At the decade’s end, no one could reckon exactly what the future holds. But we are at the front row. And we don't want to miss a thing.
Figure 6: The world’s investment return has been falling since peaking in 2010
 Source: Bloomberg, BOCOM Int'l estimates
