Steve H. Hanke: Wall Street Correction, Yes — Bubble, No
2018-03-05 IMI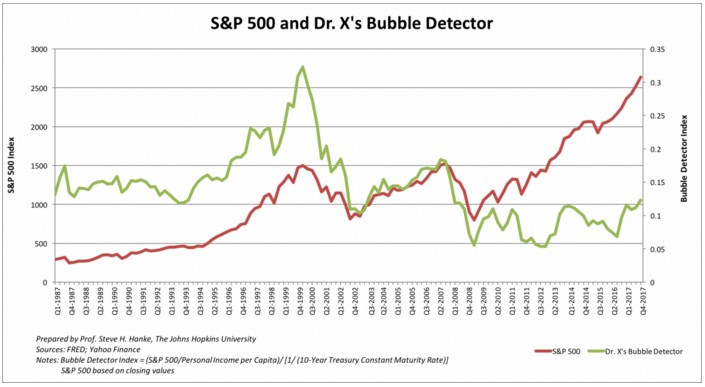 The bubble detector has averaged 0.1252 since January 2000. Before the early 2000s market crash, it peaked at 0.3229. Since then it has dropped as low as 0.05361 in September 2012. As of December, the bubble detector level is 0.0518/0.4219, or 0.1229.
The ongoing divergence since 2008 between the S&P 500 and Dr. X’s bubble detector is due to low bond yields caused by quantitative easing, resulting in a high wealth/income ratio of bonds. Therefore, the bubble detector remains at low levels. Conversely, prior to 1998, bond yields were “high”, resulting in a low wealth/income ratio for bonds, and therefore elevated levels of the bubble detector.
The current value is slightly below the average since 2000. This “low” value, depicted in the chart above, means that now is a relatively good time to buy $1 worth of stock earnings and not a good time to buy $1 worth of bond interest. In short, Dr. X’s bubble detector is not signaling a stock market bubble — far from it.
That said, it’s worth recounting the late 1920s. That’s when Yale Professor Irving Fisher, perhaps the greatest economist of his era, confidently proclaimed that stock prices were at a “permanently high plateau.” Fisher, then 62 and a man of strong convictions, staked his reputation and fortune on an unwavering optimism about the economy and stock prices. Alas, the 1929 crash vaporized Fisher’s $10 million fortune and cast a cloud over his reputation.
The bubble detector has averaged 0.1252 since January 2000. Before the early 2000s market crash, it peaked at 0.3229. Since then it has dropped as low as 0.05361 in September 2012. As of December, the bubble detector level is 0.0518/0.4219, or 0.1229.
The ongoing divergence since 2008 between the S&P 500 and Dr. X’s bubble detector is due to low bond yields caused by quantitative easing, resulting in a high wealth/income ratio of bonds. Therefore, the bubble detector remains at low levels. Conversely, prior to 1998, bond yields were “high”, resulting in a low wealth/income ratio for bonds, and therefore elevated levels of the bubble detector.
The current value is slightly below the average since 2000. This “low” value, depicted in the chart above, means that now is a relatively good time to buy $1 worth of stock earnings and not a good time to buy $1 worth of bond interest. In short, Dr. X’s bubble detector is not signaling a stock market bubble — far from it.
That said, it’s worth recounting the late 1920s. That’s when Yale Professor Irving Fisher, perhaps the greatest economist of his era, confidently proclaimed that stock prices were at a “permanently high plateau.” Fisher, then 62 and a man of strong convictions, staked his reputation and fortune on an unwavering optimism about the economy and stock prices. Alas, the 1929 crash vaporized Fisher’s $10 million fortune and cast a cloud over his reputation.
