Hong Hao: Where is the Bottom
2018-07-06 IMI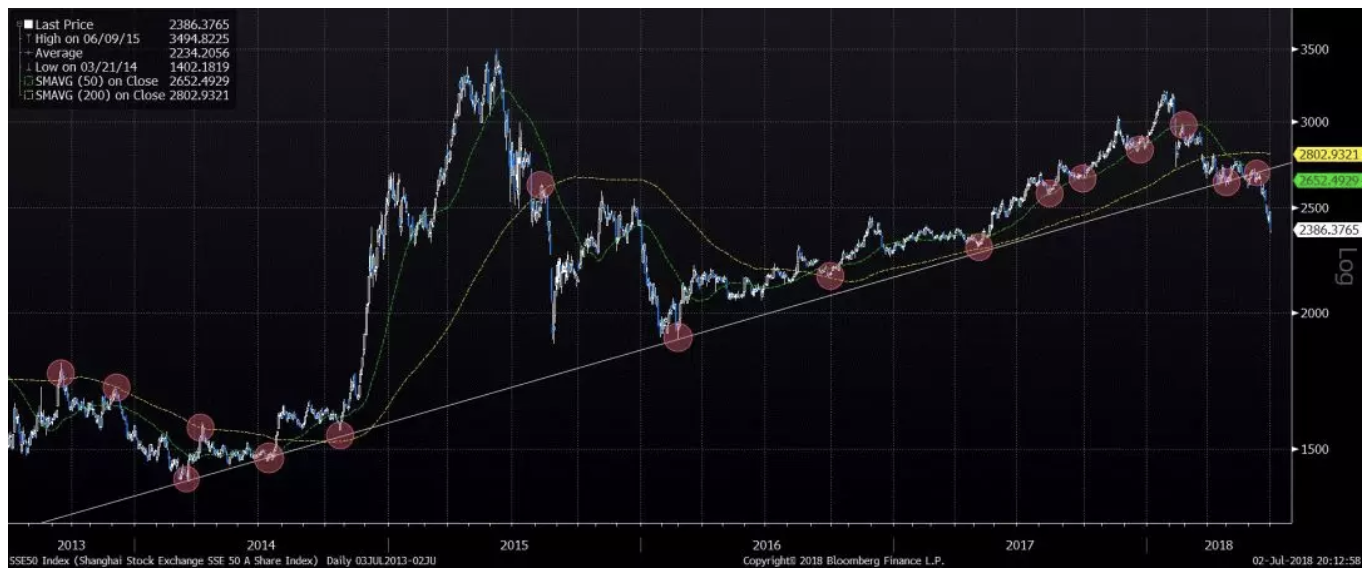 The property sector weighing on the market. News flow on the property sector has been particularly negative. PSL by CDB to fund shantytown reconstruction will change to physical resettlement based, instead of cash based. These loans, totally amounting to around RMB 5-6 trillion, have been an important driver of property price bubble, especially in the lower-tier cities.
There are also data showing that only 20% of the households who received cash for the shantytown reconstruction project had opted to buy new property. If so, this cash could have been an important source for the 2015 stock market bubble. Recently, Changsha has extended the holding period to five years after property purchase. Some cities have forbidden property purchase by companies. Other cities where property price has surged could follow suit with their own curbs, in an effort to cool property speculation.
Once the expectation for further gain has turned, it is possible to see waves of property liquidations. Already in Tongzhou, a county neighboring Beijing, the list price of a property on sale has been revised down by 50%. And the mob was so furious that it surrounded the sales office to get even.
We estimated that the value of China’s property stock to be between RMB 300-350 trillion. Assuming Chinese households and corporates apply its total deposit of RMB 125 trillion to pay for all the property inventory with a 40% down payment, the total value of such hypothetical transaction would be just above RMB 300 trillion. This back-of-envelope calculation suggests that Chinese property value is indeed stretched. And regulators must act decisively now.
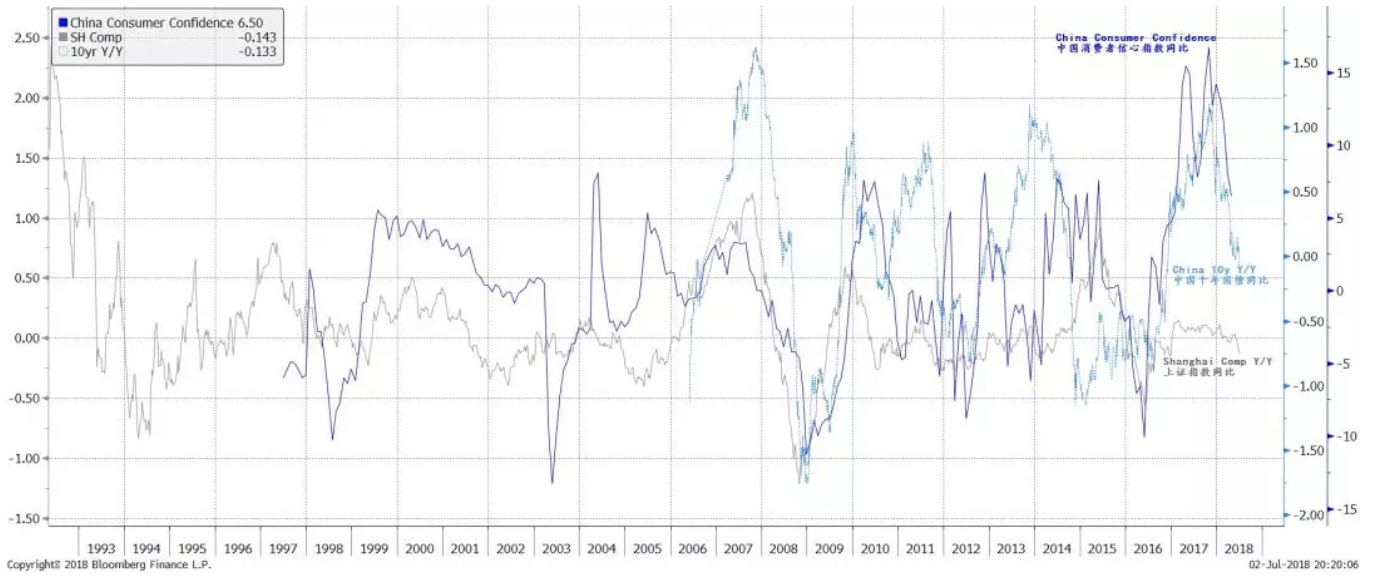
The property bubble has started to erode consumer confidence, as seen in Figure 2. The latest consumption growth data and consumer loan data show that consumption, one of the important pillars for Chinese growth in recent quarters, is decelerating fast. And consumer loans, too. The aftermath of the property bubble is palpable.
Figure 2: China’s consumer confidence falling from record high, auguring falling bond yields and stocks
The property sector weighing on the market. News flow on the property sector has been particularly negative. PSL by CDB to fund shantytown reconstruction will change to physical resettlement based, instead of cash based. These loans, totally amounting to around RMB 5-6 trillion, have been an important driver of property price bubble, especially in the lower-tier cities.
There are also data showing that only 20% of the households who received cash for the shantytown reconstruction project had opted to buy new property. If so, this cash could have been an important source for the 2015 stock market bubble. Recently, Changsha has extended the holding period to five years after property purchase. Some cities have forbidden property purchase by companies. Other cities where property price has surged could follow suit with their own curbs, in an effort to cool property speculation.
Once the expectation for further gain has turned, it is possible to see waves of property liquidations. Already in Tongzhou, a county neighboring Beijing, the list price of a property on sale has been revised down by 50%. And the mob was so furious that it surrounded the sales office to get even.
We estimated that the value of China’s property stock to be between RMB 300-350 trillion. Assuming Chinese households and corporates apply its total deposit of RMB 125 trillion to pay for all the property inventory with a 40% down payment, the total value of such hypothetical transaction would be just above RMB 300 trillion. This back-of-envelope calculation suggests that Chinese property value is indeed stretched. And regulators must act decisively now.
The property bubble has started to erode consumer confidence, as seen in Figure 2. The latest consumption growth data and consumer loan data show that consumption, one of the important pillars for Chinese growth in recent quarters, is decelerating fast. And consumer loans, too. The aftermath of the property bubble is palpable.
Figure 2: China’s consumer confidence falling from record high, auguring falling bond yields and stocks
 Structural liquidity issues with the market. Even so, the rapid deterioration of the Shanghai Composite, especially the SSE50 blue chip index, suggests that something beyond the weakening fundamentals is affecting the market. Since a few weeks ago when the Shanghai Composite was lingering above 3,000, consensus has been referring to the substantially cheapened valuation as the reason for a market bottom.
Our doubts have been that the sell-side sentiment is too bullish for an eventual market bottom. And the buy side, while cautious, still has substantial stock holdings in their portfolios and has little cash to deploy, as the market has been plunging too fast for many to react. Market bottom calls based on the most observable valuation multiples tend to be somewhat hasty.
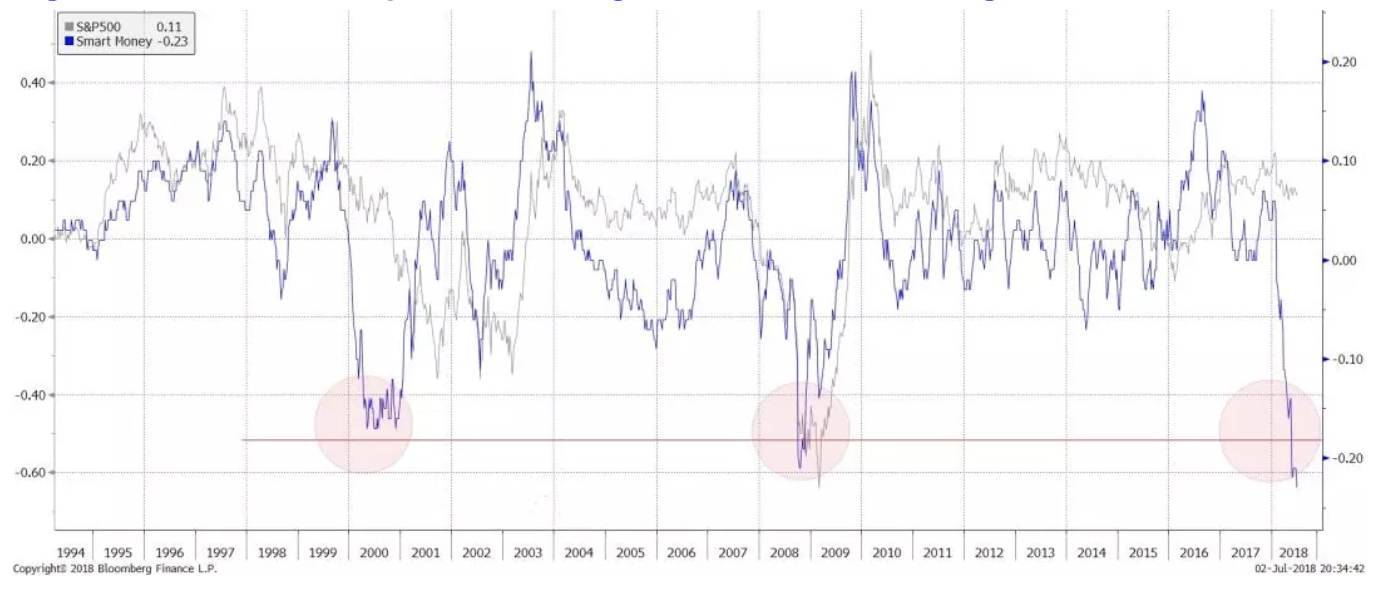
Our sentiment model suggests that, while the market has substantially scaled back its risk appetite, it is not depressed to its extremes as seen in previous bottoms. For instance, the turnover rate of the SSE50 is still too fast at about its long-term average, and is inconsistent with the typical levels of an eventual market bottom (Figure 3). If the blue chips, which make up 50% of the total market capitalization, will be struggling to find a bottom, so will the overall market. Meanwhile, the Smart Money Index has plunged further to a level that tends to augur impending market crisis (Figure 4).
Figure 3: Turnover rate of SSE50 is still too fast to suggest a sustainable rebound
Structural liquidity issues with the market. Even so, the rapid deterioration of the Shanghai Composite, especially the SSE50 blue chip index, suggests that something beyond the weakening fundamentals is affecting the market. Since a few weeks ago when the Shanghai Composite was lingering above 3,000, consensus has been referring to the substantially cheapened valuation as the reason for a market bottom.
Our doubts have been that the sell-side sentiment is too bullish for an eventual market bottom. And the buy side, while cautious, still has substantial stock holdings in their portfolios and has little cash to deploy, as the market has been plunging too fast for many to react. Market bottom calls based on the most observable valuation multiples tend to be somewhat hasty.
Our sentiment model suggests that, while the market has substantially scaled back its risk appetite, it is not depressed to its extremes as seen in previous bottoms. For instance, the turnover rate of the SSE50 is still too fast at about its long-term average, and is inconsistent with the typical levels of an eventual market bottom (Figure 3). If the blue chips, which make up 50% of the total market capitalization, will be struggling to find a bottom, so will the overall market. Meanwhile, the Smart Money Index has plunged further to a level that tends to augur impending market crisis (Figure 4).
Figure 3: Turnover rate of SSE50 is still too fast to suggest a sustainable rebound
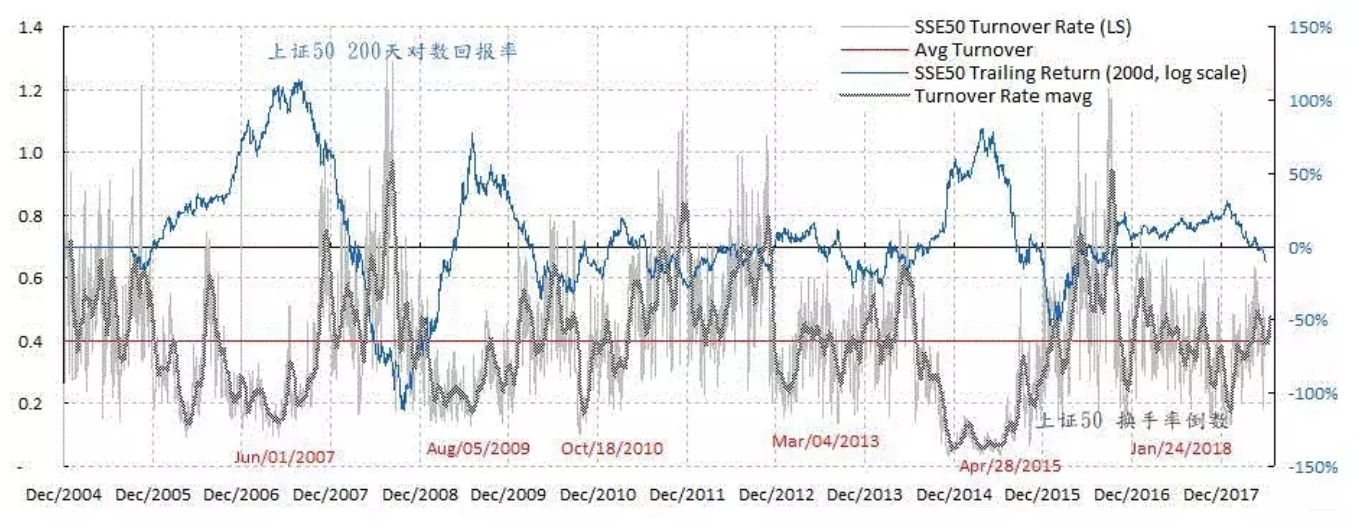 Figure 4: Smart money’s continuing exodus is foreboding
 Be patient for a better entry point later. As such, the sell-off is probably induced by trading structure. A recent report drafted by a prominent Chinese academic that warned of a potential financial crisis highlighted that the leverage in the stock market through stock pledge can amount to RMB 5-6 trillion, a similar level to its highs during the 2015 stock market bubble. Such observations seem to be consistent with the recent startling market movements. The concerns about stock market leverage can also explain why forced liquidation of loans backed by stock pledge was stopped by the authority at midnight a few weeks ago. Meanwhile, these trading restrictions may have coaxed the small retail investors to sell and front-run the large shareholders.
If so, even if the market is technically oversold, sentiment is low and valuation is cheaper, it is still too early to catch falling knives, as there will be further selling for structural liquidity reasons from anywhere. At times like these, technical rebounds will be fleeting, and investors should hold out for better entry points later.
Be patient for a better entry point later. As such, the sell-off is probably induced by trading structure. A recent report drafted by a prominent Chinese academic that warned of a potential financial crisis highlighted that the leverage in the stock market through stock pledge can amount to RMB 5-6 trillion, a similar level to its highs during the 2015 stock market bubble. Such observations seem to be consistent with the recent startling market movements. The concerns about stock market leverage can also explain why forced liquidation of loans backed by stock pledge was stopped by the authority at midnight a few weeks ago. Meanwhile, these trading restrictions may have coaxed the small retail investors to sell and front-run the large shareholders.
If so, even if the market is technically oversold, sentiment is low and valuation is cheaper, it is still too early to catch falling knives, as there will be further selling for structural liquidity reasons from anywhere. At times like these, technical rebounds will be fleeting, and investors should hold out for better entry points later.
