Hong Hao: 1987
2018-04-03 IMI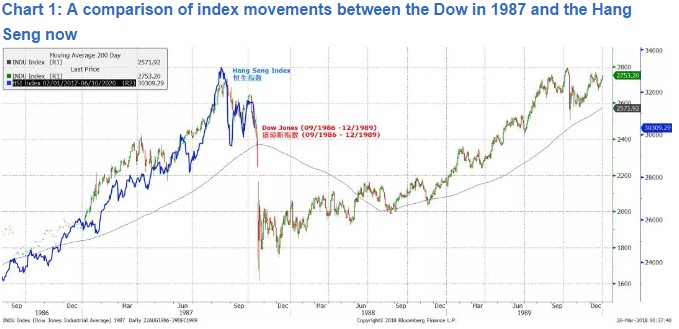 While we concede that many a technical chart of such startling nature can be drawn, the similarities between historical precedents and stock market movements are intriguing. It is worth taking a note.
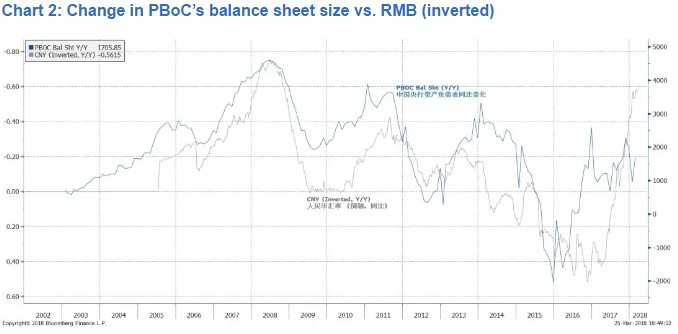
The PBoC’s balance sheet growth is set to slow; RMB strength will ease. The PBoC has a new governor and a new party secretary. Consensus believes that policy continuity is thus ensured. But we think the central bank’s policy depends more on the underlying business cycle than on its personnel, and tends to be counter-cyclical.
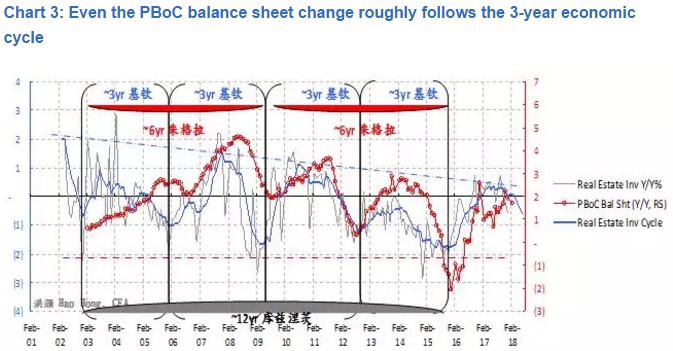
With the progress of reining in shadow banking and deleveraging, the central bank’s balance sheet growth will slow, concurrent with China’s three-year economic cycle. (Please see our report “A Definitive Guide to China’s Economic Cycle” on 2017-03-24, and “A Definitive Guide to China’s Economic Cycle Part II – New High” on 2017-08-28). Concurrently, the RMB will likely weaken, if history is a guide (Chart 2-3). There is a possibility that such potential cyclical weakening of the RMB can be misconstrued as an act of trade war.
While we concede that many a technical chart of such startling nature can be drawn, the similarities between historical precedents and stock market movements are intriguing. It is worth taking a note.
The PBoC’s balance sheet growth is set to slow; RMB strength will ease. The PBoC has a new governor and a new party secretary. Consensus believes that policy continuity is thus ensured. But we think the central bank’s policy depends more on the underlying business cycle than on its personnel, and tends to be counter-cyclical.
With the progress of reining in shadow banking and deleveraging, the central bank’s balance sheet growth will slow, concurrent with China’s three-year economic cycle. (Please see our report “A Definitive Guide to China’s Economic Cycle” on 2017-03-24, and “A Definitive Guide to China’s Economic Cycle Part II – New High” on 2017-08-28). Concurrently, the RMB will likely weaken, if history is a guide (Chart 2-3). There is a possibility that such potential cyclical weakening of the RMB can be misconstrued as an act of trade war.
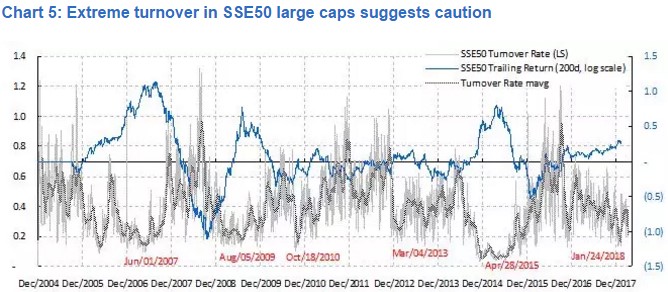
 Large-cap turnover approaching extreme; market still fraught with risks: While the market’s pessimistic reflex may be tempting for some to bottom fish, we note that market visibility in the near term remains clouded. In our note “The Year of the Dog: Lessons from 2017” (2018-01-30), we warned of an impending market sell-off. We suggested we would wait till the volatility subsided before re-establishing our positions, and the market may have seen its high of the first half of 2018. In our follow-up note “Markets in Crisis” (2018-02-06), we cautioned against being too hasty to catch falling knives.
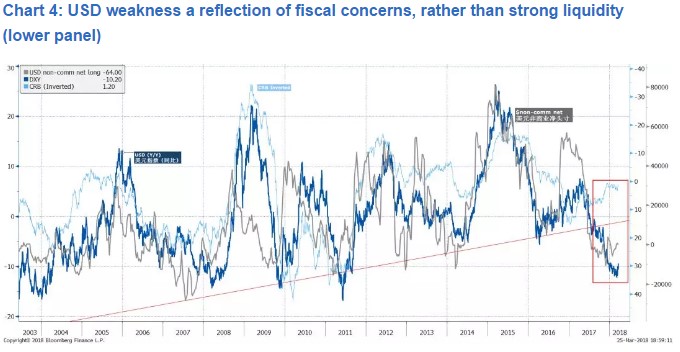
Despite the current weakness in the Dollar, emerging markets and commodities were still sold off during the recent market turmoil. The Dollar appears to have broken down, and its weakness is more a reflection of the US fiscal strain, rather than abundant dollar liquidity. Recent surging LIBOR, as well as the widening LIBOR-OIS spread are all hinting at the same structural problem. That is, a traditional risk haven is no longer there (Chart 4). We will consider only China’s treasury bonds and gold.
Large-cap turnover approaching extreme; market still fraught with risks: While the market’s pessimistic reflex may be tempting for some to bottom fish, we note that market visibility in the near term remains clouded. In our note “The Year of the Dog: Lessons from 2017” (2018-01-30), we warned of an impending market sell-off. We suggested we would wait till the volatility subsided before re-establishing our positions, and the market may have seen its high of the first half of 2018. In our follow-up note “Markets in Crisis” (2018-02-06), we cautioned against being too hasty to catch falling knives.
Despite the current weakness in the Dollar, emerging markets and commodities were still sold off during the recent market turmoil. The Dollar appears to have broken down, and its weakness is more a reflection of the US fiscal strain, rather than abundant dollar liquidity. Recent surging LIBOR, as well as the widening LIBOR-OIS spread are all hinting at the same structural problem. That is, a traditional risk haven is no longer there (Chart 4). We will consider only China’s treasury bonds and gold.
 An escalation of disputes will fundamentally change the outlook of global growth, which now appears peaking, and elevate inflation pressure. If such a worst-case scenario happens, all bets are off.
Consensus is focusing on the 200-day moving average as the line in the sand of technical support. Moving averages are friends of a continuing trend, but are blind to inflection points. Large caps’ turnover is once again approaching extremes that had historically portended the peak of the SSE50 index (Chart 5).
Consensus also points to solid US fundamentals. But in 1987, the real US GDP growth was 3.4%, and the US didn’t sink into recession until 1991. In an environment with dwindling macro liquidity, the trades that used to have momentum behind their sails will likely see reversal. The stronger the momentum has been previously, the more potent and more likely the reversal now. We cannot pin our strategy on a few technical averages that are moving with hindsight.
An escalation of disputes will fundamentally change the outlook of global growth, which now appears peaking, and elevate inflation pressure. If such a worst-case scenario happens, all bets are off.
Consensus is focusing on the 200-day moving average as the line in the sand of technical support. Moving averages are friends of a continuing trend, but are blind to inflection points. Large caps’ turnover is once again approaching extremes that had historically portended the peak of the SSE50 index (Chart 5).
Consensus also points to solid US fundamentals. But in 1987, the real US GDP growth was 3.4%, and the US didn’t sink into recession until 1991. In an environment with dwindling macro liquidity, the trades that used to have momentum behind their sails will likely see reversal. The stronger the momentum has been previously, the more potent and more likely the reversal now. We cannot pin our strategy on a few technical averages that are moving with hindsight.