Hong Hao: 2H2018–Rough Sailing
2018-05-28 IMI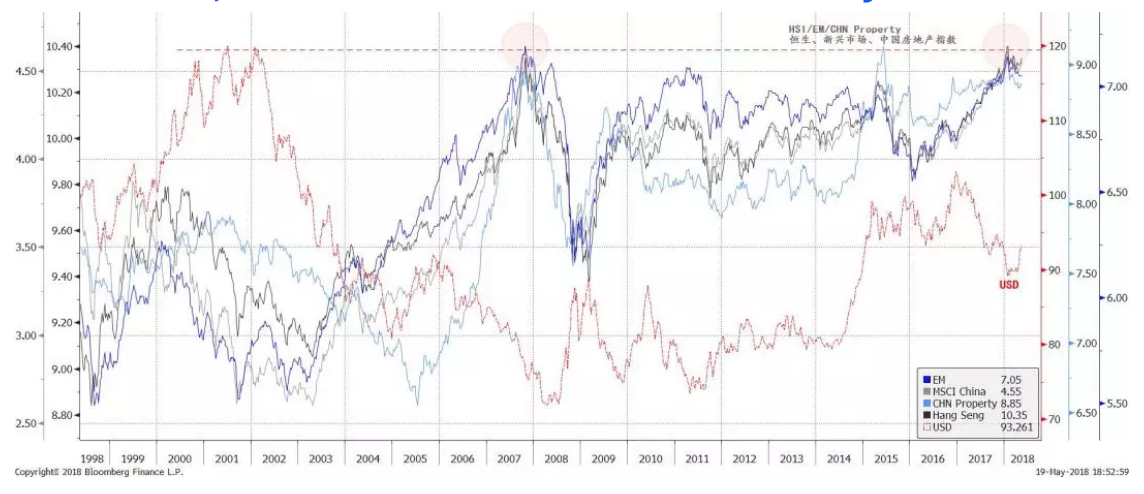 Diverging price trends between inflation-sensitive and industrial commodities hint at rising risk of stagflation. Meanwhile, the divergence between the inflation-sensitive commodities, such as oil and gold, and the industrial commodities seems to suggest rising risk of stagflation, a scenario in which both stocks and bonds will fare poorly – as they did during the market correction between February and April. Other growth-sensitive asset prices, such as the Baltic Dry Index, Caterpillar (CAT), rebar, as well as the leading indicator of global trade conditions all seem to be confirming decelerating global growth (Chart 2).
The gap between the inflation-sensitive and the industrial commodities is similar to that of early 2008, as the world was about to enter the worst crisis in recent history. Of course, the potential scenario can be less ominous, as it was in 2005 and in 2014 (highlighted in red shades in Chart 2).
As we discussed in our earlier report titled “A Definitive Guide to China’s Economic Cycle” (published on 20170324), the Chinese economy has an innate 3-year cycle. 2005 was the beginning of a cyclical upswing, while 2014 marked the peak of the 3-year cycle started in 2013 – similar to mid to late 2017. Without the dramatic credit expansion through shadow banking, the 2015 Chinese stock market bubble would not have been possible - given the rapidly deteriorating economic fundamentals then. Even so, investors paid it all back, plus some more after the bubble burst in June 2015 (“The Great China Bubble: Lessons from 800 Years of History” on 20150616).
Chart 2: Inflation-sensitive and industrial commodities diverge, suggesting potential stagflation; inflation expectation rising with oil
Diverging price trends between inflation-sensitive and industrial commodities hint at rising risk of stagflation. Meanwhile, the divergence between the inflation-sensitive commodities, such as oil and gold, and the industrial commodities seems to suggest rising risk of stagflation, a scenario in which both stocks and bonds will fare poorly – as they did during the market correction between February and April. Other growth-sensitive asset prices, such as the Baltic Dry Index, Caterpillar (CAT), rebar, as well as the leading indicator of global trade conditions all seem to be confirming decelerating global growth (Chart 2).
The gap between the inflation-sensitive and the industrial commodities is similar to that of early 2008, as the world was about to enter the worst crisis in recent history. Of course, the potential scenario can be less ominous, as it was in 2005 and in 2014 (highlighted in red shades in Chart 2).
As we discussed in our earlier report titled “A Definitive Guide to China’s Economic Cycle” (published on 20170324), the Chinese economy has an innate 3-year cycle. 2005 was the beginning of a cyclical upswing, while 2014 marked the peak of the 3-year cycle started in 2013 – similar to mid to late 2017. Without the dramatic credit expansion through shadow banking, the 2015 Chinese stock market bubble would not have been possible - given the rapidly deteriorating economic fundamentals then. Even so, investors paid it all back, plus some more after the bubble burst in June 2015 (“The Great China Bubble: Lessons from 800 Years of History” on 20150616).
Chart 2: Inflation-sensitive and industrial commodities diverge, suggesting potential stagflation; inflation expectation rising with oil
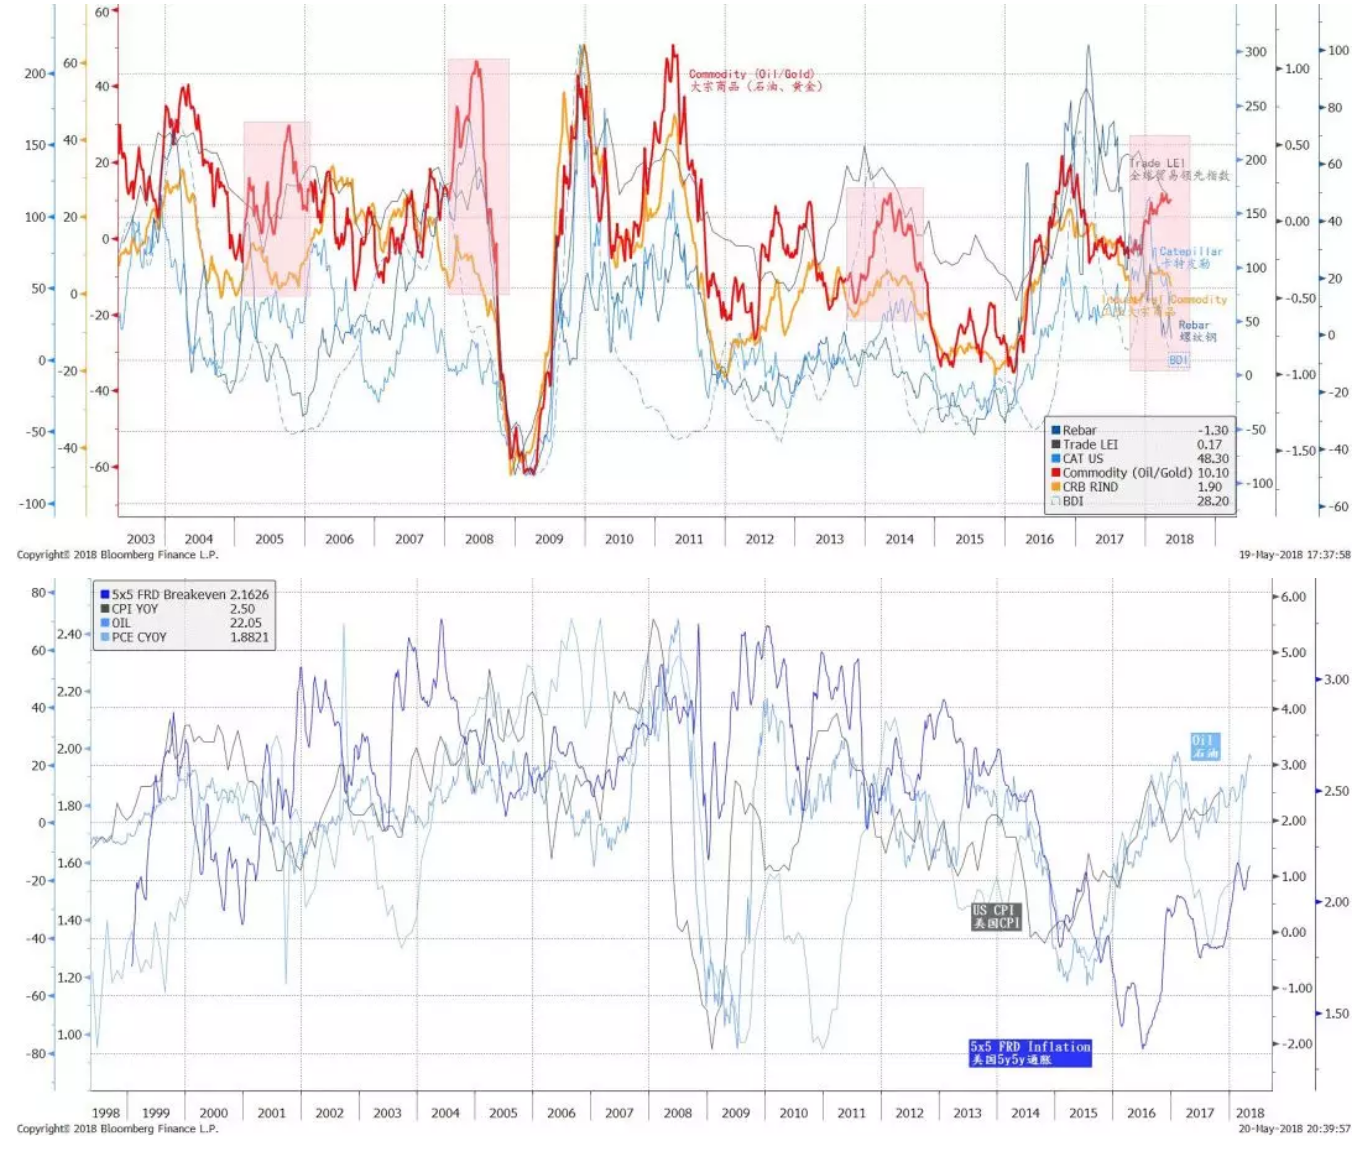 But these are prospects implied by market prices. And market prices can be fickle. As these prices are trending, we find few reasons to disagree with the consensus that is rapidly forming behind these price trends. At the point when the price trends reach their extremes, as they did in 2008, consensus is then fully priced in, and there will be opportunity to bet against consensus. For now, market prices shown in Chart 2 are still trending. As such, they are suggesting the prospects of stagflation, but can also turn on a dime. We must read into fundamental economic data to infer where these price trends are heading towards.
China’s Monetary and Fiscal Outlook
More RRR cut to replace MLF likely; but it is also a sign of the PBoC balance sheet retrenchment. Recent surprising cut on RRR in exchange of MLF was interpreted by the market as the PBoC is changing its monetary stance from neutral to loosening. We understand that market participants would be keen to see liquidity pumping again, as it would be supportive to asset prices. But given the recent reiteration of a “prudent and neutral” monetary stance, and signs of property bubble are still omnipresent, such a sudden change of heart is unlikely. Further, on the morning of RRR cut, the PBoC indeed conducted a new MLF transaction.
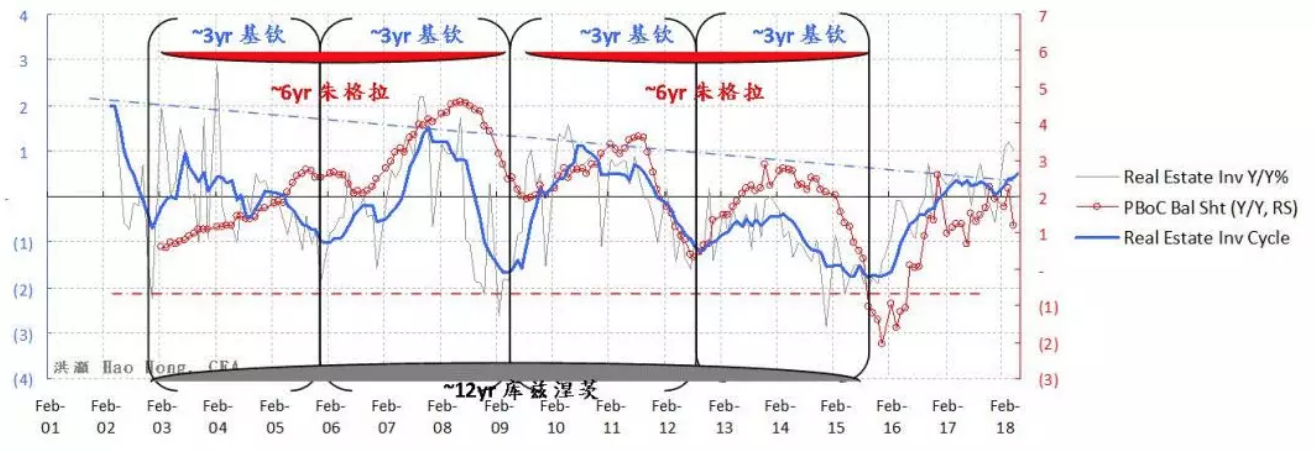
Our analysis suggests that at the late stage of China’s 3-year economic cycle, as it is now, the PBoC’s balance sheet tends to grow slower (Chart 3). While the MLF has given the central bank more leeway to influence market interest rates, it also means the central bank is taking risks off financial institutions by expanding its own assets on its balance sheet. As such, a RRR cut to replace MLF is a way for the central bank to retrench its balance sheet. Coincidentally, in the bank’s recent public communications, it discussed the scope for balance sheet reduction.
If spending in property construction recovers in the second half, a scenario we will discuss hereafter, demand for banks loans should increase. But surplus reserve on small/mid-sized banks’ balance sheet is still low even after the latest RRR cut. Given the size of the remaining MLF of RMB 4 trillion, with RMB 2.8 trillion due this year, there should be at least one more RRR cut to replace the MLF in the second half of 2018. As such, the PBoC’s balance sheet growth will likely continue to decelerate.
Chart 3: PBoC balance sheet change vs. China’s 3-year economic cycle
But these are prospects implied by market prices. And market prices can be fickle. As these prices are trending, we find few reasons to disagree with the consensus that is rapidly forming behind these price trends. At the point when the price trends reach their extremes, as they did in 2008, consensus is then fully priced in, and there will be opportunity to bet against consensus. For now, market prices shown in Chart 2 are still trending. As such, they are suggesting the prospects of stagflation, but can also turn on a dime. We must read into fundamental economic data to infer where these price trends are heading towards.
China’s Monetary and Fiscal Outlook
More RRR cut to replace MLF likely; but it is also a sign of the PBoC balance sheet retrenchment. Recent surprising cut on RRR in exchange of MLF was interpreted by the market as the PBoC is changing its monetary stance from neutral to loosening. We understand that market participants would be keen to see liquidity pumping again, as it would be supportive to asset prices. But given the recent reiteration of a “prudent and neutral” monetary stance, and signs of property bubble are still omnipresent, such a sudden change of heart is unlikely. Further, on the morning of RRR cut, the PBoC indeed conducted a new MLF transaction.
Our analysis suggests that at the late stage of China’s 3-year economic cycle, as it is now, the PBoC’s balance sheet tends to grow slower (Chart 3). While the MLF has given the central bank more leeway to influence market interest rates, it also means the central bank is taking risks off financial institutions by expanding its own assets on its balance sheet. As such, a RRR cut to replace MLF is a way for the central bank to retrench its balance sheet. Coincidentally, in the bank’s recent public communications, it discussed the scope for balance sheet reduction.
If spending in property construction recovers in the second half, a scenario we will discuss hereafter, demand for banks loans should increase. But surplus reserve on small/mid-sized banks’ balance sheet is still low even after the latest RRR cut. Given the size of the remaining MLF of RMB 4 trillion, with RMB 2.8 trillion due this year, there should be at least one more RRR cut to replace the MLF in the second half of 2018. As such, the PBoC’s balance sheet growth will likely continue to decelerate.
Chart 3: PBoC balance sheet change vs. China’s 3-year economic cycle
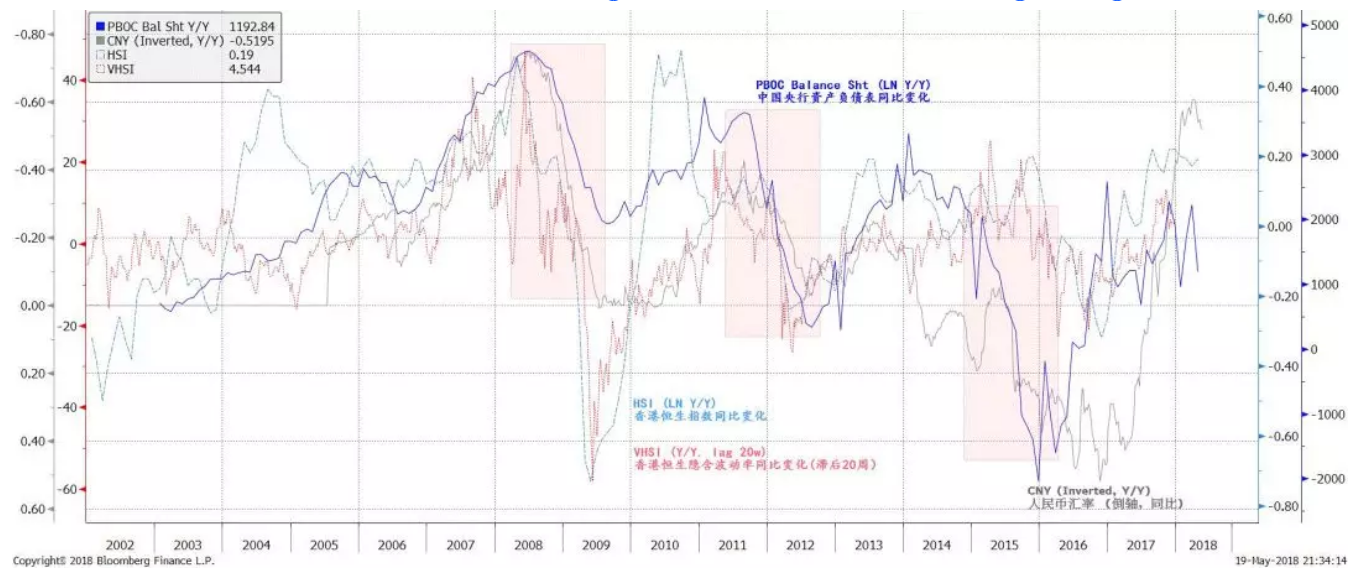
 Change in PBoC’s balance sheet tends to influence asset prices. Our analysis shows that the change in the PBoC’s balance sheet tends to ebb and flow with asset prices and price volatility (Chart 4). Whenever the central bank’s balance sheet growth decelerates or even shrinks, as it did in 2008, 2012 and 2015 (highlighted in the red-shaded periods in Chart 4), stock prices suffered while market volatility was elevated. And the yuan weakened. These are also the years the PBoC loosened its monetary policy by cutting RRR and/or interest rates to counter macroeconomic risks.
As such, it would not be difficult to understand the market moves after the RRR cut was announced, with stocks opening high but then trading lower subsequently, while bond yields plunged significantly by ~20bps in a day. Monetary loosening by RRR cut is indeed equivalent to the balance sheet retrenchment. It is a sign suggesting that the central bank, the most informed and competent market participant, believes that the economy is slowing, and macroeconomic risks are rising.
As such, funds will rotate into sovereign bonds out of stocks simply because of risk aversion. This is contrary to the popular belief that stocks should rally after monetary loosening. Policy fine-tuning, especially the initial steps, is unlikely to reverse the course of a cyclical down trend. Hence the confirmation signal of a slowdown from the central bank will initially accelerate asset prices along their existing trends, rather than reversing it.
Chart 4: PBoC balance sheet change vs. CNY and the Hang Seng
Change in PBoC’s balance sheet tends to influence asset prices. Our analysis shows that the change in the PBoC’s balance sheet tends to ebb and flow with asset prices and price volatility (Chart 4). Whenever the central bank’s balance sheet growth decelerates or even shrinks, as it did in 2008, 2012 and 2015 (highlighted in the red-shaded periods in Chart 4), stock prices suffered while market volatility was elevated. And the yuan weakened. These are also the years the PBoC loosened its monetary policy by cutting RRR and/or interest rates to counter macroeconomic risks.
As such, it would not be difficult to understand the market moves after the RRR cut was announced, with stocks opening high but then trading lower subsequently, while bond yields plunged significantly by ~20bps in a day. Monetary loosening by RRR cut is indeed equivalent to the balance sheet retrenchment. It is a sign suggesting that the central bank, the most informed and competent market participant, believes that the economy is slowing, and macroeconomic risks are rising.
As such, funds will rotate into sovereign bonds out of stocks simply because of risk aversion. This is contrary to the popular belief that stocks should rally after monetary loosening. Policy fine-tuning, especially the initial steps, is unlikely to reverse the course of a cyclical down trend. Hence the confirmation signal of a slowdown from the central bank will initially accelerate asset prices along their existing trends, rather than reversing it.
Chart 4: PBoC balance sheet change vs. CNY and the Hang Seng
 New rules on the asset management industry will tighten liquidity and affect asset prices. Consensus after the new rules on the asset management industry were announced focused on the extension of the implementation period. Consensus believed that the announcement was better than expected, and thus should help lift asset prices. But the new rules and their implementation will likely be complicated. It would be challenging to price. Recent waves of corporate defaults, including some high-profile companies with substantial balance sheets, and the subsequent roiling in the bond market, suggest that the repercussions from these new rules are just starting.
During the process of returning these assets onto the balance sheet, banks can choose to liquidate the assets with good liquidity, such as stocks and rate securities. Much of the assets with lower risks can return onto the balance sheet and change into deposits. The handling of debentures and non-standard credit assets will also exert pressure on credit risks and spread.
When the leverage of underlying assets is removed, the corresponding asset prices are bound to be affected. Extension of the implementation period will merely alleviate but not eliminate the pain. Credit tightness will be felt, as it is now. Given one of the policy imperatives in 2018 is to “guard against risks”, monetary instruments can be deployed for this purpose later in 2018.
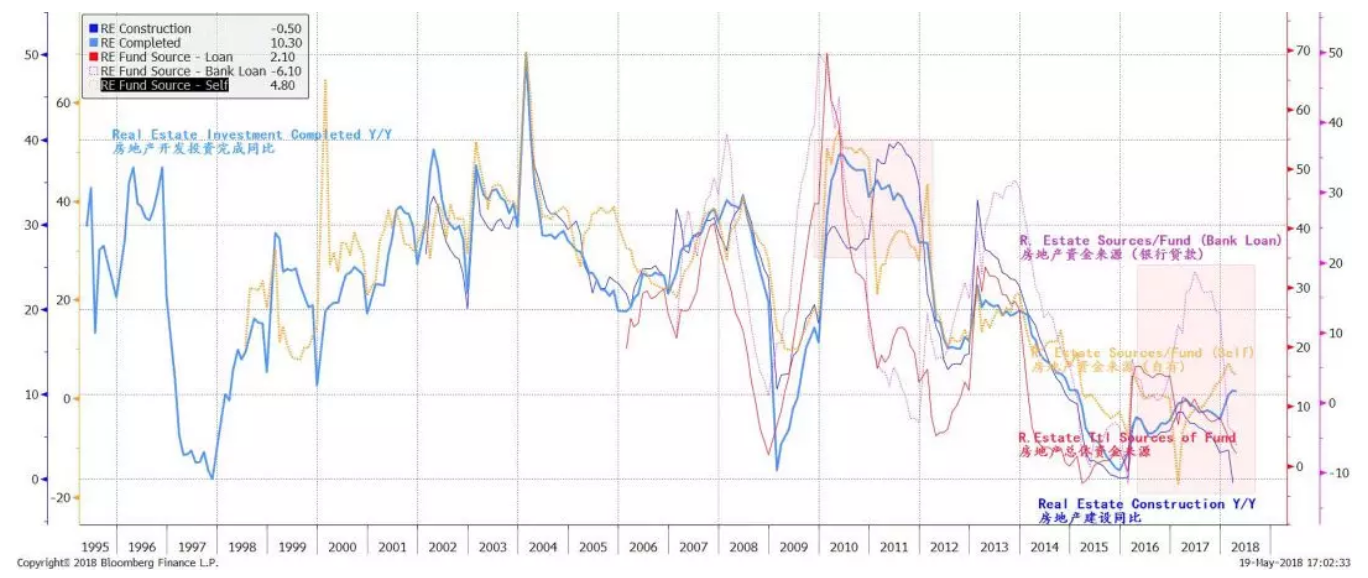
Real estate construction spending will increase in the second half of 2018, but overall real estate investment completed will decelerate.Since late last year, bank loans as a source of fund for real estate have plunged, as banks tighten their credit policy to the property sector under the government’s guidance to curb speculation. These bank loans have been an important funding source for property construction. Consequently, spending on real estate construction has also plunged. It is probably the first time since we have data that we see the YoY growth of real estate construction spending turns negative.
Meanwhile, as last year’s property sales remained resilient despite the property curbs, self-generated source of fund for real estate continued to register strong growth. As land prices continue to surge, developers have chosen to deploy these self-generated funds to stock up on land. In so doing, developers’ NAV will also get a boost, as land prices increase. While total land area sold has declined, the nominal amount spent on land has indeed risen. That said, as property sales continue to decelerate and overseas bond issuance costs continue to rise, self-generated funds, the only source of funds permitted for land purchase, will likely be depleted fast.
Last time we saw a divergence between land banking and construction was in early 2010, when the “Ten National Guidelines” slowed property sales. But construction eventually caught up, as the government gradually loosened its curbs (Chart 5). We think this time a similar scenario could eventuate, given the mantra of “guarding against risk”. And loan demand in the coming months will likely increase, presaging more RRR cuts. Eventually, rising real estate construction spending will partially offset the decelerating spending on land, leading the overall growth of completed real estate investment slower.
Chart 5: Developers have been spending on land, instead of construction; construction should rise
New rules on the asset management industry will tighten liquidity and affect asset prices. Consensus after the new rules on the asset management industry were announced focused on the extension of the implementation period. Consensus believed that the announcement was better than expected, and thus should help lift asset prices. But the new rules and their implementation will likely be complicated. It would be challenging to price. Recent waves of corporate defaults, including some high-profile companies with substantial balance sheets, and the subsequent roiling in the bond market, suggest that the repercussions from these new rules are just starting.
During the process of returning these assets onto the balance sheet, banks can choose to liquidate the assets with good liquidity, such as stocks and rate securities. Much of the assets with lower risks can return onto the balance sheet and change into deposits. The handling of debentures and non-standard credit assets will also exert pressure on credit risks and spread.
When the leverage of underlying assets is removed, the corresponding asset prices are bound to be affected. Extension of the implementation period will merely alleviate but not eliminate the pain. Credit tightness will be felt, as it is now. Given one of the policy imperatives in 2018 is to “guard against risks”, monetary instruments can be deployed for this purpose later in 2018.
Real estate construction spending will increase in the second half of 2018, but overall real estate investment completed will decelerate.Since late last year, bank loans as a source of fund for real estate have plunged, as banks tighten their credit policy to the property sector under the government’s guidance to curb speculation. These bank loans have been an important funding source for property construction. Consequently, spending on real estate construction has also plunged. It is probably the first time since we have data that we see the YoY growth of real estate construction spending turns negative.
Meanwhile, as last year’s property sales remained resilient despite the property curbs, self-generated source of fund for real estate continued to register strong growth. As land prices continue to surge, developers have chosen to deploy these self-generated funds to stock up on land. In so doing, developers’ NAV will also get a boost, as land prices increase. While total land area sold has declined, the nominal amount spent on land has indeed risen. That said, as property sales continue to decelerate and overseas bond issuance costs continue to rise, self-generated funds, the only source of funds permitted for land purchase, will likely be depleted fast.
Last time we saw a divergence between land banking and construction was in early 2010, when the “Ten National Guidelines” slowed property sales. But construction eventually caught up, as the government gradually loosened its curbs (Chart 5). We think this time a similar scenario could eventuate, given the mantra of “guarding against risk”. And loan demand in the coming months will likely increase, presaging more RRR cuts. Eventually, rising real estate construction spending will partially offset the decelerating spending on land, leading the overall growth of completed real estate investment slower.
Chart 5: Developers have been spending on land, instead of construction; construction should rise
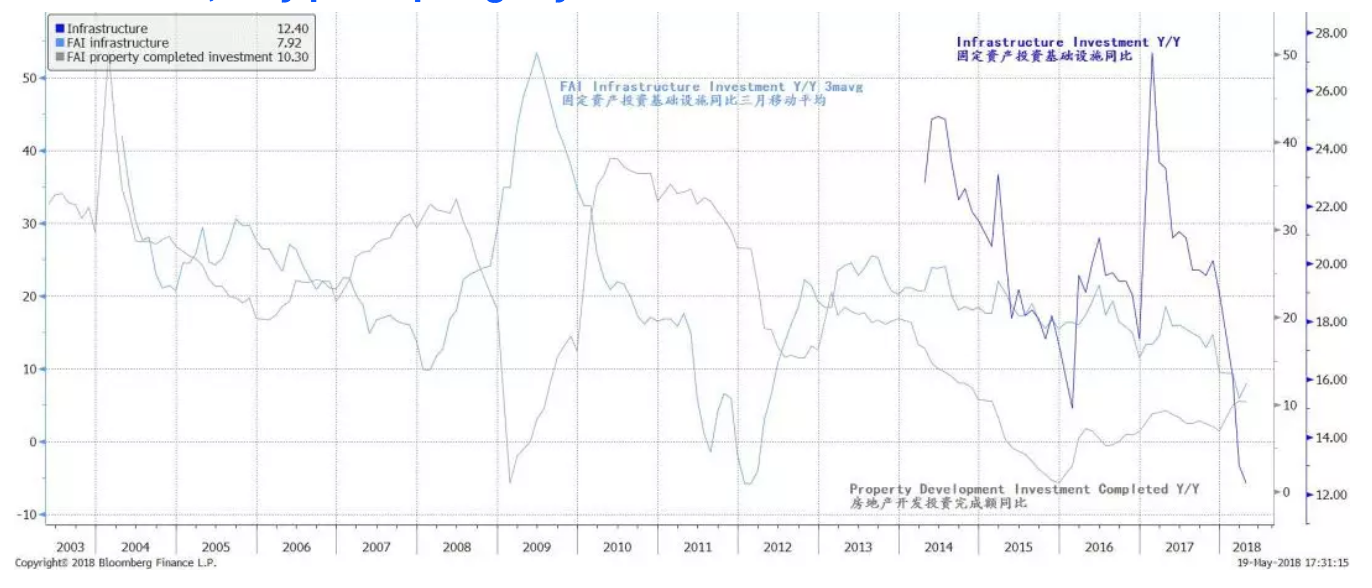
 Infrastructure FAI can also rise in the second half, offsetting the slower completed real estate investment. Infrastructure FAI has plunged in the first quarter of 2018 - at an alarming speed. YTD, local government debt issuance has been used to replace existing debt, and no new local government debt has been issued. That is, there is no new incremental funding for local government to spend on infrastructure.
However, given the infrastructure investment plan this year, and the schedule of local government debt issuance, the situation thus far this year is unlikely to be sustainable. As real estate completed investment growth slows, infrastructure spending should be there to arrest the fall in investment, as it has always been in history (Chart 6). Real estate and infrastructure FAI account for around 50% of total FAI, and have the biggest spending multiplier. Meanwhile, manufacturing FAI growth has fallen flat. Given slower corporate earnings growth this year, manufacturing FAI is unlikely to re-accelerate.
Chart 6: Infrastructure investment, historically an offset to property investment, may pick up slightly
Infrastructure FAI can also rise in the second half, offsetting the slower completed real estate investment. Infrastructure FAI has plunged in the first quarter of 2018 - at an alarming speed. YTD, local government debt issuance has been used to replace existing debt, and no new local government debt has been issued. That is, there is no new incremental funding for local government to spend on infrastructure.
However, given the infrastructure investment plan this year, and the schedule of local government debt issuance, the situation thus far this year is unlikely to be sustainable. As real estate completed investment growth slows, infrastructure spending should be there to arrest the fall in investment, as it has always been in history (Chart 6). Real estate and infrastructure FAI account for around 50% of total FAI, and have the biggest spending multiplier. Meanwhile, manufacturing FAI growth has fallen flat. Given slower corporate earnings growth this year, manufacturing FAI is unlikely to re-accelerate.
Chart 6: Infrastructure investment, historically an offset to property investment, may pick up slightly
 Market Sentiment Mixed
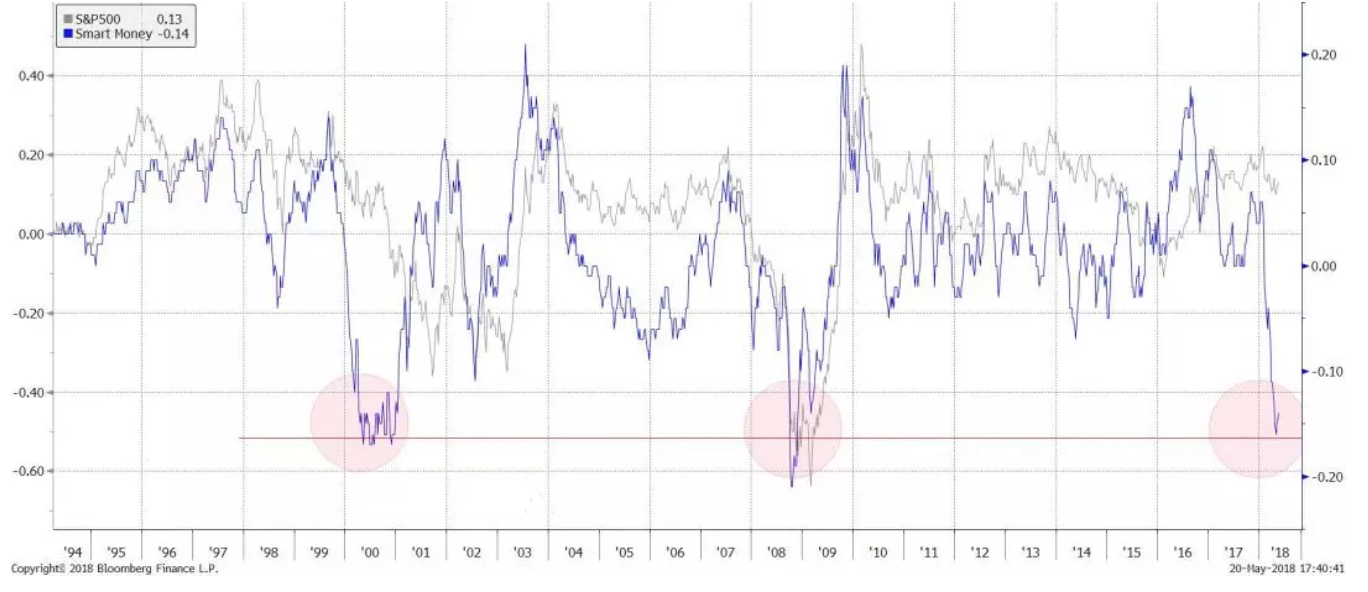
Smart money appears to be in distribution mode; it has reached an extreme level that used to presage ensuing market dislocation. We observe that, while the US market continues to hover around its historical highs despite recent dramatic swings, smart money seems to be leaving in droves. Smart money has proven to be a reliable leading market indicator at various market inflection points in the past. Further, when the extent of smart money’s exit was as severe as observed recently, significant market dislocations ensued. The most notable incidents are prior to the 2000 Millennium Bubble and the 2008 global financial crisis (Chart 7).
Chart 7: Smart money sentiment has plunged to extreme that augurs significant market dislocation
Market Sentiment Mixed
Smart money appears to be in distribution mode; it has reached an extreme level that used to presage ensuing market dislocation. We observe that, while the US market continues to hover around its historical highs despite recent dramatic swings, smart money seems to be leaving in droves. Smart money has proven to be a reliable leading market indicator at various market inflection points in the past. Further, when the extent of smart money’s exit was as severe as observed recently, significant market dislocations ensued. The most notable incidents are prior to the 2000 Millennium Bubble and the 2008 global financial crisis (Chart 7).
Chart 7: Smart money sentiment has plunged to extreme that augurs significant market dislocation
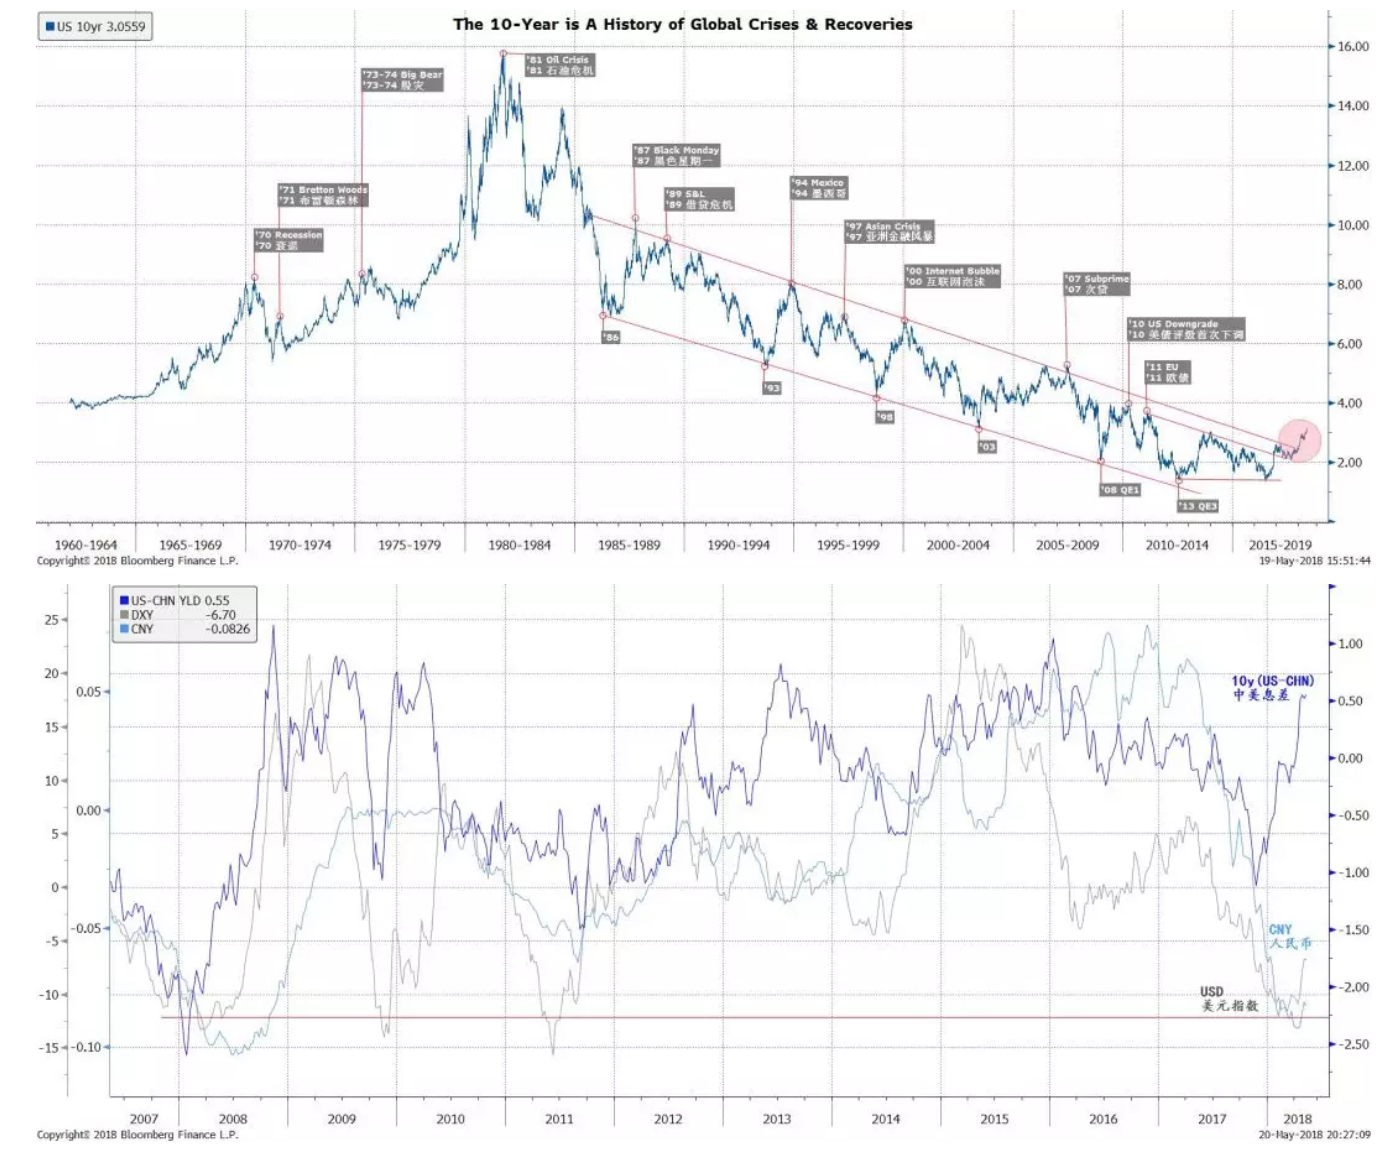
 Signal from smart money appears to be consistent with the observation that the US 10-year Treasury yield has broken well above its secular downward channel, as well as a strengthening dollar. These are signs that macro liquidity is turning, and historically market crises tended to break out somewhere in the global markets (Chart 8). Already, Argentina and Turkey are plunging. It should be noted that the US market can rise amid crisis in the emerging markets. For instance, the US market continued to strengthen in 1997, along with the rising dollar and rising yield, while Asian markets and Russia sank into crisis.
Chart 8: US 10yr a history of global crisis and recoveries; extreme USD weakness
Signal from smart money appears to be consistent with the observation that the US 10-year Treasury yield has broken well above its secular downward channel, as well as a strengthening dollar. These are signs that macro liquidity is turning, and historically market crises tended to break out somewhere in the global markets (Chart 8). Already, Argentina and Turkey are plunging. It should be noted that the US market can rise amid crisis in the emerging markets. For instance, the US market continued to strengthen in 1997, along with the rising dollar and rising yield, while Asian markets and Russia sank into crisis.
Chart 8: US 10yr a history of global crisis and recoveries; extreme USD weakness
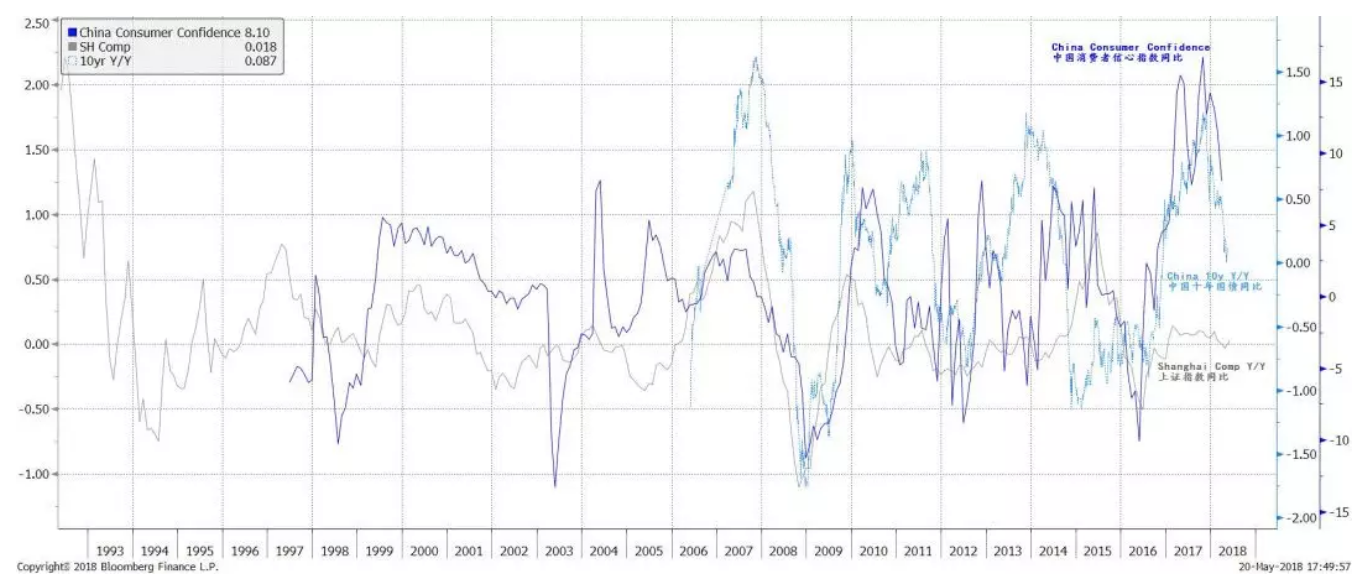
 China consumer confidence is inflecting from all-time high – an ominous sign. Historically, Chinese consumer confidence has been highly correlated with China’s 10-year bond yield and stock market return. It has been a reliable indicator for market bottoms in late 1998, late 2008 and early 2016. The buoyant Chinese property market, together with the public propaganda, must have bolstered Chinese consumer confidence to its historical high.
But since late 2017 and early 2018, the confidence has been inflecting from its peak, together with falling bond yields as a reflection of slowing economic growth, and tepid stock market return. As the Chinese economy continues to slow, consumer confidence is likely to fall further in tandem, leaving less confident buyers for stocks – till it reaches its pessimistic extremes.
Chart 9: China’s consumer confidence inflecting at all-time highs, portending pressure on stocks
China consumer confidence is inflecting from all-time high – an ominous sign. Historically, Chinese consumer confidence has been highly correlated with China’s 10-year bond yield and stock market return. It has been a reliable indicator for market bottoms in late 1998, late 2008 and early 2016. The buoyant Chinese property market, together with the public propaganda, must have bolstered Chinese consumer confidence to its historical high.
But since late 2017 and early 2018, the confidence has been inflecting from its peak, together with falling bond yields as a reflection of slowing economic growth, and tepid stock market return. As the Chinese economy continues to slow, consumer confidence is likely to fall further in tandem, leaving less confident buyers for stocks – till it reaches its pessimistic extremes.
Chart 9: China’s consumer confidence inflecting at all-time highs, portending pressure on stocks
 ChiNext and small/mid caps’ relative return continue to recover from negative extremes. Since the correction in February, investment style has started to shift, and funds have been rotating from large caps that had outperformed in 2017 into ChiNext and small/mid-caps. They are recovering from their extreme underperformance in 2017, due to technically-oversold condition, improving earnings growth and fund rotation in an environment of dwindling macro liquidity.
Chart 10: ChiNext and Chinese small caps likely to continue to outperform
ChiNext and small/mid caps’ relative return continue to recover from negative extremes. Since the correction in February, investment style has started to shift, and funds have been rotating from large caps that had outperformed in 2017 into ChiNext and small/mid-caps. They are recovering from their extreme underperformance in 2017, due to technically-oversold condition, improving earnings growth and fund rotation in an environment of dwindling macro liquidity.
Chart 10: ChiNext and Chinese small caps likely to continue to outperform
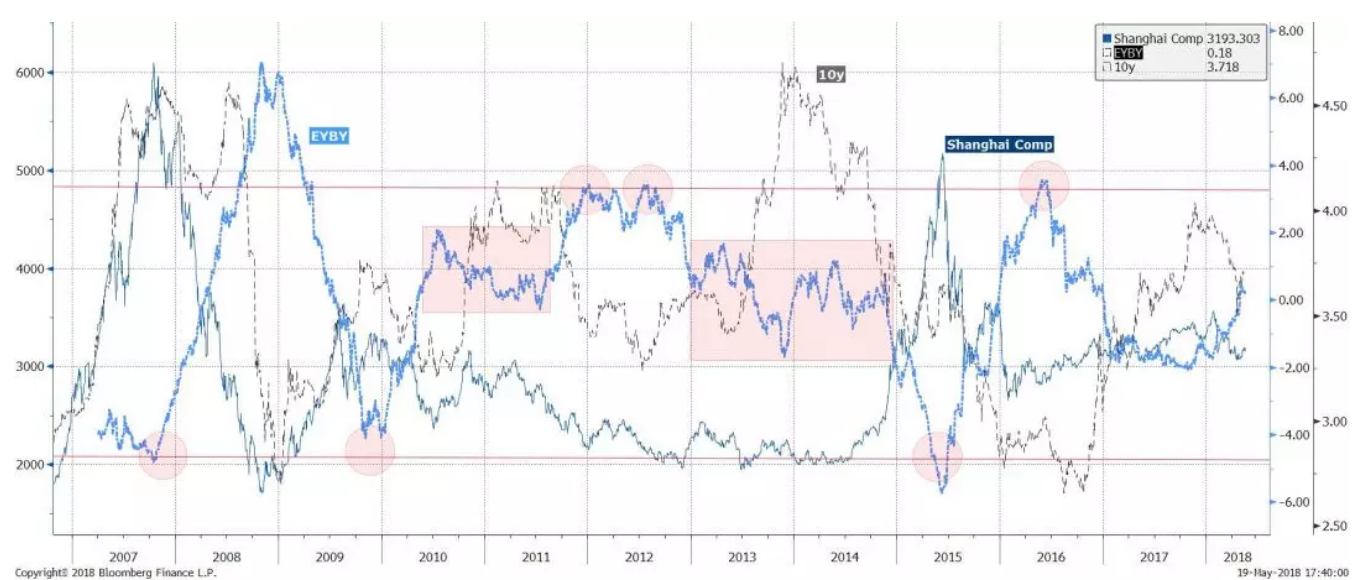
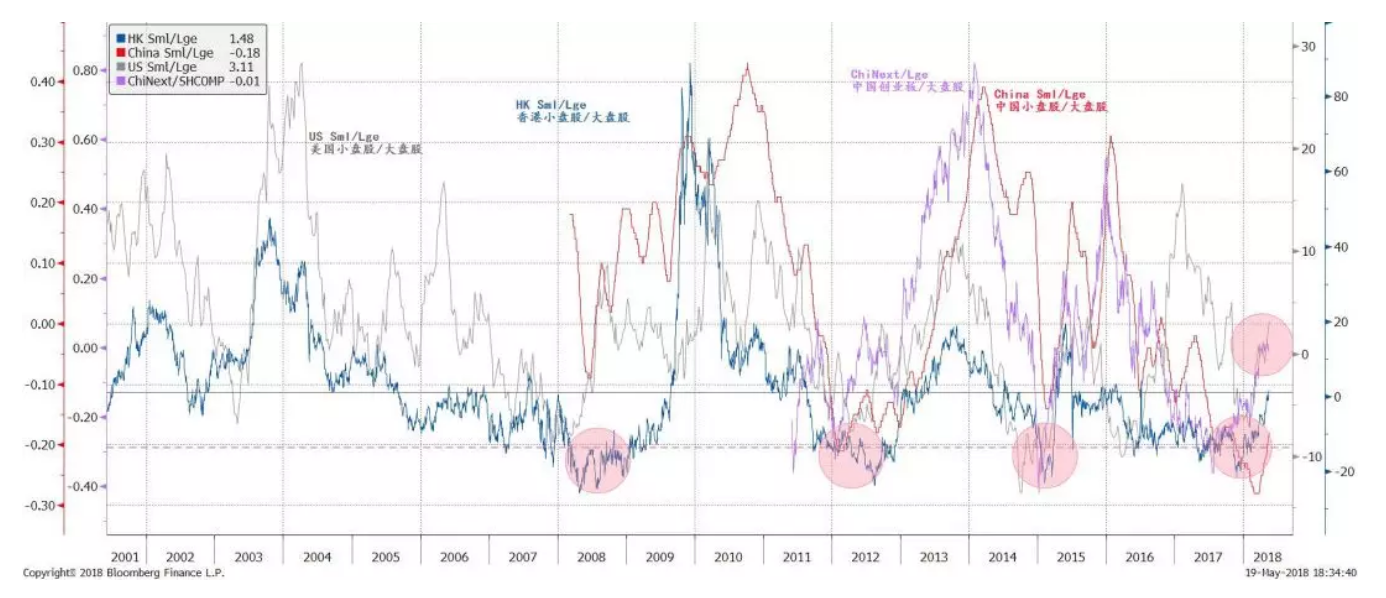 Such relative performance recovery is set to continue, as the trend has not exhausted (Chart 10). And it is likely a global phenomenon in China, Hong Kong and the US market. Lastly, our EYBY model continues to suggest the Shanghai Composite will likely be stuck in a trading range, with a level around 3,300 as the axis of fluctuations (Chart 11). In our 2018 outlook report titled “Outlook 2018: View from the Peak” (20171204), we forecasted the axis of fluctuation to be around 3300, with the Shanghai Composite spending roughly six months or even more under the level of 3300. The Shanghai Composite has spent around four months below 3300 since our forecast.
Chart 11: Our EYBY model suggests the Shanghai Composite to be range bound
Such relative performance recovery is set to continue, as the trend has not exhausted (Chart 10). And it is likely a global phenomenon in China, Hong Kong and the US market. Lastly, our EYBY model continues to suggest the Shanghai Composite will likely be stuck in a trading range, with a level around 3,300 as the axis of fluctuations (Chart 11). In our 2018 outlook report titled “Outlook 2018: View from the Peak” (20171204), we forecasted the axis of fluctuation to be around 3300, with the Shanghai Composite spending roughly six months or even more under the level of 3300. The Shanghai Composite has spent around four months below 3300 since our forecast.
Chart 11: Our EYBY model suggests the Shanghai Composite to be range bound