Fu Xiao and Steve Wang: Reawakening of the Commodity Giant
2017-04-21 IMI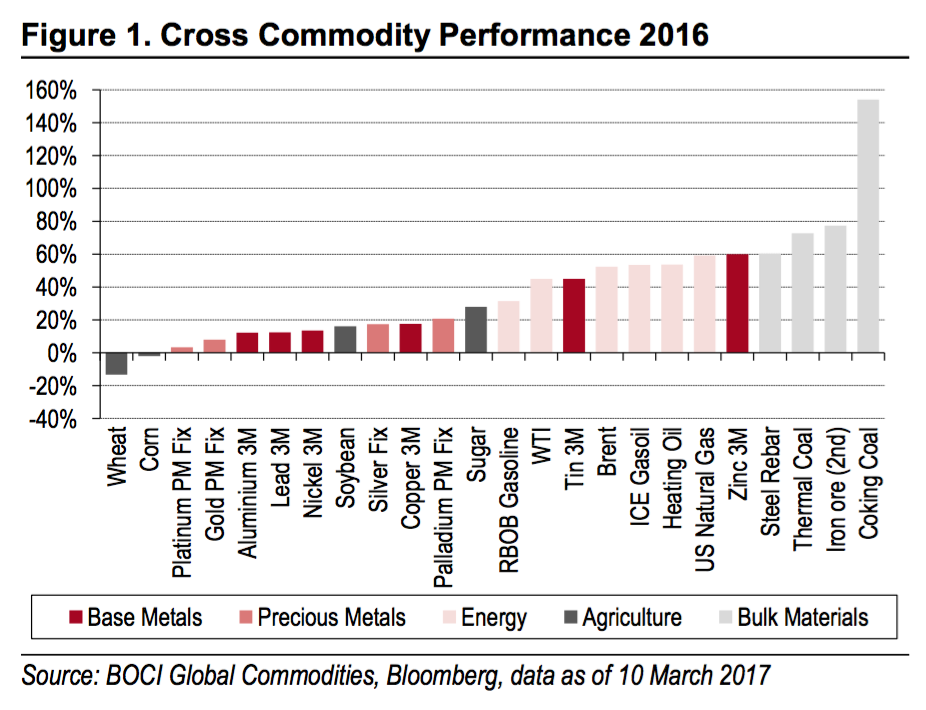
 However, many industries are still plagued by high inventories and excess production capacity. A continuation of the recent rally requires either supply side restraints (for example in oil, copper and steel) or time for demand to catch up (base metals and natural gas).
We Therefore Regard the Following Points as Key for 2017
Firstly, as the US embraces for further tightening, we are likely to see a trend of governments moving from accommodative monetary policy to proactive fiscal policy. In China, infrastructure spending will likely offset a property market slowdown and underpin demand for base metals in 2017. The new comers of India and US could see greenshoots of infrastructure enthusiasm, but the actual impact is likely to be limited over the short term.
However, many industries are still plagued by high inventories and excess production capacity. A continuation of the recent rally requires either supply side restraints (for example in oil, copper and steel) or time for demand to catch up (base metals and natural gas).
We Therefore Regard the Following Points as Key for 2017
Firstly, as the US embraces for further tightening, we are likely to see a trend of governments moving from accommodative monetary policy to proactive fiscal policy. In China, infrastructure spending will likely offset a property market slowdown and underpin demand for base metals in 2017. The new comers of India and US could see greenshoots of infrastructure enthusiasm, but the actual impact is likely to be limited over the short term.
Secondly, China’s supply-side reform was a key theme in 2016. This year, the government will continue to push reforms, tightening capacity in the steel and coal industry.
Thirdly, there is growing uncertainty in major commodity producing countries: In oil, the OPEC vs. shale conflict will continue to define markets. In metals, labour wage negotiations and new government mining policies are making supply dynamics increasingly volatile. 1. Rising Infrastructure Enthusiasm After many years of monetary easing, governments around the world are likely to move from accommodative monetary policy to proactive fiscal policy. Among various fiscal policy tools, infrastructure stimulus will have a more direct impact on commodities. China: A shift from property to infrastructure 2016 marked a strong year for China’s property market. Prices rose by 5-30% across 70 major Chinese cities as a result of record credit growth. Chinese banks extended RMB12.65trn of new RMB loans last year, marking an increase of 7.9% YoY. New household loans (including short-term, medium-term and long-term household loans) reached RMB6.33trn in 2016, representing 62% of total new RMB loans, compared with 33% between 2008 and 2015 (Figure 3).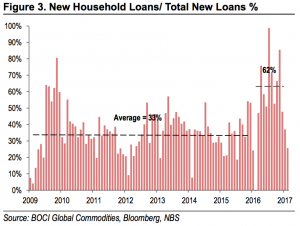
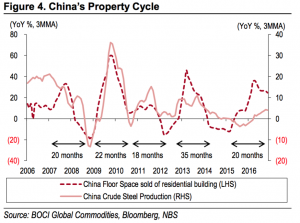 Figure 4 illustrates that China’s floor space sold is normally a leading indicator for crude steel production. However, in 2016, the surge in property sales did not prompt a sharp rise in steel output. Instead, a combination of higher demand and overcapacity cuts in steel across China sparked spectacular rallies in construction materials such as steel, iron ore and base metals.
In 2017, as policymakers pledge to prevent asset bubbles in the increasingly debt-fuelled economy, China’s credit growth is set to moderate in the coming quarters. With the introduction of tightening property policies, our economists expect property investment growth to decrease to below 5% this year.
There are some bright spots in the property sector: (i) while large cities are undergoing severe policy tightening, lower-tier cities continue to enjoy policy support. Destocking in the housing market for tier-3 and tier-4 cities continues; and (ii) the central government will continue to drive shantytown renovation with 6m units planned for launch this year. Authorities will increase subsidies for shantytown relocations, which are expected to boost the sales of homes, autos and durables in related cities.
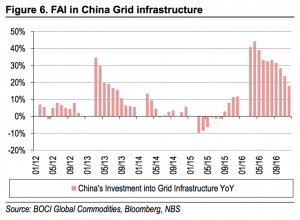
Looking ahead, the market widely expects infrastructure investment to become the government’s buffer to stabilise growth. China’s infrastructure FAI posted a 17.4% YoY gain in 2016. According to China Railway Corporation (CRC), China’s 2016 FAI in railways totalled RMB801.5bn, falling 2.7% YoY. Between 2016 and 2020, China plans to spend RMB3.5trn to build railway tracks. On 4 January, CRC reiterated at an annual conference that it expects 2017 investment to exceed RMB801.5bn for 45 railway projects. China plans to add 2,100km of track this year, mostly in central and western regions, and electrify 4,000km. In terms of highway construction, the Chinese government has promised more spending on rural transportation networks. In terms of power grid investment, according to the National Energy Administration (NEA), China’s investment in grid infrastructure in 2016 reached RMB542.6bn, up 16.9% YoY (Figure 6). According to the NEA, China will invest RMB3.34trn in power grids during the 13th 5YP (2016-20) to support growth.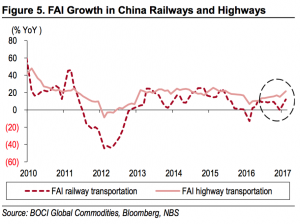
 Trump’s infrastructure plan: magic or mirage?
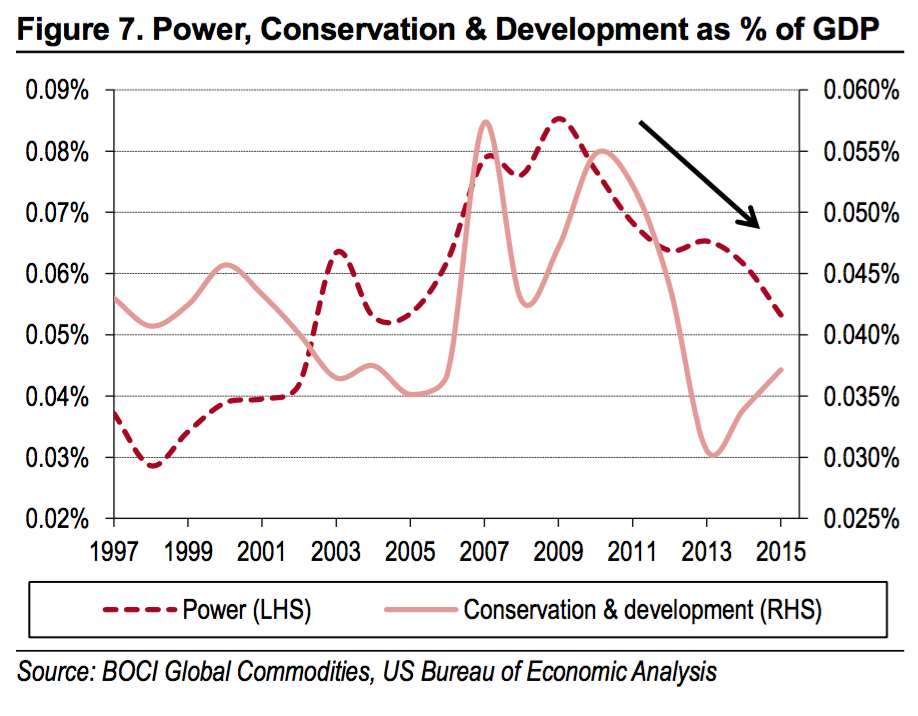
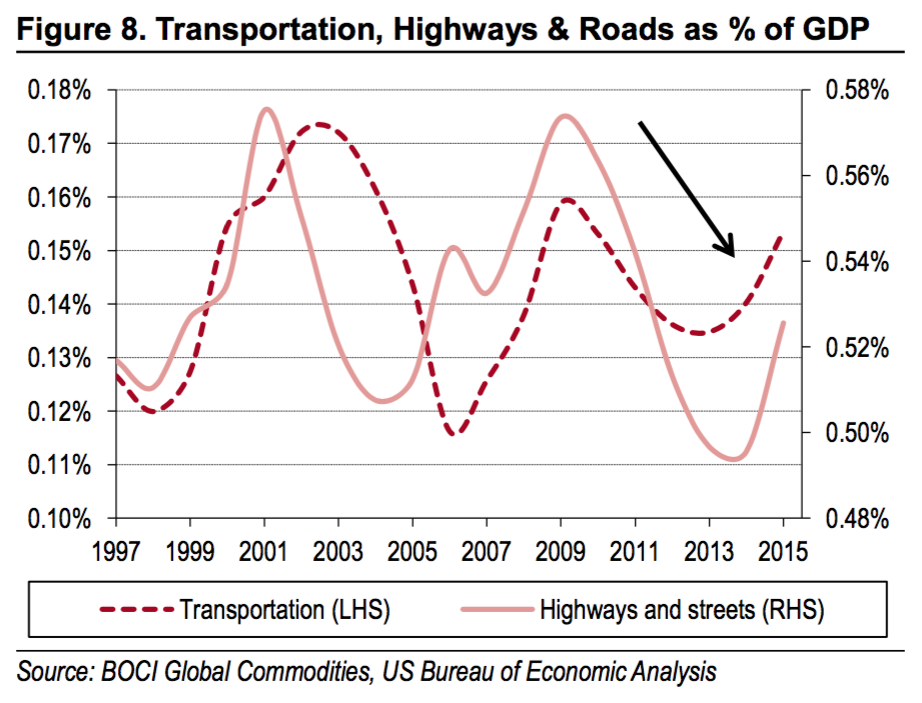
Trump’s pledge to spend US$1trn on the US’ ageing infrastructure over the next 10 years has prompted both praise and scepticism. Most infrastructure projects in the US were constructed in the 1950s and have faced long-term underinvestment. According to the US Bureau of Economic Analysis, spending as a percentage of GDP in US power, transportation, highway and road, conservation and development sectors has fallen steadily in recent years (Figures 7-8). Last year, the American Society of Civil Engineers estimated that inadequate infrastructure spending could cost the US US$4trn in GDP through 2025.
Trump’s infrastructure plan: magic or mirage?
Trump’s pledge to spend US$1trn on the US’ ageing infrastructure over the next 10 years has prompted both praise and scepticism. Most infrastructure projects in the US were constructed in the 1950s and have faced long-term underinvestment. According to the US Bureau of Economic Analysis, spending as a percentage of GDP in US power, transportation, highway and road, conservation and development sectors has fallen steadily in recent years (Figures 7-8). Last year, the American Society of Civil Engineers estimated that inadequate infrastructure spending could cost the US US$4trn in GDP through 2025.
 In Trump’s 100-day action plan, he announced a US$1trn investment in the ‘American Energy and Infrastructure Act’ over ten years. The investment leverages Public-Private Partnership and private investment through tax incentives, making it revenue neutral, i.e. no additional borrowing. However, no further details have been released as of March 2017. Currently, it seems that Republicans have given priority to different aspects of Trump's policy agenda, for example replacing Obamacare and tax reform. This may push back Trump’s infrastructure plan to 2018.
Another consideration is how much demand boost we will see from the infrastructure spending. A closer look into the actual effects of Trump’s plan would suggest smaller movements in commodities prices. First, the US metals market accounts for less than 10% of global demand, while China accounts for 50%. In addition, the US only accounts for 3% of the global seaborne iron ore demand while China makes up 70%. Hence, only major consumption changes of US metal demand would have an impact on the global demand. Based on a back-of-the-envelope calculation, over the next 10 years ie.US$100bn per year can lead to a 6% increase in US steel demand - roughly 0.4% of global steel consumption. Nevertheless, we think if Trump releases further details regarding the infrastructure plan, this will lift market sentiment and attract speculative interest.
India: Green shoots of infrastructure enthusiasm
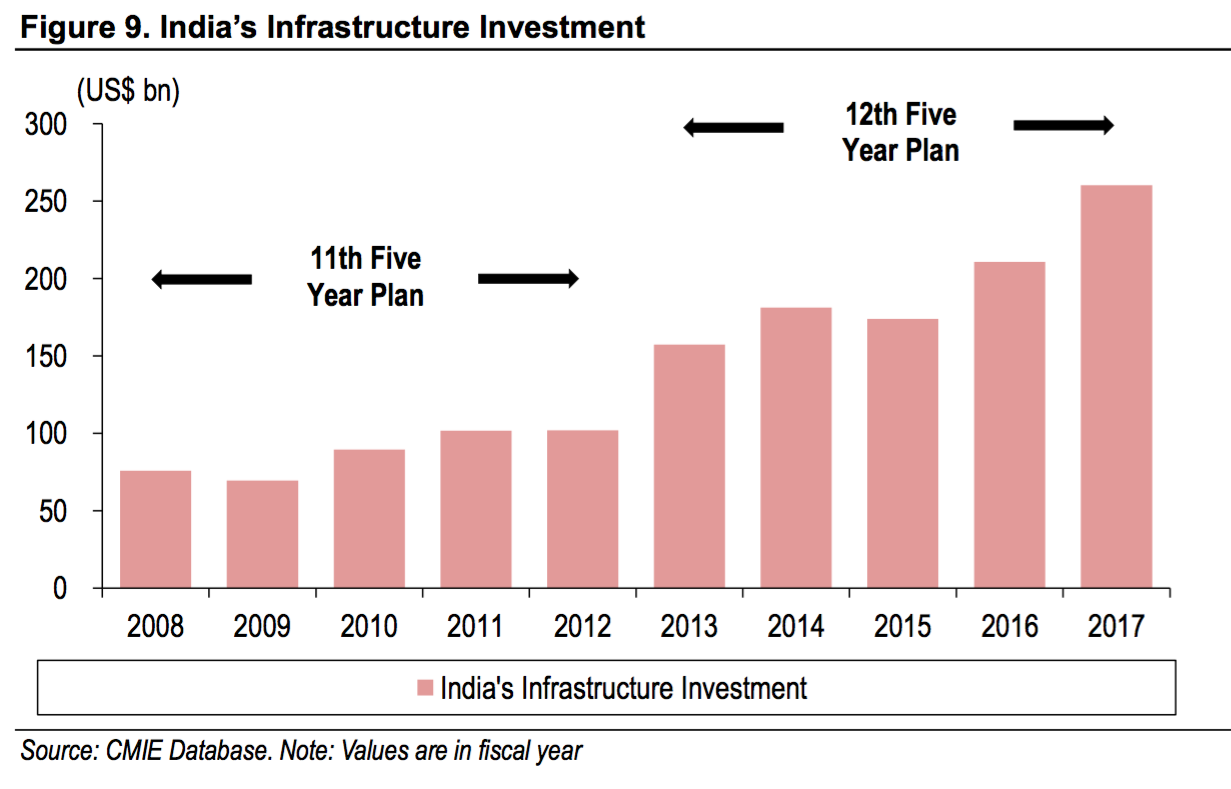
Over the medium term, China’s OBOR global development plan is likely to extend its infrastructure enthusiasm to Asia and other continents. In India, the infrastructure investment cycle had been historically weak as the private corporate sector was struggling with debt overhang and poor profitability whereas the public sector did not invest much. Over the past two years, the government has stepped up actions and public sector investment grew 21% YoY in FY16 with double-digit growth expected in FY17. Various state governments have also taken a lead to boost investment. In terms of infrastructure, India’s investment is estimated to double to about US$1trn during the 12th 5YP (2012-17) compared to the previous FYP. However, we note that India’s steel demand only accounts for 5% of global demand. It will take a few more years of strong infrastructure investment for India to become more influential in the commodities market.
In Trump’s 100-day action plan, he announced a US$1trn investment in the ‘American Energy and Infrastructure Act’ over ten years. The investment leverages Public-Private Partnership and private investment through tax incentives, making it revenue neutral, i.e. no additional borrowing. However, no further details have been released as of March 2017. Currently, it seems that Republicans have given priority to different aspects of Trump's policy agenda, for example replacing Obamacare and tax reform. This may push back Trump’s infrastructure plan to 2018.
Another consideration is how much demand boost we will see from the infrastructure spending. A closer look into the actual effects of Trump’s plan would suggest smaller movements in commodities prices. First, the US metals market accounts for less than 10% of global demand, while China accounts for 50%. In addition, the US only accounts for 3% of the global seaborne iron ore demand while China makes up 70%. Hence, only major consumption changes of US metal demand would have an impact on the global demand. Based on a back-of-the-envelope calculation, over the next 10 years ie.US$100bn per year can lead to a 6% increase in US steel demand - roughly 0.4% of global steel consumption. Nevertheless, we think if Trump releases further details regarding the infrastructure plan, this will lift market sentiment and attract speculative interest.
India: Green shoots of infrastructure enthusiasm
Over the medium term, China’s OBOR global development plan is likely to extend its infrastructure enthusiasm to Asia and other continents. In India, the infrastructure investment cycle had been historically weak as the private corporate sector was struggling with debt overhang and poor profitability whereas the public sector did not invest much. Over the past two years, the government has stepped up actions and public sector investment grew 21% YoY in FY16 with double-digit growth expected in FY17. Various state governments have also taken a lead to boost investment. In terms of infrastructure, India’s investment is estimated to double to about US$1trn during the 12th 5YP (2012-17) compared to the previous FYP. However, we note that India’s steel demand only accounts for 5% of global demand. It will take a few more years of strong infrastructure investment for India to become more influential in the commodities market.
 2. China to Deepen Supply-side Reforms
Steel and iron ore
The year of 2016 witnessed a major turning point for many commodities after years of price slumps and de-stocking. Steel, iron ore and coking coal have been the best performers in the commodity complex, a function of robust property sales, China’s supply side reforms and strong speculative interest. Going forward, China will continue to deepen supply-side reforms. This could provide support to steel and iron ore prices, in our view.
Unprecedented price volatility
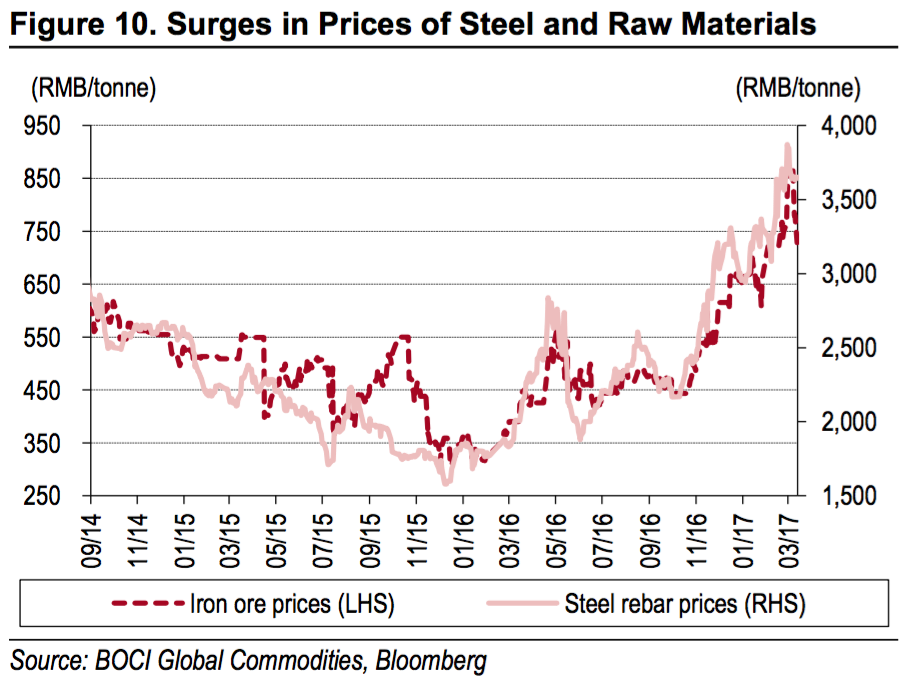
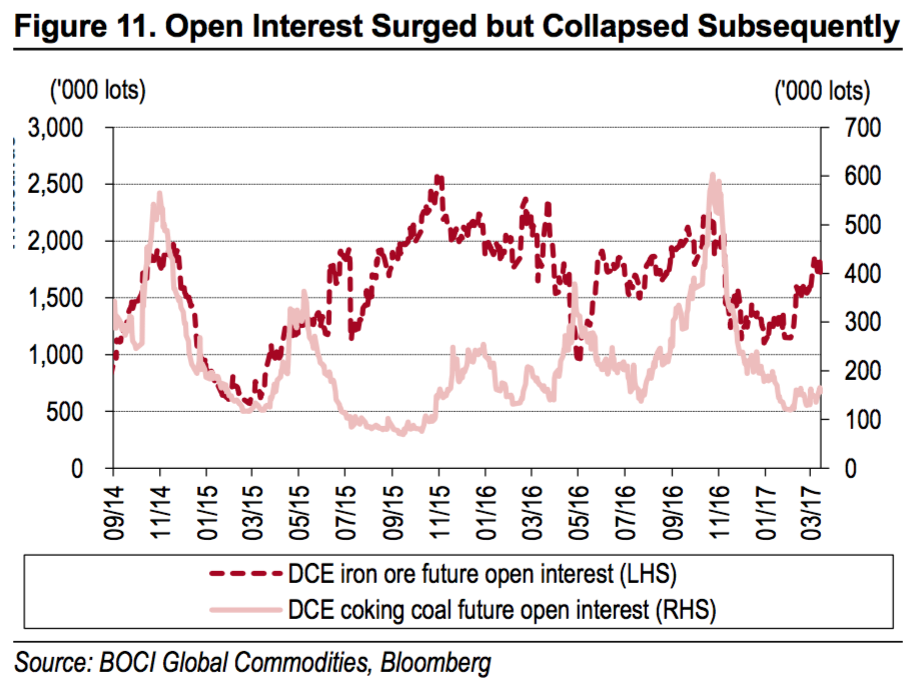
The significant run-up in prices last year was very volatile, driven by speculative interest and new exchange regulations. Figures 10-11 illustrate that iron ore and steel prices rebounded sharply from the beginning of 2016, attracting substantial speculative interest. To curb excess speculation, Chinese regulatory bodies started to impose new restrictions on trading and margin requirements, which caused the prices to drop materially. From 14 April to 6 May, the Dalian Futures Exchange imposed as many as 8 policies to either raise the margin requirement, price limit or commission fee.
After 1-2 months of consolidation, prices started to gradually build up and at end-October prices far exceeded their previous high points. Last November, both exchanges imposed another round of regulatory controls, raising margin requirements. This time, unlike April, the price response was limited. The market was supported by expectations of the government’s anti-pollution policies and deepening supply reform in 2017.
2. China to Deepen Supply-side Reforms
Steel and iron ore
The year of 2016 witnessed a major turning point for many commodities after years of price slumps and de-stocking. Steel, iron ore and coking coal have been the best performers in the commodity complex, a function of robust property sales, China’s supply side reforms and strong speculative interest. Going forward, China will continue to deepen supply-side reforms. This could provide support to steel and iron ore prices, in our view.
Unprecedented price volatility
The significant run-up in prices last year was very volatile, driven by speculative interest and new exchange regulations. Figures 10-11 illustrate that iron ore and steel prices rebounded sharply from the beginning of 2016, attracting substantial speculative interest. To curb excess speculation, Chinese regulatory bodies started to impose new restrictions on trading and margin requirements, which caused the prices to drop materially. From 14 April to 6 May, the Dalian Futures Exchange imposed as many as 8 policies to either raise the margin requirement, price limit or commission fee.
After 1-2 months of consolidation, prices started to gradually build up and at end-October prices far exceeded their previous high points. Last November, both exchanges imposed another round of regulatory controls, raising margin requirements. This time, unlike April, the price response was limited. The market was supported by expectations of the government’s anti-pollution policies and deepening supply reform in 2017.
 Capacity cuts
Despite many difficulties, China successfully exceeded its reduction targets by cutting steel and coal capacity by 65mt (target 45mt) and 290mt (target 250mt) respectively for 2016, tightening supply & demand balances. According to the “Two Sessions”, China will cut steel capacity by 50mt and coal capacity by more than 150mt this year. In addition, China plans to reduce more than 50m KW of coal-fired power plants.
In the 13th 5YP, China plans to cut steel capacity by 100-150mt to bring total capacity to below 1,000mt by 2020. Similarly, coal capacity is expected to be cut by 500mt over the next 3-4 years. If China meets or exceeds its target this year, it will constitute the majority of the 2020 target. In fact, the cuts this year can have a large impact as 73.5% of the capacity closed in 2016 had already stopped operation. Deepening supply-side reforms will have a more profound impact on inventory and supply this year.
Apart from supply side reforms, stricter environmental regulations and investigations by the Ministry of Environmental Protection throughout the year, especially in winter, have pushed local governments and companies to close down capacities. China ordered curbs on steel and aluminium output in northern cities during the winter heating season as it steps up its fight against air pollution: The cuts consist of halving steel capacity in four major cities, including the top producer Tangshan in Hebei province. This follows a directive that China ordered steel mills in northern Hebei province and Tianjin municipality to curb output to ensure air quality during the annual meeting of parliament in Beijing in early March 2017.
M&A in the steel sector
Last year, China’s second-largest steel producer Baosteel (with production of 34.94mt in 2015) and the fifth-largest steel producer Wuhan Steel (with production of 25.78mt in 2015) announced to merge in September. The new company, Baowu Steel, has become the second largest steel producer in the world, exceeding Hebei Steel. The M&A was mainly pushed forward by the government in response to the State Council and MIIT’s plan to enhance efficiency in the steel industry. According to the State Council, by 2025, the steel sector is targeted to reduce the number of major steel companies (capacity >10mt) to 1-2, medium-sized steel companies (capacity >5mt) to 3-5, and small-sized specialised companies to 6-8.
Raw material supplies
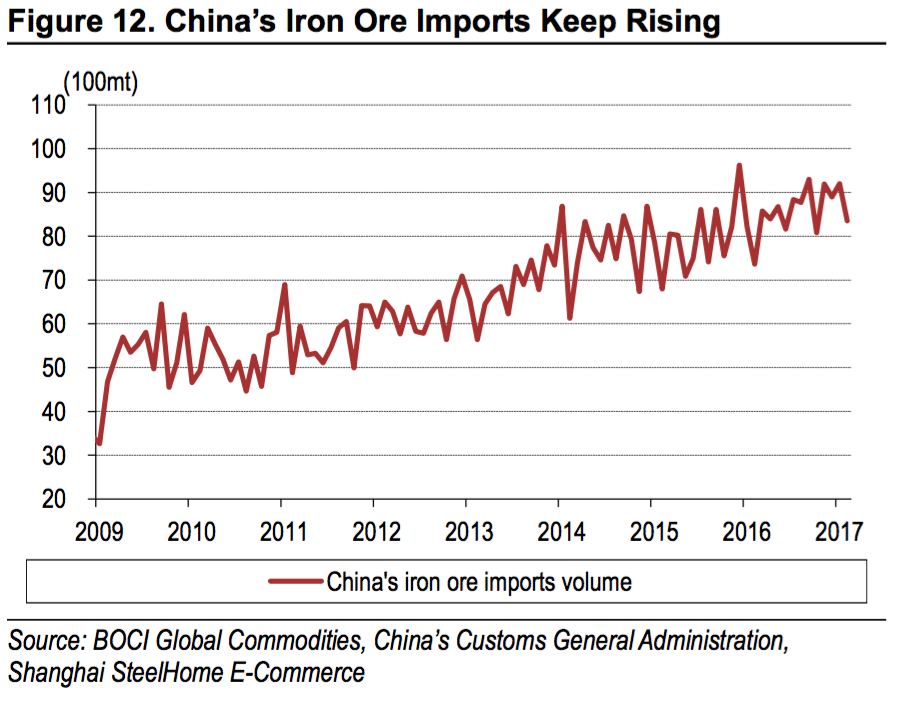
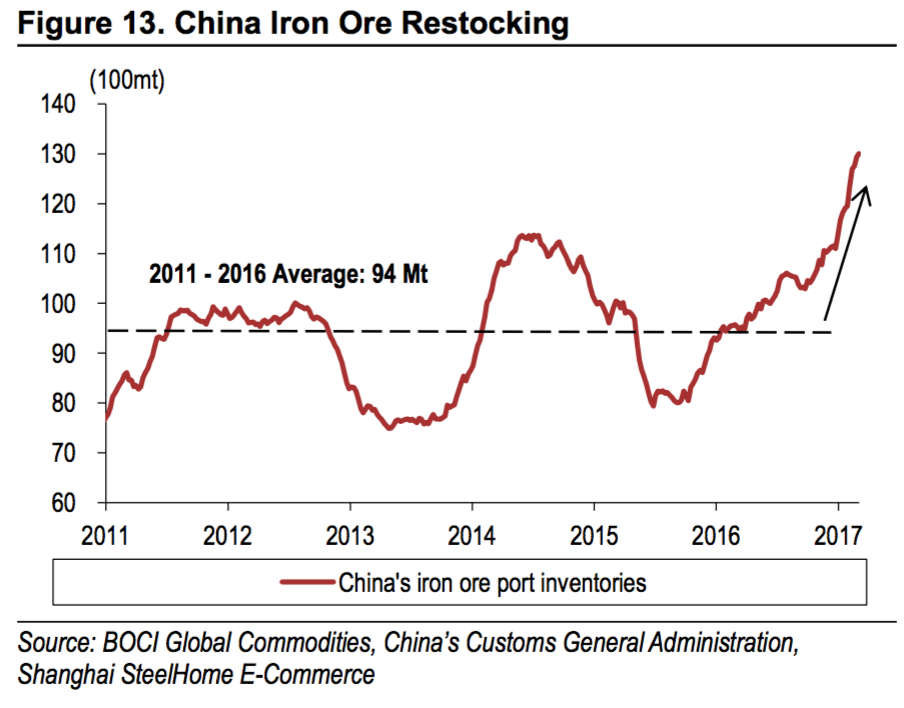
Stiffer environmental restrictions have also resulted in a shift in demand patterns. High-grade iron ore lumps are preferred to iron ore fines. China’s domestic iron ore production continues to struggle. As a result, China’s iron ore imports have been very strong, an indication of restocking. In 2H17, the big four (Rio Tinto [RIO LN], BHP [BHPAU], Vale [VALE5BZ]and FMG [FMG AU]) and other Australian and Brazilian mid-tier producers could ramp up high-grade iron ore production, easing market tightness.
Capacity cuts
Despite many difficulties, China successfully exceeded its reduction targets by cutting steel and coal capacity by 65mt (target 45mt) and 290mt (target 250mt) respectively for 2016, tightening supply & demand balances. According to the “Two Sessions”, China will cut steel capacity by 50mt and coal capacity by more than 150mt this year. In addition, China plans to reduce more than 50m KW of coal-fired power plants.
In the 13th 5YP, China plans to cut steel capacity by 100-150mt to bring total capacity to below 1,000mt by 2020. Similarly, coal capacity is expected to be cut by 500mt over the next 3-4 years. If China meets or exceeds its target this year, it will constitute the majority of the 2020 target. In fact, the cuts this year can have a large impact as 73.5% of the capacity closed in 2016 had already stopped operation. Deepening supply-side reforms will have a more profound impact on inventory and supply this year.
Apart from supply side reforms, stricter environmental regulations and investigations by the Ministry of Environmental Protection throughout the year, especially in winter, have pushed local governments and companies to close down capacities. China ordered curbs on steel and aluminium output in northern cities during the winter heating season as it steps up its fight against air pollution: The cuts consist of halving steel capacity in four major cities, including the top producer Tangshan in Hebei province. This follows a directive that China ordered steel mills in northern Hebei province and Tianjin municipality to curb output to ensure air quality during the annual meeting of parliament in Beijing in early March 2017.
M&A in the steel sector
Last year, China’s second-largest steel producer Baosteel (with production of 34.94mt in 2015) and the fifth-largest steel producer Wuhan Steel (with production of 25.78mt in 2015) announced to merge in September. The new company, Baowu Steel, has become the second largest steel producer in the world, exceeding Hebei Steel. The M&A was mainly pushed forward by the government in response to the State Council and MIIT’s plan to enhance efficiency in the steel industry. According to the State Council, by 2025, the steel sector is targeted to reduce the number of major steel companies (capacity >10mt) to 1-2, medium-sized steel companies (capacity >5mt) to 3-5, and small-sized specialised companies to 6-8.
Raw material supplies
Stiffer environmental restrictions have also resulted in a shift in demand patterns. High-grade iron ore lumps are preferred to iron ore fines. China’s domestic iron ore production continues to struggle. As a result, China’s iron ore imports have been very strong, an indication of restocking. In 2H17, the big four (Rio Tinto [RIO LN], BHP [BHPAU], Vale [VALE5BZ]and FMG [FMG AU]) and other Australian and Brazilian mid-tier producers could ramp up high-grade iron ore production, easing market tightness.
 3. Volatile Supply Dynamics
Crude oil: OPEC vs.shale conflict
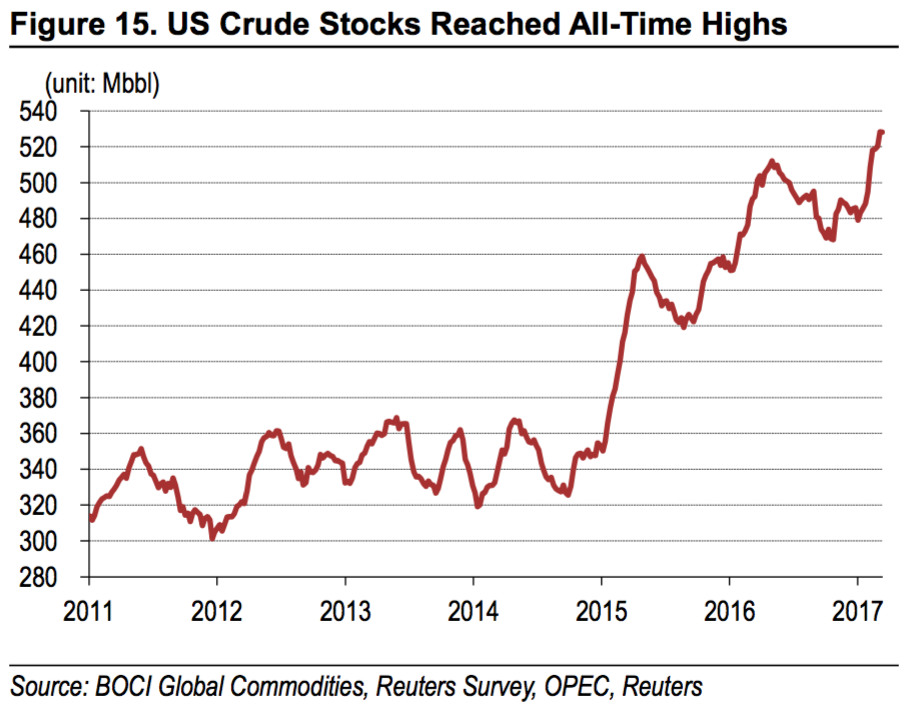
After a flash rally post-OPEC production cuts, crude prices have been trading in a range of US$50-55/bbl. In the US, higher crude prices stimulated a recovery in shale production, and we have seen stocks built up to all-time highs. During 2017, we believe OPEC and US shale are the main drivers of supply, and we will focus on the actions of OPEC versus the US market.
OPEC production cuts
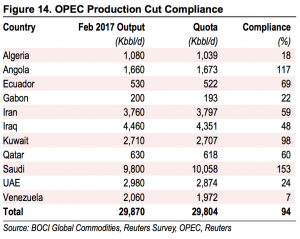
During the Vienna talks in November 2016, OPEC reached an agreement to cut production from January this year for at least six months. Several non-OPEC countries including Russia also joined the production-cut deal in early December. The OPEC deal required 11 OPEC members (see figure below) to reduce crude production to 29.8mbbl/d from January 2017, whereas Nigeria and Libya are exempt from any cuts. In the second month of execution, supply from the 11 members declined to 29.87Mbbl/d, equivalent to 94% compliance.
Historically, compliance with the quota generally got off to a good start. During all recent OPEC agreements, the first two months show the highest degree of compliance. However, shortly afterwards, as higher oil prices make restraints costly, compliance started to decline and barrels seep back into the market. Putting the precarious state of OPEC’s consensus in context of a revival in US shale production, we would be surprised to see compliance and consensus hold throughout the year.
3. Volatile Supply Dynamics
Crude oil: OPEC vs.shale conflict
After a flash rally post-OPEC production cuts, crude prices have been trading in a range of US$50-55/bbl. In the US, higher crude prices stimulated a recovery in shale production, and we have seen stocks built up to all-time highs. During 2017, we believe OPEC and US shale are the main drivers of supply, and we will focus on the actions of OPEC versus the US market.
OPEC production cuts
During the Vienna talks in November 2016, OPEC reached an agreement to cut production from January this year for at least six months. Several non-OPEC countries including Russia also joined the production-cut deal in early December. The OPEC deal required 11 OPEC members (see figure below) to reduce crude production to 29.8mbbl/d from January 2017, whereas Nigeria and Libya are exempt from any cuts. In the second month of execution, supply from the 11 members declined to 29.87Mbbl/d, equivalent to 94% compliance.
Historically, compliance with the quota generally got off to a good start. During all recent OPEC agreements, the first two months show the highest degree of compliance. However, shortly afterwards, as higher oil prices make restraints costly, compliance started to decline and barrels seep back into the market. Putting the precarious state of OPEC’s consensus in context of a revival in US shale production, we would be surprised to see compliance and consensus hold throughout the year.
 US crude stocks refreshed record highs
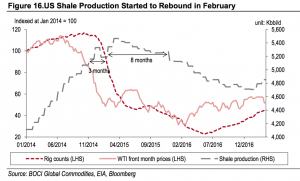
In the US market, commercial crude oil stocks continued to build in the first two months of this year, reaching an all-time high. Thanks to a continuous recovery in oil rigs, crude producers have contributed 260kbbl/d more crude production to the US market so far this year. The decline in shale production halted in February, due to higher output in the Permian basin. In the March Short-Term Energy Outlook, the EIA expects US crude output to rise by 330Kbbl/d this year, particularly driven by higher onshore output.
The OPEC tightening should result in less crude imports in the US, but so far there are few signs of OPEC restraint yet. In additional to domestic supply, imports from OPEC to coastal PADDs accumulated more crude in US stockpiles. OPEC members ramped up their crude production and exports before the execution of the production cut deal, leading to more shipments to the US Gulf Coast in January and February.
OPEC cuts emerge in earnest in the US
The US Gulf Coast will return to full capacity during late-1Q17 or early 2Q17. With outright prices still low, recovering product demand ought to face a market where seaborne crude supply is tight, whereas shale is rebounding, however not yet enough to take the pressure off stocks.
We estimate OPEC will reduce shipments to the US, of which we expect the majority of cuts to be made in Gulf Coast-bound. Outside the US, Europe faces a larger supply contraction, likely making US crude exports to Europe profitable.
Historically, shale production followed rig counts with an eight month delay and we think it is not going to be any slower this time around. However, rig counts are – at this point in time – ramping up as the forward guidance now seems to be realised in lower stocks and as hard evidence of a tighter market emerges.
During the same time, OPEC has to convene to prolong their production restraint. We believe the meeting will be marred by contention to compliance with the current agreement, with Venezuela, Iraq and Iran being our “favourites” to out-produce their quota. However, we think OPEC will roll over their agreement. Hence, late-2Q17 is the point during the summer when we think prices will have the largest upward pressure, with Saudi exports seasonally falling on direct crude burn during the summer month: The market will face additional tightening ahead of the agreement.
US crude stocks refreshed record highs
In the US market, commercial crude oil stocks continued to build in the first two months of this year, reaching an all-time high. Thanks to a continuous recovery in oil rigs, crude producers have contributed 260kbbl/d more crude production to the US market so far this year. The decline in shale production halted in February, due to higher output in the Permian basin. In the March Short-Term Energy Outlook, the EIA expects US crude output to rise by 330Kbbl/d this year, particularly driven by higher onshore output.
The OPEC tightening should result in less crude imports in the US, but so far there are few signs of OPEC restraint yet. In additional to domestic supply, imports from OPEC to coastal PADDs accumulated more crude in US stockpiles. OPEC members ramped up their crude production and exports before the execution of the production cut deal, leading to more shipments to the US Gulf Coast in January and February.
OPEC cuts emerge in earnest in the US
The US Gulf Coast will return to full capacity during late-1Q17 or early 2Q17. With outright prices still low, recovering product demand ought to face a market where seaborne crude supply is tight, whereas shale is rebounding, however not yet enough to take the pressure off stocks.
We estimate OPEC will reduce shipments to the US, of which we expect the majority of cuts to be made in Gulf Coast-bound. Outside the US, Europe faces a larger supply contraction, likely making US crude exports to Europe profitable.
Historically, shale production followed rig counts with an eight month delay and we think it is not going to be any slower this time around. However, rig counts are – at this point in time – ramping up as the forward guidance now seems to be realised in lower stocks and as hard evidence of a tighter market emerges.
During the same time, OPEC has to convene to prolong their production restraint. We believe the meeting will be marred by contention to compliance with the current agreement, with Venezuela, Iraq and Iran being our “favourites” to out-produce their quota. However, we think OPEC will roll over their agreement. Hence, late-2Q17 is the point during the summer when we think prices will have the largest upward pressure, with Saudi exports seasonally falling on direct crude burn during the summer month: The market will face additional tightening ahead of the agreement.
 Overall, we believe prices will remain in a range where US$60/bbl forms a soft top on shale optimism and a roll-over of the OPEC agreement. OPEC statements ahead of the agreement and increased interest in the speculative community should also provide a firm floor. Having said that, we think risk/reward is skewed to the upside as stocks draws bite.
Copper: red storm
Copper stunned the market, rallying US$1,500 since 4Q16, as a more favourable outlook on China’s economy coincided with supply-side constraints. According to the International Copper Study Group (ICSG), due to a lack of new large projects, global copper mine production growth will halt in 2017, falling to 0%. In addition, we expect new government mining policies to introduce uncertainty and wage negotiation could be quite tough this year. In this section, we outline a number of large mine disruptions in the copper market.
New government mining policies
Freeport’s Grasberg copper mine is the world’s second largest mine with copper production of 635kt in 2016. On 12 January, Indonesia halted Freeport’s exports of copper concentrate, as the government issued rules requiring foreign miners to obtain new mining rights before being allowed to export. Within the new rules, the Indonesian government demanded that Freeport divest 51% of its stakes to local units. The big shift in stakes resulted in no agreements between the government and the company.
Although Freeport planned to restart some operations at Grasberg in order to supply semi-processed ore to a local smelter, exports of concentrate remain suspended and the government's tough stance on divestment rules indicates the suspension could be lengthy.
Increasing labour strikes
Escondida is the largest copper mine in the world, producing 1.0mt of copper last year. Workers at Escondida went on strike on 9 February after voting to reject the company’s wage offer. BHP declared force majeure on the second day of the strike as Escondida cannot meet contractual obligations on metals shipments. On 13 March, the union on strike rejected an invitation by the company to return to negotiations as worker demands were not adequately addressed. This was the third failed attempt to restart dialogue between the parties during the strike. As wage negotiation at Escondida is viewed as a benchmark for other miners, any failure could result in additional strikes later this year.
In Peru, workers at Freeport’s Cerro Verde mine, one of the largest copper producers, started an indefinite strike on 10 March to demand family health benefits and a bigger share of the mine’s profits. Furthermore, in early February a 5-day protest in Peru blocked the road used by MMG to transport copper concentrates from its Las Bambas mine.
Disclaimer: This article is for information only and does not constitute investment advice. Neither BOCI Macro and Strategy Research nor the authors themselves are responsible for any losses.
Overall, we believe prices will remain in a range where US$60/bbl forms a soft top on shale optimism and a roll-over of the OPEC agreement. OPEC statements ahead of the agreement and increased interest in the speculative community should also provide a firm floor. Having said that, we think risk/reward is skewed to the upside as stocks draws bite.
Copper: red storm
Copper stunned the market, rallying US$1,500 since 4Q16, as a more favourable outlook on China’s economy coincided with supply-side constraints. According to the International Copper Study Group (ICSG), due to a lack of new large projects, global copper mine production growth will halt in 2017, falling to 0%. In addition, we expect new government mining policies to introduce uncertainty and wage negotiation could be quite tough this year. In this section, we outline a number of large mine disruptions in the copper market.
New government mining policies
Freeport’s Grasberg copper mine is the world’s second largest mine with copper production of 635kt in 2016. On 12 January, Indonesia halted Freeport’s exports of copper concentrate, as the government issued rules requiring foreign miners to obtain new mining rights before being allowed to export. Within the new rules, the Indonesian government demanded that Freeport divest 51% of its stakes to local units. The big shift in stakes resulted in no agreements between the government and the company.
Although Freeport planned to restart some operations at Grasberg in order to supply semi-processed ore to a local smelter, exports of concentrate remain suspended and the government's tough stance on divestment rules indicates the suspension could be lengthy.
Increasing labour strikes
Escondida is the largest copper mine in the world, producing 1.0mt of copper last year. Workers at Escondida went on strike on 9 February after voting to reject the company’s wage offer. BHP declared force majeure on the second day of the strike as Escondida cannot meet contractual obligations on metals shipments. On 13 March, the union on strike rejected an invitation by the company to return to negotiations as worker demands were not adequately addressed. This was the third failed attempt to restart dialogue between the parties during the strike. As wage negotiation at Escondida is viewed as a benchmark for other miners, any failure could result in additional strikes later this year.
In Peru, workers at Freeport’s Cerro Verde mine, one of the largest copper producers, started an indefinite strike on 10 March to demand family health benefits and a bigger share of the mine’s profits. Furthermore, in early February a 5-day protest in Peru blocked the road used by MMG to transport copper concentrates from its Las Bambas mine.
Disclaimer: This article is for information only and does not constitute investment advice. Neither BOCI Macro and Strategy Research nor the authors themselves are responsible for any losses.
