Steve Wang, Wu Qiong and Zoe Chuang: New Direction of Bond Market
2017-04-07 IMI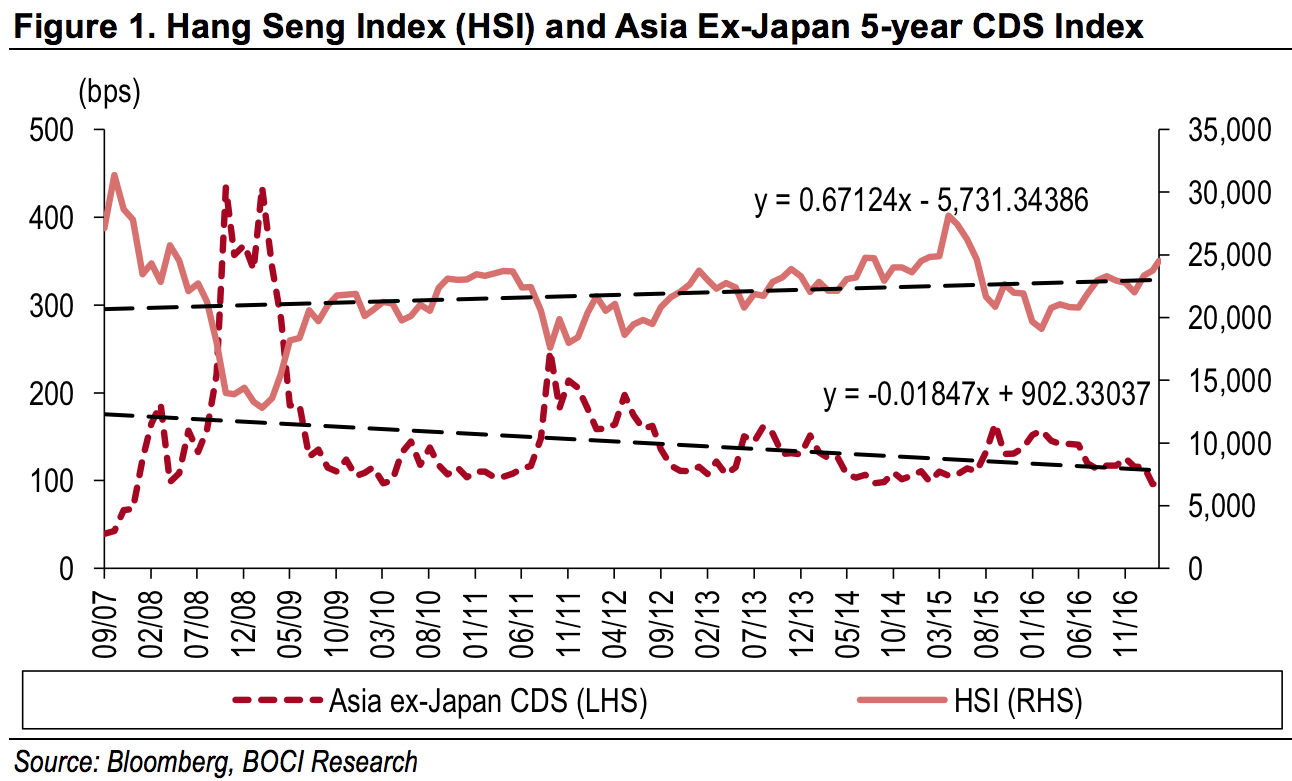
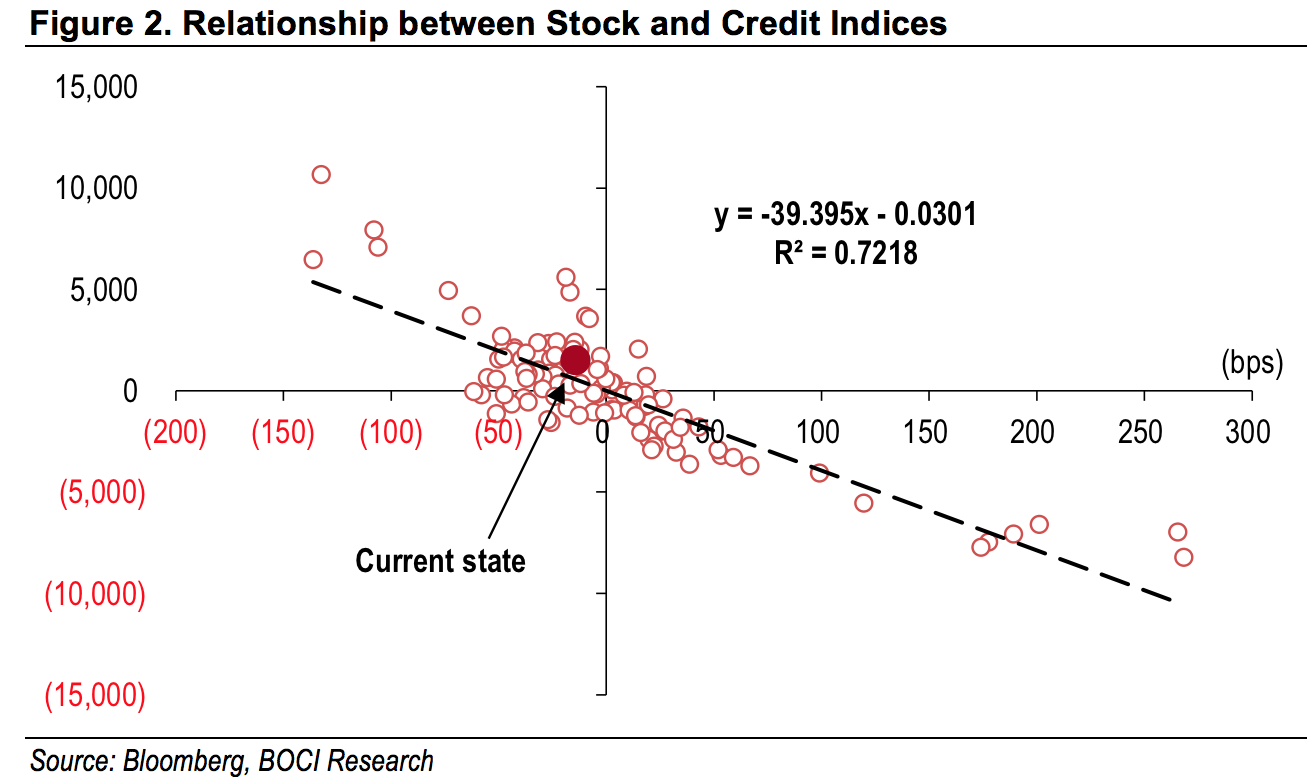 The recent trend patterns of these two indices hold up this relationship well. The stock index has been going up while the credit spread has been coming down. Over the data length, the current state of the relationship is still very close to the trend level, which means the two indices have ample room to extend their recent trends to reach higher grounds.
As we have mentioned earlier, the two markets can positively enforce each other in an up-cycle (or negatively in a down-cycle). If the stock market moves further higher, we will see further reduction of credit risks in the market and in the economy. Moreover, a further reduction in credit risks will encourage more credit extensions from lenders and investors to corporations and to the economy. Increased credit resources will fuel further corporate investment and expansion, until the “music” stops on over-loaded debt burdens.
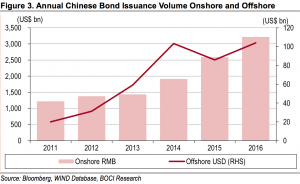
The Chinese bond market has remained sizzling in 2017 after a record year in 2016 (Figure 3). The offshore USD bond issuance from Chinese borrowers has been very active YTD, as Chinese credit spreads are getting tighter and overseas investors have shown more appetite for Chinese bonds. Bond issuance in the domestic bond market also recorded a new high in 2016, and more foreign investors have been attracted to the market in recent years. This, in part, reflects the fact that the Chinese economy appears to have stabilised and is possibly making a turn for the better, and foreign investors are showing more confidence in the Chinese market, including the domestic bond market.
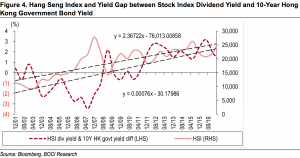
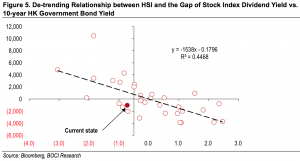 The current state of this stock-bond relationship is also close to the trend level, which means both have the potential to continue further with the current trend pattern. In other words, the stock prices can move further up and the government bond yield could also rise higher. With the US Fed now settled into a rate hiking path, the HK government bond yield is likely to eventually move to a higher ground with the Fed. When the attractiveness of stock dividend becomes lower, investors will look more for capital gains on a stock. This forms another positive feedback to enforce the up-cycle of the Hong Kong stock market.
Relative Value of Chinese Credits
Chinese USD bonds now make up a large share of the Asia USD bond market. In 2016, Chinese issuers contributed over 60% of the total new issuance volume of the Asia ex-Japan region. The continuous growth in the size and depth of this segment in the global credit market has attracted increasing participation from international investors.
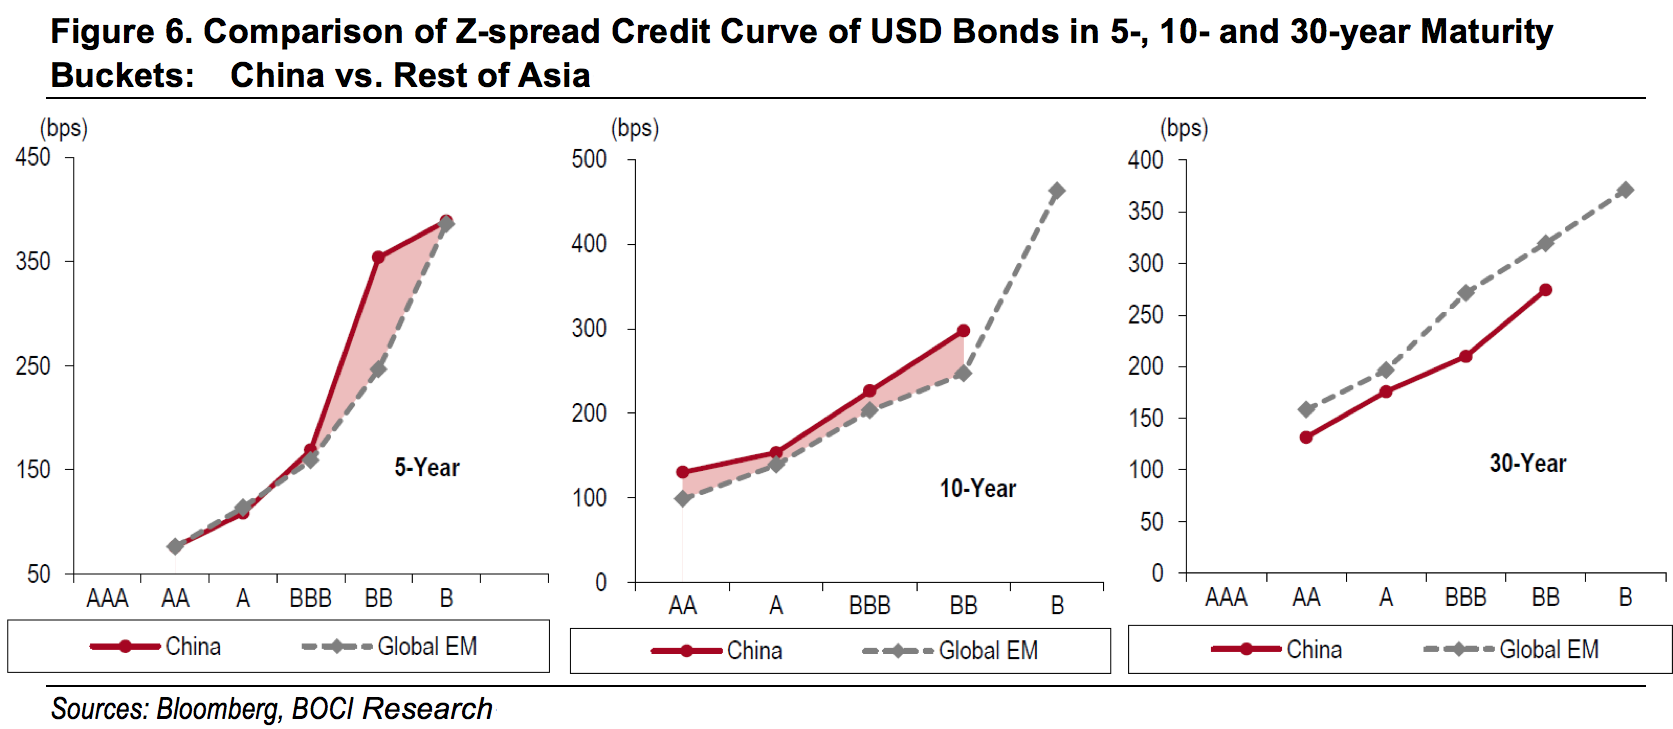
We compare the current relative values of Chinese USD bonds with the global EM (emerging market) bonds (see Figure 6). In the 5-year space, the IG Chinese USD bonds trade essentially in line with the overall IG EM bonds, while the HY Chinese bonds trade much cheaper. The 5-year tenor has been the most popular issuance sector for Chinese issuers, and the good liquidity and variety in this sector, particularly in the IG space, have drawn the highest interest and focus from international investors. Meanwhile, the continually-cautious approach of many international investors towards Chinese credit investment has also driven their investment choices largely in the IG segment of the market, making this part of the Chinese credit curve crowded and quite comparable to the global EM credit market.
In the 10-year space, Chinese bonds overall trade cheaper than their EM peers across the curve. Most of the 10-year supply from Chinese issuers is in the IG sector. However, demand for 10-year bonds is relatively low as compared to 5-year Chinese bonds. This is particularly acute for credit investors from China, who have become a very important investor force for Chinese USD bonds in the recent years. Their investment interests in 10-year bonds are still limited. We think it is the relatively low investment interests in the 10-year Chinese bonds that have resulted in the cheapness of this sector.
In the 30-year space, there is very limited supply from Chinese issuers. Only the high-quality Chinese issuers issue 30-year bonds, plus a few perpetual bonds from lower-rated issuers. On the other hand, demand for high-quality Chinese 30-year USD bonds has been on the rise in recent years, from both Asian insurance funds and China’s own insurance investors as well. The demand/supply imbalance both on global and regional basis probably has contributed to the relatively richness of the Chinese 30-year curve over the global EM curve.
The current state of this stock-bond relationship is also close to the trend level, which means both have the potential to continue further with the current trend pattern. In other words, the stock prices can move further up and the government bond yield could also rise higher. With the US Fed now settled into a rate hiking path, the HK government bond yield is likely to eventually move to a higher ground with the Fed. When the attractiveness of stock dividend becomes lower, investors will look more for capital gains on a stock. This forms another positive feedback to enforce the up-cycle of the Hong Kong stock market.
Relative Value of Chinese Credits
Chinese USD bonds now make up a large share of the Asia USD bond market. In 2016, Chinese issuers contributed over 60% of the total new issuance volume of the Asia ex-Japan region. The continuous growth in the size and depth of this segment in the global credit market has attracted increasing participation from international investors.
We compare the current relative values of Chinese USD bonds with the global EM (emerging market) bonds (see Figure 6). In the 5-year space, the IG Chinese USD bonds trade essentially in line with the overall IG EM bonds, while the HY Chinese bonds trade much cheaper. The 5-year tenor has been the most popular issuance sector for Chinese issuers, and the good liquidity and variety in this sector, particularly in the IG space, have drawn the highest interest and focus from international investors. Meanwhile, the continually-cautious approach of many international investors towards Chinese credit investment has also driven their investment choices largely in the IG segment of the market, making this part of the Chinese credit curve crowded and quite comparable to the global EM credit market.
In the 10-year space, Chinese bonds overall trade cheaper than their EM peers across the curve. Most of the 10-year supply from Chinese issuers is in the IG sector. However, demand for 10-year bonds is relatively low as compared to 5-year Chinese bonds. This is particularly acute for credit investors from China, who have become a very important investor force for Chinese USD bonds in the recent years. Their investment interests in 10-year bonds are still limited. We think it is the relatively low investment interests in the 10-year Chinese bonds that have resulted in the cheapness of this sector.
In the 30-year space, there is very limited supply from Chinese issuers. Only the high-quality Chinese issuers issue 30-year bonds, plus a few perpetual bonds from lower-rated issuers. On the other hand, demand for high-quality Chinese 30-year USD bonds has been on the rise in recent years, from both Asian insurance funds and China’s own insurance investors as well. The demand/supply imbalance both on global and regional basis probably has contributed to the relatively richness of the Chinese 30-year curve over the global EM curve.
 Disclaimer: This article is for information only and does not constitute investment advice. Neither BOCI Macro and Strategy Research nor the authors themselves are responsible for any losses.
