Dong Jinyue and Xia Le: De-Sinicization of Global Value Chain after COVID-19
2020-06-09 IMI
Multinational firms seek value chain diversification outside of China after COVID-19
The catastrophic spread of COVID-19, along with the high and ever-rising death toll around the world, is set to cause a global economic recession. The market reckons that the COVID-19 pandemic will have an enormous impact on global economic growth, at least comparable to the 2008-2009 global financial crisis (GFC). COVID-19 also has led multinational firms to reconsider their global structure with various aims, in particular to diversify their supply and production chains back to their own countries in order to stimulate the domestic economy, as well as to safeguard public health amid the COVID-19 pandemic and afterwards. This has reignited a longstanding discussion regarding the so-called de-sinicization and reconstruction of the global value chain.
Maximization of profit and efficiency is no longer the only consideration for multinational firms amid the COVID-19 outbreak. These companies would like to diversify their risks to ensure that their supply and production chains can maintain continuous operations during the crisis, and to circumvent the previous situation of reliance on a single supplier or producer. For instance, during the COVID-19 pandemic, it has been reported that the U.S. and European countries are planning to relocate production of public health products such as masks, ventilators and pharmaceuticals back home. The U.S. government in particular is keen to reduce dependence on China’s bulk pharmaceutical chemicals and healthcare products, which account for around 60% of global supply.
Except for public health products, relocating manufacturing back to home countries in order to stimulate the domestic economy is also a concern for developed nations amid the global recession generated by COVID-19. Larry Kudlow, Director of the National Economic Council (NEC) of the United States, announced in April that the U.S. government will cover all relocation fees (“100% of immediate expensing”, as he said in an interview) for multinational firms that would like to transfer their Chinese business to the U.S. At the same time, the Japanese government launched a USD 2.2 billion plan to encourage Japanese manufacturing firms in China to move back to Japan or ASEAN countries. French Minister of Economy and Finance, Bruno Le Maire, also proposed the idea of relying less on China’s supply chain in the automobile, pharmaceuticals and aerospace industries.
Under these circumstances, gauging the impact of value chain relocation on China’s economic growth is an interesting, albeit challenging, task. In this report, we first identify the industries that are most susceptible and vulnerable to be decoupling with China based on a series of standard criteria in the international trade literature; we then conduct an input-output table analysis to identify the spillover effect of these vulnerable industries’ relocation to other sectors in order to calculate the extent to which it will influence China’s GDP growth.
Which sectors are most vulnerable to relocate outside of China after COVID- 19?
Value chain relocation outside of China has been a longstanding topic of discussion even before the COVID-19 pandemic and U.S.-China trade war. As far back as the 2000s, some labor-intensive industries such as the textile sector have transferred from China’s southeast coast provinces to ASEAN countries due to sustained labor cost increasing in China. We believe value chain relocation from China to other countries will be more active after COVID-19, with production either returning to advanced economies to stimulate domestic growth or to other developing countries to reduce labor costs, as COVID-19 will have an unprecedented impact on global growth. In addition to economic factors, countries are also aiming to relocate public health industries back home for national security reasons.
We apply a series of criteria in the international trade literature to identify the sectors that are most susceptible to relocation outside of China after COVID-19, including revealed comparative advantage (RCA), and Koopman’s GVC participation index and GVC position index.
First, we conducted the revealed comparative advantage (RCA) analysis, which is based on Ricardian trade theory positing that patterns of trade among countries are governed by their relative differences in productivity. Although they are difficult to observe, an RCA metric can be readily calculated using trade data to "reveal" these productivity differences. As such, it can be used to provide a general indication and first approximation of a country's competitive export advantages.
By definition, country A is said to have a revealed comparative advantage in a given product i when its ratio of exports of product i to its total exports of all goods exceeds the same ratio for the world as a whole:
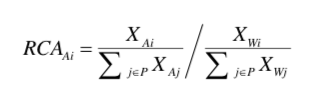 where P is the set of all products, XAi is country A's exports of product i, XWi is the world’s exports of product i,
  is country A's total exports (of all products j in P), and
  is the world's total exports (of all products j in P). When a country has a revealed comparative advantage for a given product (RCA>1), it can be inferred that it is a competitive producer and exporter of that product relative to a country producing and exporting the same good at or below the global average.
In this context, an RCA that is negative or less than 1 indicates that the country does not have comparative advantage in a given product (RCA<1). These sectors are more vulnerable to relocation outside of China as their comparative advantages are fading, and COVID-19 will speed up this relocation process. The RCA of each Harmonized System (HS) category can be found in Table 1 below.
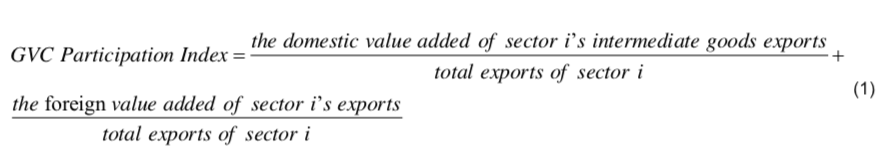
Second, we applied Koopman’s GVC participation index and GVC position index. These two indexes provide an estimation of the extent to which a specific economic sector is connected to global value chains for its foreign trade. The two indexes are connected by the following definitions:
is the world's total exports (of all products j in P). When a country has a revealed comparative advantage for a given product (RCA>1), it can be inferred that it is a competitive producer and exporter of that product relative to a country producing and exporting the same good at or below the global average.
In this context, an RCA that is negative or less than 1 indicates that the country does not have comparative advantage in a given product (RCA<1). These sectors are more vulnerable to relocation outside of China as their comparative advantages are fading, and COVID-19 will speed up this relocation process. The RCA of each Harmonized System (HS) category can be found in Table 1 below.
Second, we applied Koopman’s GVC participation index and GVC position index. These two indexes provide an estimation of the extent to which a specific economic sector is connected to global value chains for its foreign trade. The two indexes are connected by the following definitions:
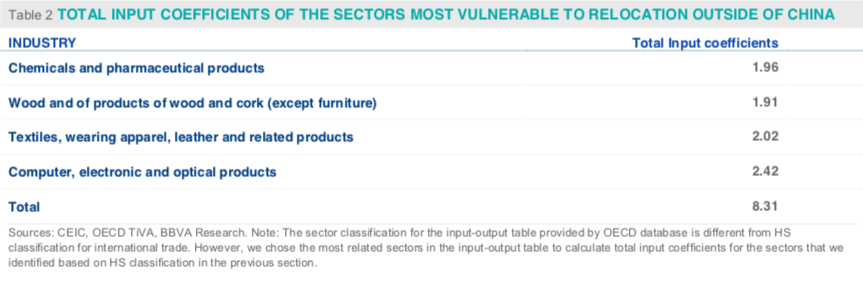
 We have identified the most vulnerable sectors based on the three criteria in the table above. In particular, we believe that the sectors which satisfy all three criteria at the same time: (i) have a lower sore of the GVC participation index; (ii) lower score of GVC position index, and (iii) have a negative RCA change, are most vulnerable to decouple with China and more susceptible to relocate outside of China. We need to pay attention that although some sectors have RCA larger than 1, their RCA change from 2000 to 2015 is actually negative. We consider these industries as loosening their revealed comparative advantages, including: HS11 (RCA change:-5.6), HS12(RCA change: -4.9), HS18 (RCA change: -1.5). (Guo et al, 2018)
These most vulnerable sectors include the following four HS categories:
(i) HS9. Wood and articles of wood; wood charcoal; cork and articles of cork; manufactures of straw, of esparto or of other plaiting materials; basket ware and wickerwork.
(ii) HS11. Textiles and textile articles;
(iii) HS12. Footwear, headgear, umbrellas, walking-sticks, seat-sticks, whips, riding-crops and parts thereof; prepared feathers and articles made therewith; artificial flowers; articles of human hair;
(iv) HS18. Optical, photographic, cinematographic, measuring, checking, precision, medical or surgical instruments and apparatus; clocks and watches; musical instruments; parts and accessories thereof;
As such, based on these three indexes, the above four industries are the most likely to relocate outside of China, especially labor-intensive sectors such as textile, footwear, wood, etc. In addition, relocation trends can also be seen in some labor-intensive areas of high-tech industries, such as optical devices, etc. The COVID-19 pandemic will further speed up the pace of relocation as advanced economies encourage these industries to repatriate in order to stimulate domestic employment and growth. Additionally, healthcare industries—such as the production of face masks, ventilators and pharmaceutical chemicals (included in HS18)—will undoubtedly transfer back to home countries following the COVID-19 outbreak for public health reasons.
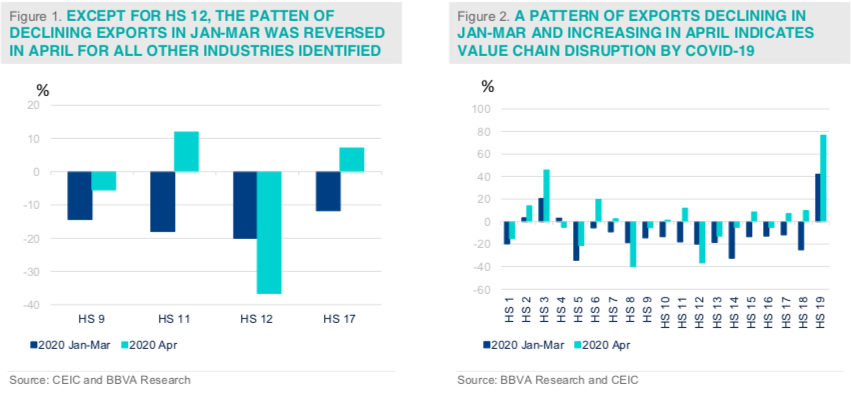
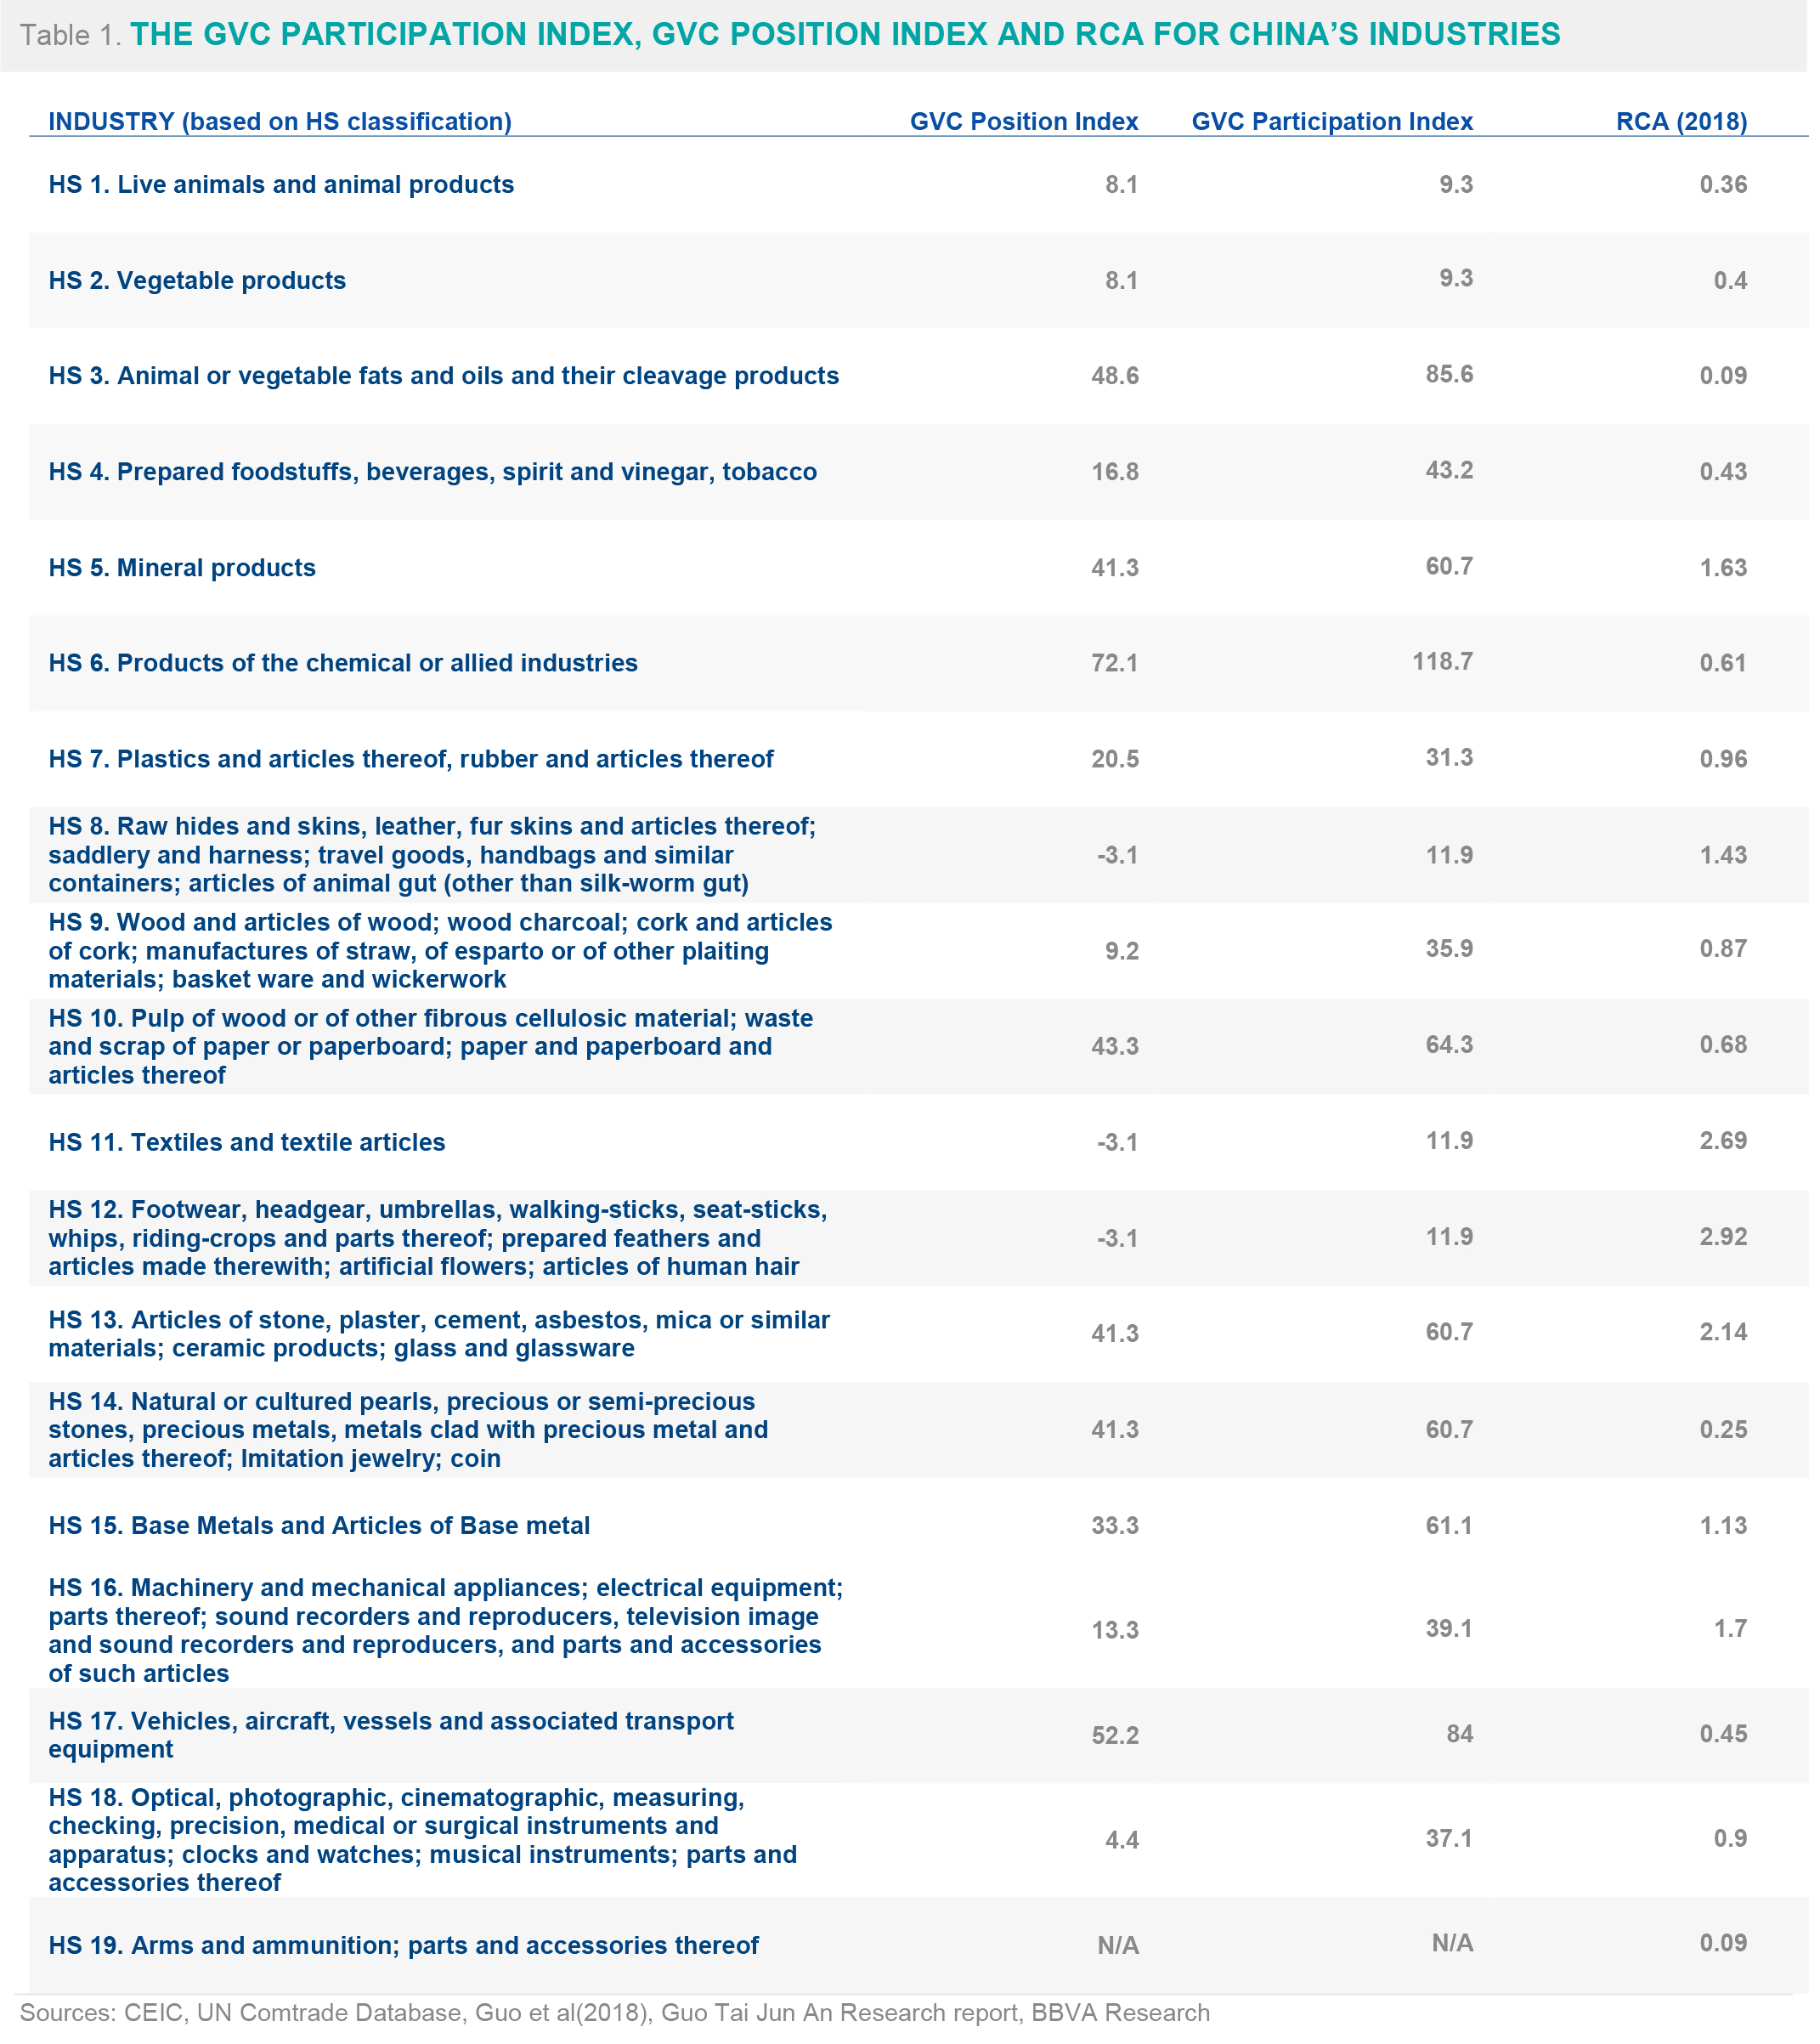
Finally, we conducted a natural experiment to apply the most recent empirical export data by HS category to further check the above conclusion. We calculated year-on-year growth in the January-March period for each HS category, which we define as the “COVID-19 affected period” in China. We also calculated year-on-year-growth in April for each HS category, which we define as the “post COVID-19 period” in China. We make the assumption that industries following a pattern of exports declining in January-March and increasing in April are more vulnerable to relocate outside of China, as their supply chains are more vulnerable to disruption by COVID-19 panic (see Figure 1 and Figure 2).
Of the four industries identified based on their GVC participation index, GVC position index and RCA, except for HS12. Footwear, headgear, umbrellas, walking-sticks, seat-sticks, etc., the other three categories follow the pattern of exports declining in January-March and increasing in April, as we expected. Thus, as a natural experiment based on data in the last four months, these industries’ value chains are shown to be more vulnerable to the COVID-19 pandemic, and thus more susceptible to be relocated outside of China.
We have identified the most vulnerable sectors based on the three criteria in the table above. In particular, we believe that the sectors which satisfy all three criteria at the same time: (i) have a lower sore of the GVC participation index; (ii) lower score of GVC position index, and (iii) have a negative RCA change, are most vulnerable to decouple with China and more susceptible to relocate outside of China. We need to pay attention that although some sectors have RCA larger than 1, their RCA change from 2000 to 2015 is actually negative. We consider these industries as loosening their revealed comparative advantages, including: HS11 (RCA change:-5.6), HS12(RCA change: -4.9), HS18 (RCA change: -1.5). (Guo et al, 2018)
These most vulnerable sectors include the following four HS categories:
(i) HS9. Wood and articles of wood; wood charcoal; cork and articles of cork; manufactures of straw, of esparto or of other plaiting materials; basket ware and wickerwork.
(ii) HS11. Textiles and textile articles;
(iii) HS12. Footwear, headgear, umbrellas, walking-sticks, seat-sticks, whips, riding-crops and parts thereof; prepared feathers and articles made therewith; artificial flowers; articles of human hair;
(iv) HS18. Optical, photographic, cinematographic, measuring, checking, precision, medical or surgical instruments and apparatus; clocks and watches; musical instruments; parts and accessories thereof;
As such, based on these three indexes, the above four industries are the most likely to relocate outside of China, especially labor-intensive sectors such as textile, footwear, wood, etc. In addition, relocation trends can also be seen in some labor-intensive areas of high-tech industries, such as optical devices, etc. The COVID-19 pandemic will further speed up the pace of relocation as advanced economies encourage these industries to repatriate in order to stimulate domestic employment and growth. Additionally, healthcare industries—such as the production of face masks, ventilators and pharmaceutical chemicals (included in HS18)—will undoubtedly transfer back to home countries following the COVID-19 outbreak for public health reasons.
Finally, we conducted a natural experiment to apply the most recent empirical export data by HS category to further check the above conclusion. We calculated year-on-year growth in the January-March period for each HS category, which we define as the “COVID-19 affected period” in China. We also calculated year-on-year-growth in April for each HS category, which we define as the “post COVID-19 period” in China. We make the assumption that industries following a pattern of exports declining in January-March and increasing in April are more vulnerable to relocate outside of China, as their supply chains are more vulnerable to disruption by COVID-19 panic (see Figure 1 and Figure 2).
Of the four industries identified based on their GVC participation index, GVC position index and RCA, except for HS12. Footwear, headgear, umbrellas, walking-sticks, seat-sticks, etc., the other three categories follow the pattern of exports declining in January-March and increasing in April, as we expected. Thus, as a natural experiment based on data in the last four months, these industries’ value chains are shown to be more vulnerable to the COVID-19 pandemic, and thus more susceptible to be relocated outside of China.
where P is the set of all products, XAi is country A's exports of product i, XWi is the world’s exports of product i,
The GVC participation index indicator is composed of two components reflecting the upstream and downstream links in international production chains. Basically, individual economies participate in global value chains by importing foreign inputs to produce the goods and services they export (backward GVC participation, BP, the second term in Equation (1)) and also by exporting domestically produced inputs to partners responsible for downstream production stages (forward GVC participation, FP, the first term in Equation (1)).
Backward GVC participation refers to the ratio of the "Foreign value added content of exports" to the economy's total gross exports. This is the "Buyer" perspective or sourcing side in GVCs, where an economy imports intermediates to produce its exports. Forward GVC participation corresponds to the ratio of the "Domestic value added sent to third economies" to the economy's total gross exports. It captures the domestic value added contained in inputs sent to third economies for further processing and export through value chains. This is the "Seller" perspective or supply side in GVC participation. Accordingly, the GVC position index is defined as below:

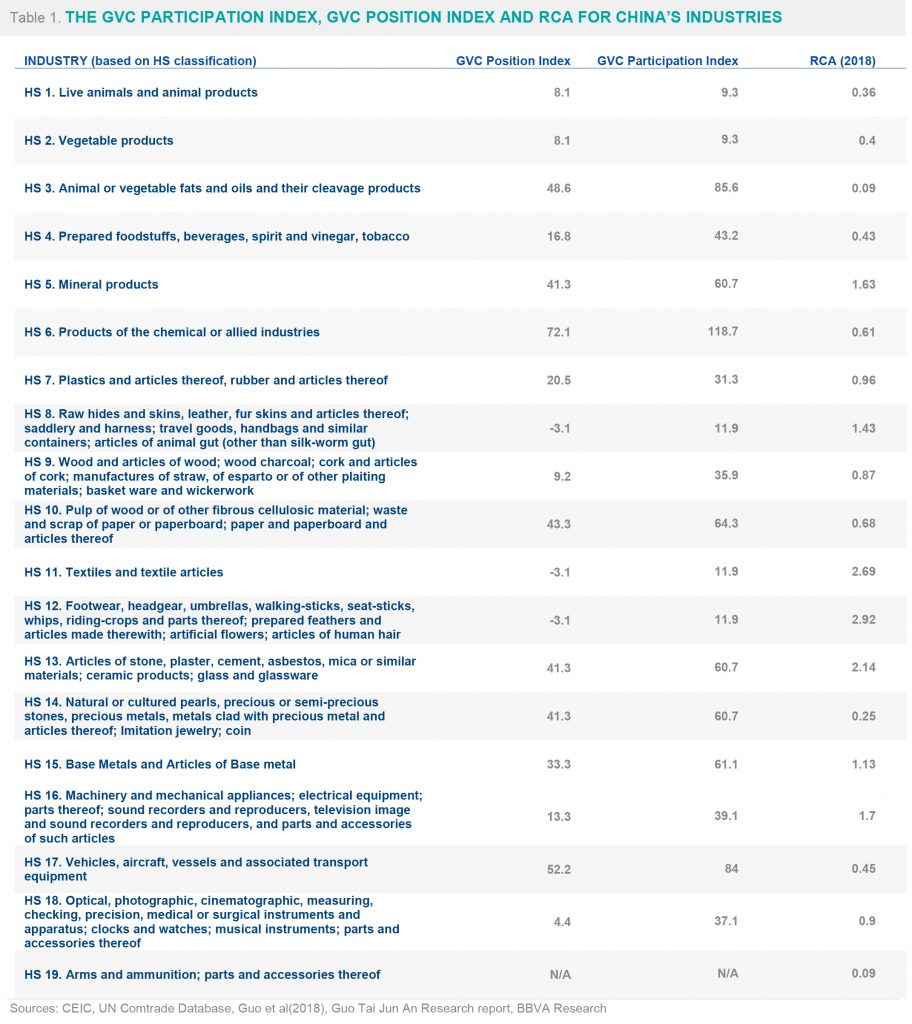
We believe that sectors at the lower end of the global value chain (i.e. a lower score in the GVC position index) and those with less involvement in the global value chain (i.e. a lower score in the GVC participation index) are more vulnerable to relocation outside of China (see Table 1).
The RCA, GVC participation index and GVC position index for China’s industries (based on HS classification) are summarized in the following table. The two GVC indexes are based on China-U.S. trade as a typical example (see Table 1) and the RCA is based on 2018 data, as the 2019 data is not available for some sectors provided by UN Comtrade database.
 We have identified the most vulnerable sectors based on the three criteria in the table above. In particular, we believe that the sectors which satisfy all three criteria at the same time: (i) have a lower sore of the GVC participation index; (ii) lower score of GVC position index, and (iii) have a negative RCA change, are most vulnerable to decouple with China and more susceptible to relocate outside of China. We need to pay attention that although some sectors have RCA larger than 1, their RCA change from 2000 to 2015 is actually negative. We consider these industries as loosening their revealed comparative advantages, including: HS11 (RCA change:-5.6), HS12(RCA change: -4.9), HS18 (RCA change: -1.5). (Guo et al, 2018)
These most vulnerable sectors include the following four HS categories:
(i) HS9. Wood and articles of wood; wood charcoal; cork and articles of cork; manufactures of straw, of esparto or of other plaiting materials; basket ware and wickerwork.
(ii) HS11. Textiles and textile articles;
(iii) HS12. Footwear, headgear, umbrellas, walking-sticks, seat-sticks, whips, riding-crops and parts thereof; prepared feathers and articles made therewith; artificial flowers; articles of human hair;
(iv) HS18. Optical, photographic, cinematographic, measuring, checking, precision, medical or surgical instruments and apparatus; clocks and watches; musical instruments; parts and accessories thereof;
As such, based on these three indexes, the above four industries are the most likely to relocate outside of China, especially labor-intensive sectors such as textile, footwear, wood, etc. In addition, relocation trends can also be seen in some labor-intensive areas of high-tech industries, such as optical devices, etc. The COVID-19 pandemic will further speed up the pace of relocation as advanced economies encourage these industries to repatriate in order to stimulate domestic employment and growth. Additionally, healthcare industries—such as the production of face masks, ventilators and pharmaceutical chemicals (included in HS18)—will undoubtedly transfer back to home countries following the COVID-19 outbreak for public health reasons.
Finally, we conducted a natural experiment to apply the most recent empirical export data by HS category to further check the above conclusion. We calculated year-on-year growth in the January-March period for each HS category, which we define as the “COVID-19 affected period” in China. We also calculated year-on-year-growth in April for each HS category, which we define as the “post COVID-19 period” in China. We make the assumption that industries following a pattern of exports declining in January-March and increasing in April are more vulnerable to relocate outside of China, as their supply chains are more vulnerable to disruption by COVID-19 panic (see Figure 1 and Figure 2).
Of the four industries identified based on their GVC participation index, GVC position index and RCA, except for HS12. Footwear, headgear, umbrellas, walking-sticks, seat-sticks, etc., the other three categories follow the pattern of exports declining in January-March and increasing in April, as we expected. Thus, as a natural experiment based on data in the last four months, these industries’ value chains are shown to be more vulnerable to the COVID-19 pandemic, and thus more susceptible to be relocated outside of China.
We have identified the most vulnerable sectors based on the three criteria in the table above. In particular, we believe that the sectors which satisfy all three criteria at the same time: (i) have a lower sore of the GVC participation index; (ii) lower score of GVC position index, and (iii) have a negative RCA change, are most vulnerable to decouple with China and more susceptible to relocate outside of China. We need to pay attention that although some sectors have RCA larger than 1, their RCA change from 2000 to 2015 is actually negative. We consider these industries as loosening their revealed comparative advantages, including: HS11 (RCA change:-5.6), HS12(RCA change: -4.9), HS18 (RCA change: -1.5). (Guo et al, 2018)
These most vulnerable sectors include the following four HS categories:
(i) HS9. Wood and articles of wood; wood charcoal; cork and articles of cork; manufactures of straw, of esparto or of other plaiting materials; basket ware and wickerwork.
(ii) HS11. Textiles and textile articles;
(iii) HS12. Footwear, headgear, umbrellas, walking-sticks, seat-sticks, whips, riding-crops and parts thereof; prepared feathers and articles made therewith; artificial flowers; articles of human hair;
(iv) HS18. Optical, photographic, cinematographic, measuring, checking, precision, medical or surgical instruments and apparatus; clocks and watches; musical instruments; parts and accessories thereof;
As such, based on these three indexes, the above four industries are the most likely to relocate outside of China, especially labor-intensive sectors such as textile, footwear, wood, etc. In addition, relocation trends can also be seen in some labor-intensive areas of high-tech industries, such as optical devices, etc. The COVID-19 pandemic will further speed up the pace of relocation as advanced economies encourage these industries to repatriate in order to stimulate domestic employment and growth. Additionally, healthcare industries—such as the production of face masks, ventilators and pharmaceutical chemicals (included in HS18)—will undoubtedly transfer back to home countries following the COVID-19 outbreak for public health reasons.
Finally, we conducted a natural experiment to apply the most recent empirical export data by HS category to further check the above conclusion. We calculated year-on-year growth in the January-March period for each HS category, which we define as the “COVID-19 affected period” in China. We also calculated year-on-year-growth in April for each HS category, which we define as the “post COVID-19 period” in China. We make the assumption that industries following a pattern of exports declining in January-March and increasing in April are more vulnerable to relocate outside of China, as their supply chains are more vulnerable to disruption by COVID-19 panic (see Figure 1 and Figure 2).
Of the four industries identified based on their GVC participation index, GVC position index and RCA, except for HS12. Footwear, headgear, umbrellas, walking-sticks, seat-sticks, etc., the other three categories follow the pattern of exports declining in January-March and increasing in April, as we expected. Thus, as a natural experiment based on data in the last four months, these industries’ value chains are shown to be more vulnerable to the COVID-19 pandemic, and thus more susceptible to be relocated outside of China.
Gauging the impact of value chain relocation on China’s growth: An input- output table analysis
We are attempting to explore the impact of value chain relocation on China’s growth. In particular, we gauge the spillover effect of the affected sectors identified above on all other sectors. In the literature, this kind of inter- sectoral linkage through real channels has typically been investigated via marginal impact analysis using input- output tables. Based on the OECD input-output table database (OECD IOTs), we are able to derive the necessary information to calculate the relative importance of the affected sectors in aggregate economic activity.
Using the input-output matrix (see the Technical Appendix attached in a separate PDF file), we calculated the total input coefficient, a typical concept in input-output analysis. This coefficient illustrates the extent to which output from each sector is used as intermediate inputs to meet one unit of increase in the final demand of a specific sector, with both direct and indirect effects considered. It is a good summary of inter-sectoral linkages, capturing not only the final demand linkage, but also the linkages through intermediate demand.
Our findings from this input-output table analysis can be summarized as follows:
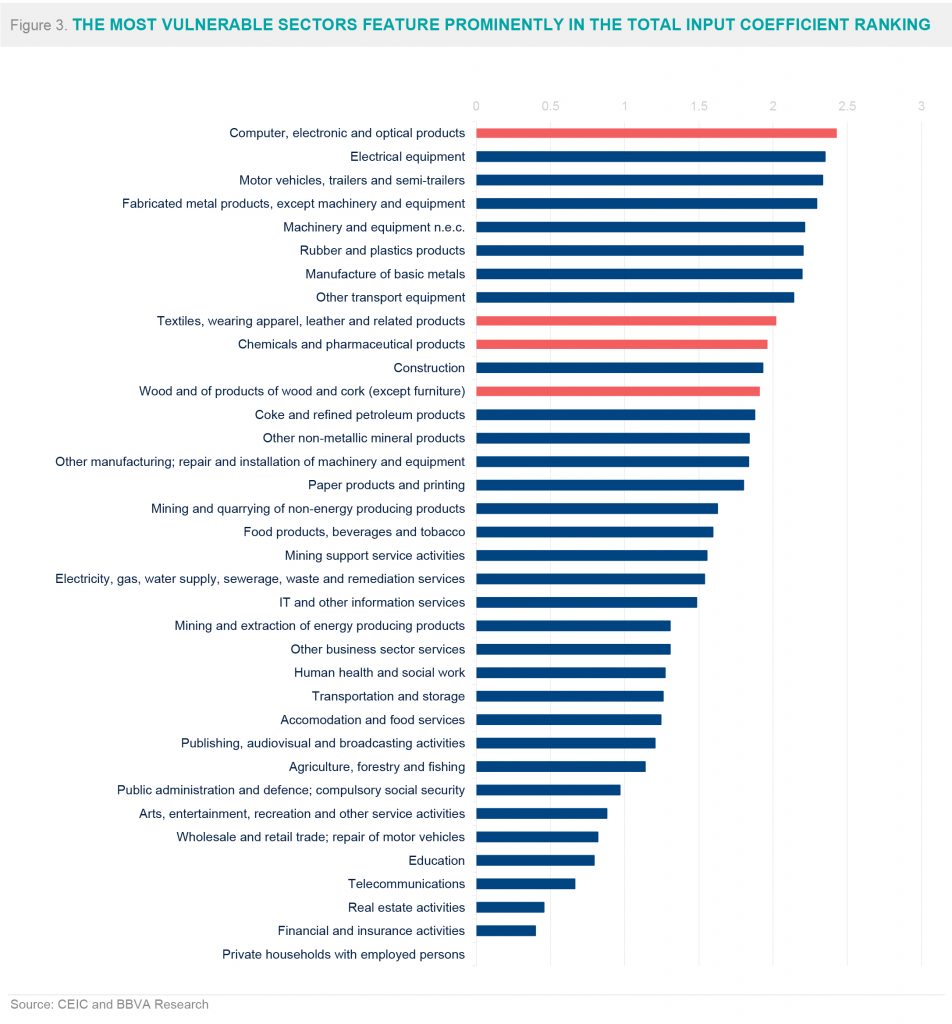
First, the most vulnerable sectors identified in the previous section have strong spillover effect to other sectors. Specifically, the affected sectors appear in prominent positions in the ranking of all 32 sectors by their total input coefficients. For instance, textiles and wearing apparel ranks ninth, with a total input coefficient of 2.02; chemical and pharmaceutical products ranks tenth, with a total input coefficient of 1.96. Other sectors are summarized in Table 2. This means that, in the chemical and pharmaceutical products sector for example, a one-unit increase in final demand, with both direct and indirect effects considered, will lead to an increase of 1.96 units in the total gross output of all sectors (see Figure 3 and Table 2).
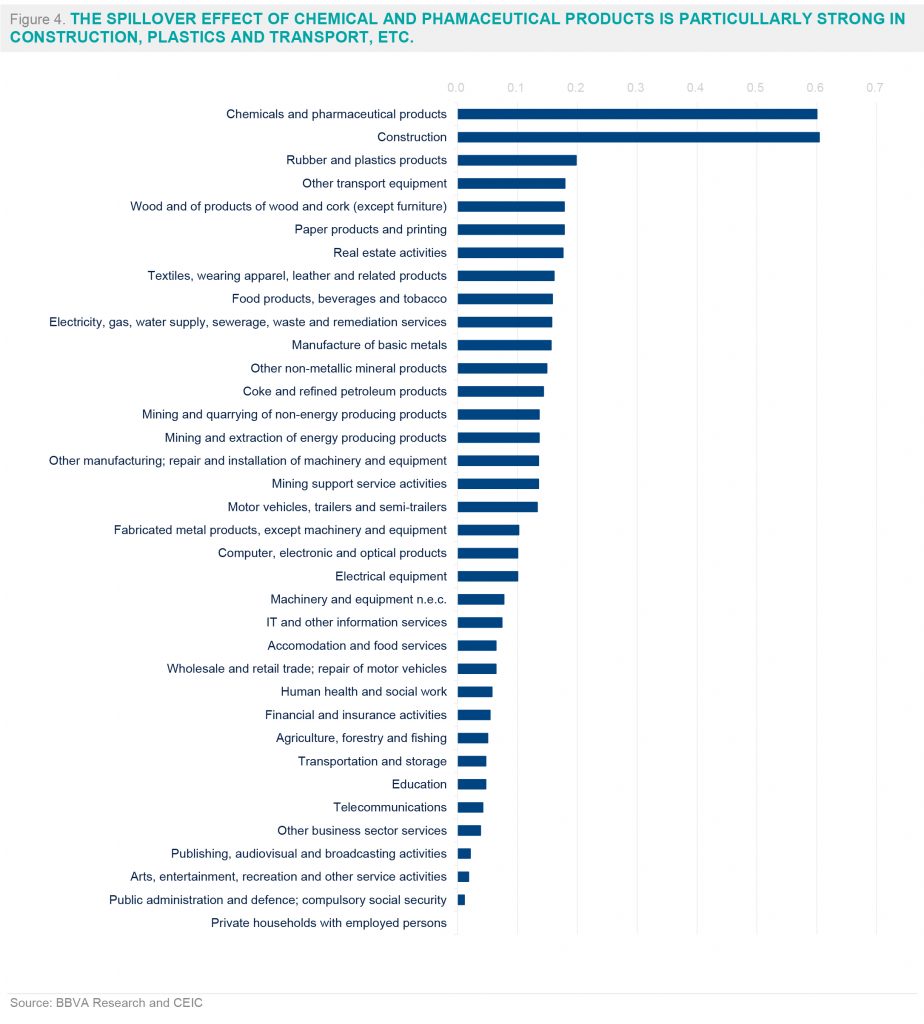
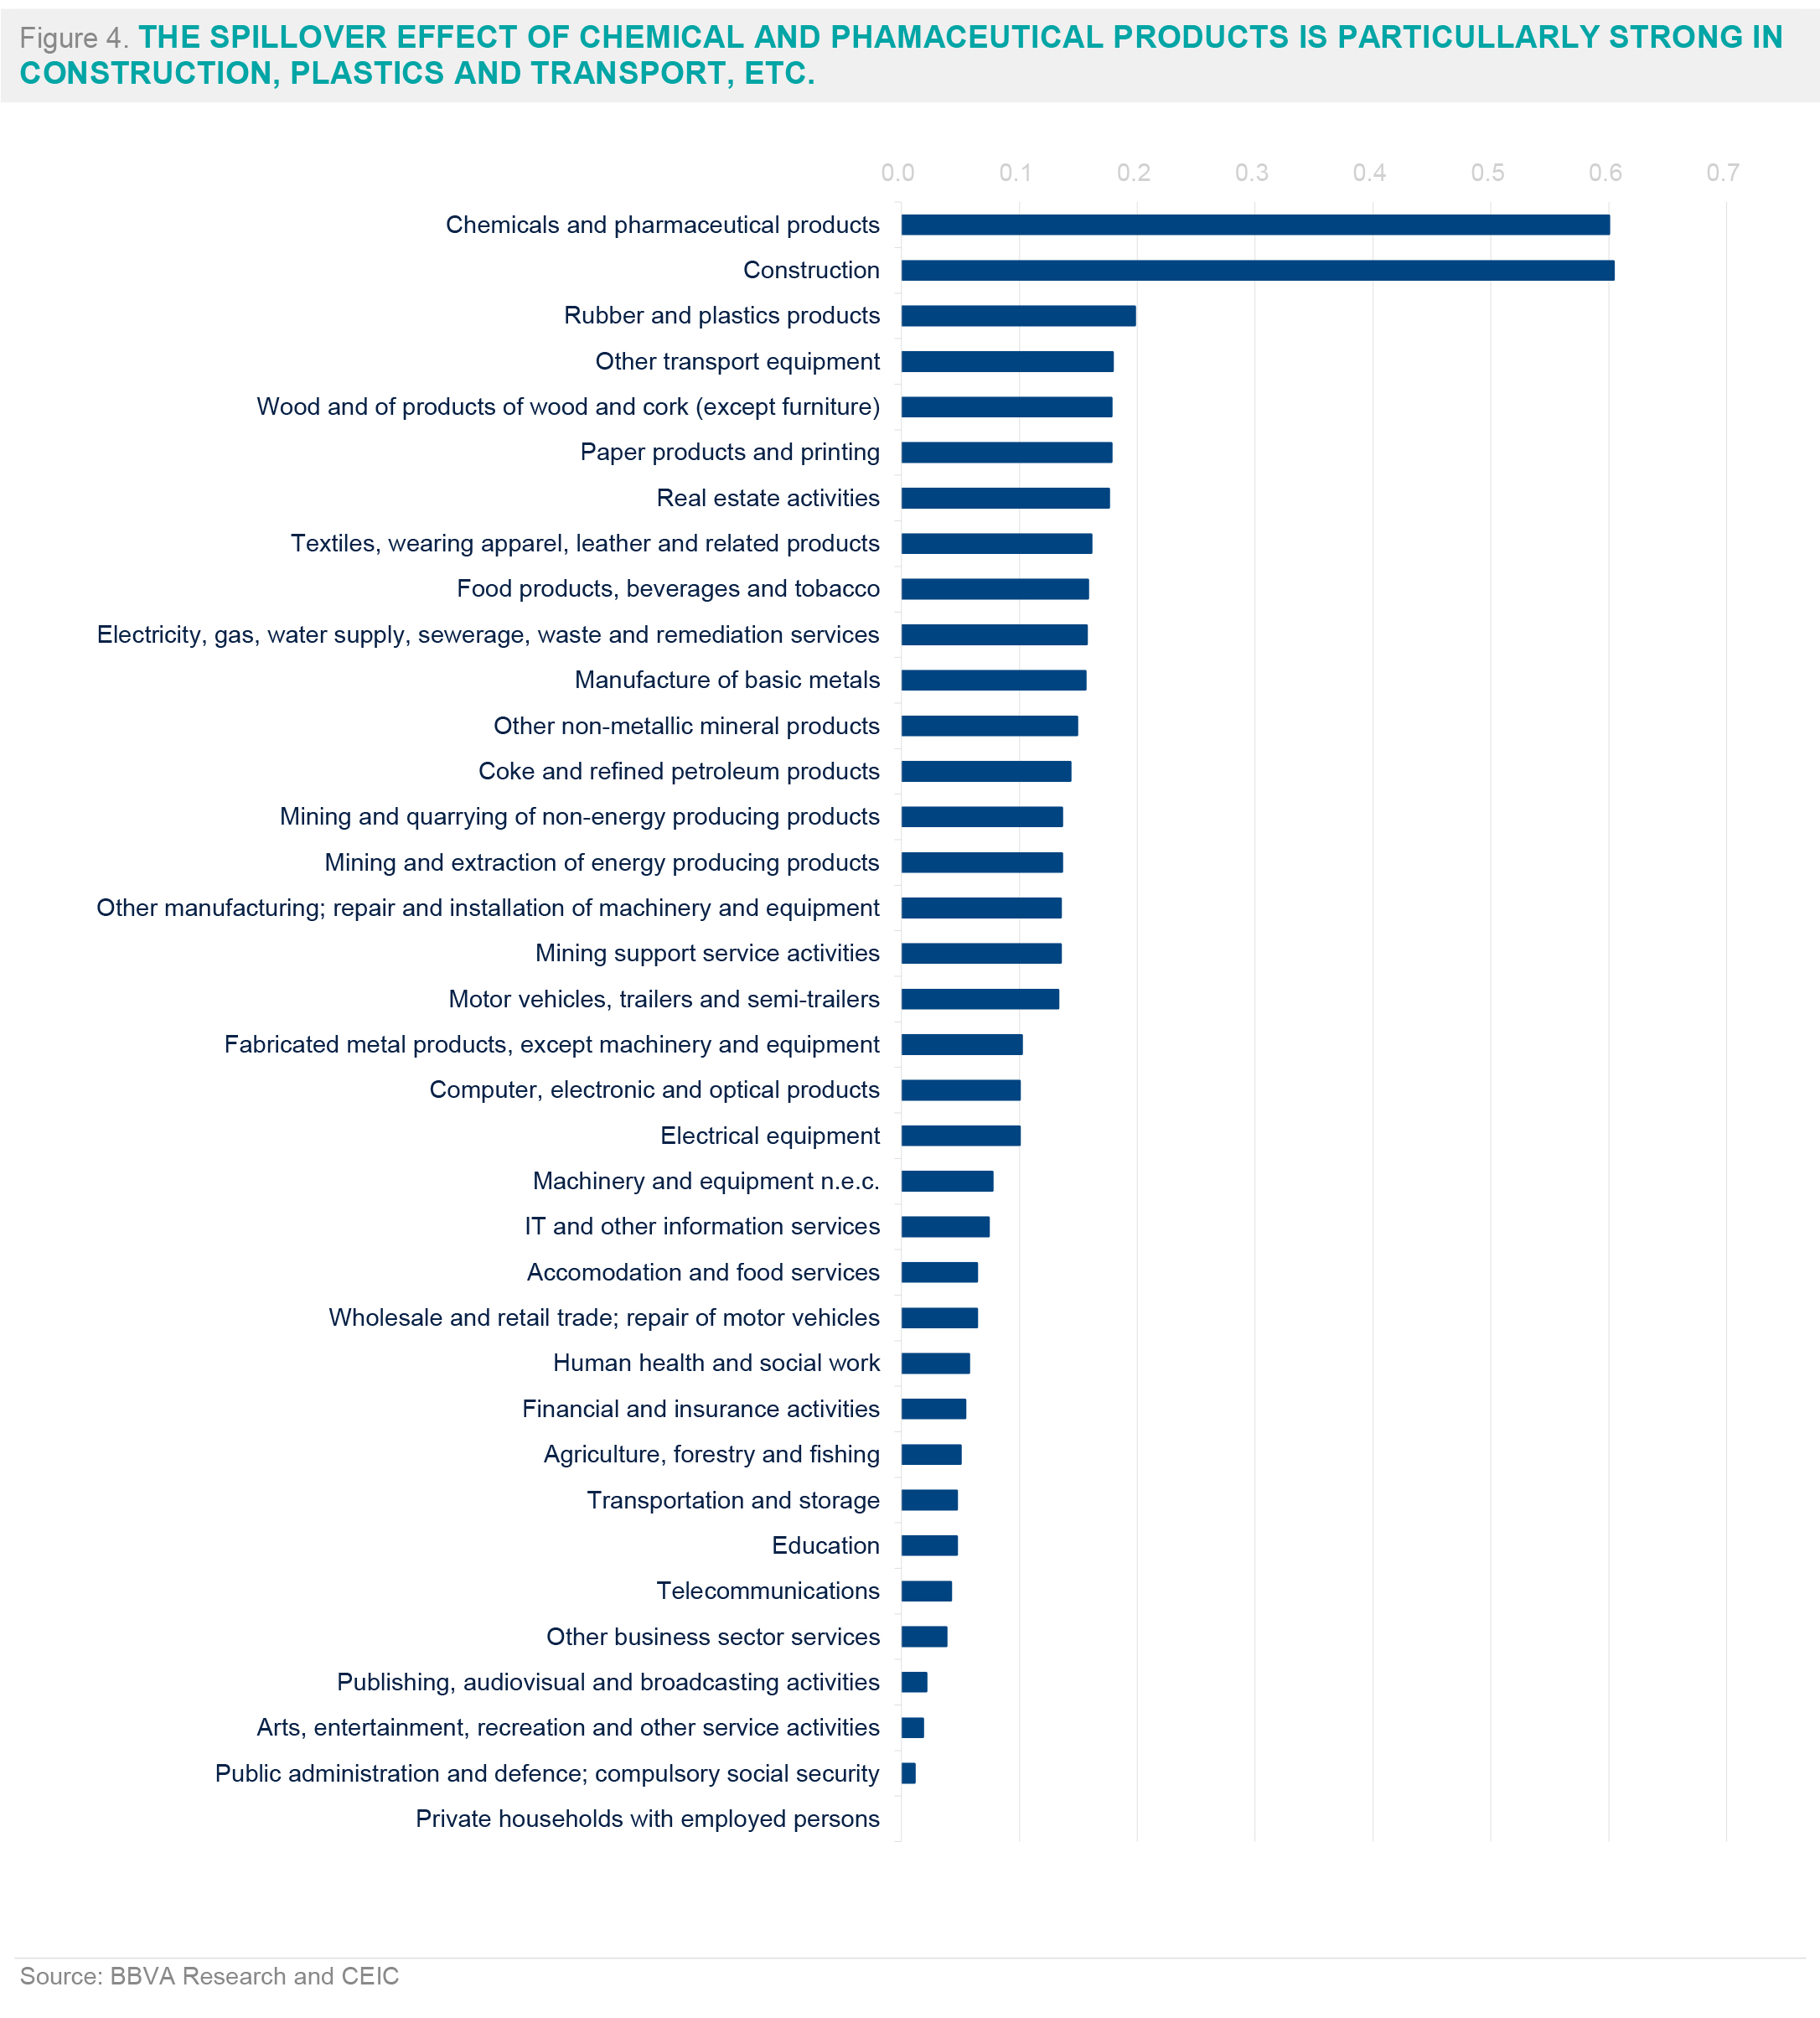
Second, the total input coefficient of the chemical and pharmaceutical sector—which illustrates the extent to which output from each sector is used as intermediate inputs to meet a one-unit of increase in the final demand of a specific sector—shows that the spillover effects of this sector are particularly strong to a number of other sectors, including construction, rubber and plastics products, and other transport equipment, etc. (see Figure 4).
We calculate that the sum of total input coefficients for the sectors that are most vulnerable to relocation outside of China is 8.31 (see Table 2). This indicates that a one-unit increase in the final demand of these vulnerable sectors will lead to an increase of 8.31 units of output from all sectors (including these sectors themselves) as intermediate inputs.
We can further estimate total GDP loss based on a review of industry relocation literature. For example, Hua C. and Q. Dong (2019) estimate the total scale of industry transfer from China to other countries will reach around RMB 2 trillion in the next 10 years, based on the industry relocation experience of Korea, Taiwan and Japan. Based on our analysis, the spillover effect of the relocation of these industries to other sectors—indicated by the total input coefficient—will be 8.31. This suggest that value chain relocation will lead to around RMB 16 trillion of total output loss for China in the next 10 years, equivalent to around 1.6% of total GDP per year on average.

REFERENCE
Balassa, Bela. 1965. “Trade Liberalization and Revealed Comparative Advantage.” Manchester School of Economic and Social Studies, 33, 99–123.
Guo, J, R.Mu, J Zhang, X Ruan (2018), International Competitiveness of China's Industries: Evolutionary Trends and Challenges, Bulletin of Chinese Academy of
Sciences, 2018, 33(1): 56-67
Hua, C, D Qi (2019), Value chain relocation in the future ten years. Guo Tai Jun An Securities research report.
Koopman, Robert, Zhi Wang, and Shang-Jin Wei. 2014. “Tracing Value-Added and Double Counting in Gross Exports.” American Economic Review 104(2): 459– 494.
Zhang W., G Han and S Chan, 2014. "How Strong are the Linkages between Real Estate and Other Sectors in China?," Working Papers 112014, Hong Kong Institute for Monetary Research.
