Carlos Casanova, Alvaro Ortiz, Tomasa Rodrigo and Xia Le: Tracking Chinese Vulnerability in Real Time Using Big Data
2017-05-07 IMI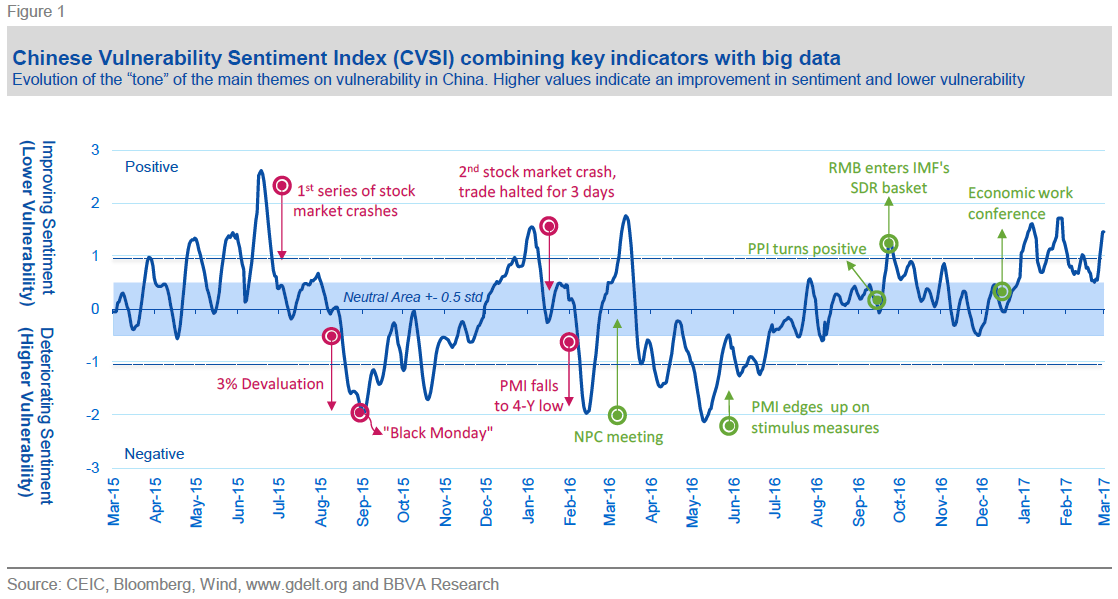 Our new China Vulnerability Sentiment Index (CVSI) combines daily time series on sentiment from a Big Data database called Global Database on Events Location and Tone (GDELT) with official statistics (hard data) and financial indicators, making it unique in its robustness and depth (Figure 1). GDELT is an initiative which aims to construct “a catalogue of human societal-scale behavior and beliefs across all countries” through the continuous analysis of news and events referenced in the media. Thanks to the use of high frequency Big Data series from GDELT, the CVSI enables us to “nowcast” vulnerability developments and identify early warning signals in real time, helping investors and policy makers to factor in risks ahead of time. Our index is unique in the sense that it enables us to track vulnerability and sentiment along a number of risk parameters. These were carefully selected to replicate the main vulnerabilities faced by the Chinese economy, as reflected by the four main components of the CVSI, outlined in more detail below.
Tracking vulnerability along four main components: Data and methodology
The index is composed by four different vulnerability dimensions:
1. The stated owned enterprises (SOE) vulnerability component, which captures indebtedness concerns among highly leveraged state owned enter
2. The housing bubble vulnerability component, taking into account risks of a potential correction in the housing market bubbl
3. The shadow banking vulnerability component, measuring the fast expansion of shadow banking activities, leading to an overall deterioration of credit conditions.
4. The exchange rate (FX) speculative pressure component, which accounts for speculative pressures in the exchange rate marke
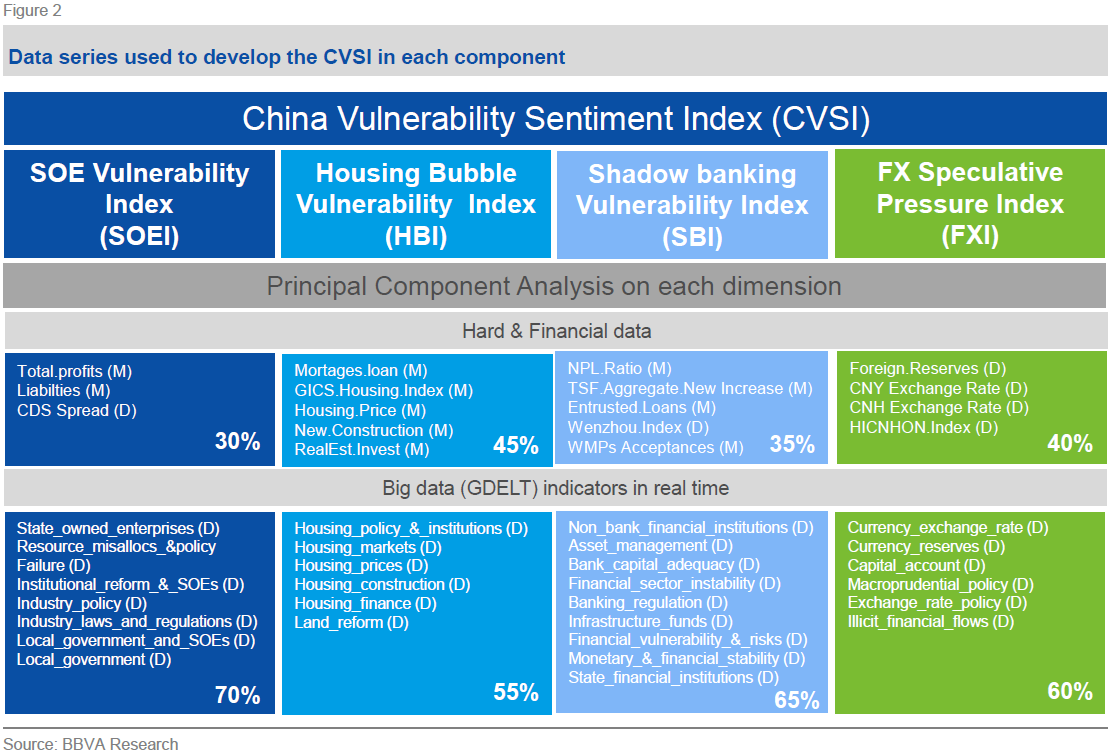
These dimensions, or components, were selected to reflect vulnerability developments on the ground in China, making this a highly specific and targeted indicator. Each component combines hard data in mixed frequencies – including daily, weekly, monthly and quarterly series – with high frequency indicators from GDELT (Figure 2). The variables included in each component were selected using a Bayesian Model averaging approach. Moreover, the components can be further disaggregated to offer a more granular vision of what drives vulnerability sentiment in China, offering a more nuanced view on policymaking.
To construct the high frequency indicators from GDELT, we exploit sentiment analysis from the media. Rather than relying on the concentration of news to develop sentiment indicators (as in Baker, Bloom & Davis, 2015), one of the advantages of GDELT is that it allows us to use sentiment analysis to extract information about the qualitative direction of the vulnerability in China (negative, neutral or positive). Like other recent papers (Shapiro, A Sudhof M and Wilson D., 2017), we opted for a hybrid strategy to extract sentiment about vulnerability by using deep learning models and lexicon strategies. This is advantageous because it enables us to obtain qualitative as well as quantitative attributes, something which is not possible with other textual analysis techniques.
To synthetize this large multidimensional dataset, with different variables and dimensions, into a single index, we used principal component analysis (PCA). PCA is a multivariate technique that enables us to reduce complex datasets to a lower dimension, revealing the most relevant underlying trends by examining the variances associated to the principal components. The results of the CVSI are shown in Figure 1, where the SOE component weighs 29% of the total index, the housing bubble vulnerability component 26%, the shadow banking vulnerability component 23% and the FX speculative pressure component 22%, according to this methodology.
Our new China Vulnerability Sentiment Index (CVSI) combines daily time series on sentiment from a Big Data database called Global Database on Events Location and Tone (GDELT) with official statistics (hard data) and financial indicators, making it unique in its robustness and depth (Figure 1). GDELT is an initiative which aims to construct “a catalogue of human societal-scale behavior and beliefs across all countries” through the continuous analysis of news and events referenced in the media. Thanks to the use of high frequency Big Data series from GDELT, the CVSI enables us to “nowcast” vulnerability developments and identify early warning signals in real time, helping investors and policy makers to factor in risks ahead of time. Our index is unique in the sense that it enables us to track vulnerability and sentiment along a number of risk parameters. These were carefully selected to replicate the main vulnerabilities faced by the Chinese economy, as reflected by the four main components of the CVSI, outlined in more detail below.
Tracking vulnerability along four main components: Data and methodology
The index is composed by four different vulnerability dimensions:
1. The stated owned enterprises (SOE) vulnerability component, which captures indebtedness concerns among highly leveraged state owned enter
2. The housing bubble vulnerability component, taking into account risks of a potential correction in the housing market bubbl
3. The shadow banking vulnerability component, measuring the fast expansion of shadow banking activities, leading to an overall deterioration of credit conditions.
4. The exchange rate (FX) speculative pressure component, which accounts for speculative pressures in the exchange rate marke
These dimensions, or components, were selected to reflect vulnerability developments on the ground in China, making this a highly specific and targeted indicator. Each component combines hard data in mixed frequencies – including daily, weekly, monthly and quarterly series – with high frequency indicators from GDELT (Figure 2). The variables included in each component were selected using a Bayesian Model averaging approach. Moreover, the components can be further disaggregated to offer a more granular vision of what drives vulnerability sentiment in China, offering a more nuanced view on policymaking.
To construct the high frequency indicators from GDELT, we exploit sentiment analysis from the media. Rather than relying on the concentration of news to develop sentiment indicators (as in Baker, Bloom & Davis, 2015), one of the advantages of GDELT is that it allows us to use sentiment analysis to extract information about the qualitative direction of the vulnerability in China (negative, neutral or positive). Like other recent papers (Shapiro, A Sudhof M and Wilson D., 2017), we opted for a hybrid strategy to extract sentiment about vulnerability by using deep learning models and lexicon strategies. This is advantageous because it enables us to obtain qualitative as well as quantitative attributes, something which is not possible with other textual analysis techniques.
To synthetize this large multidimensional dataset, with different variables and dimensions, into a single index, we used principal component analysis (PCA). PCA is a multivariate technique that enables us to reduce complex datasets to a lower dimension, revealing the most relevant underlying trends by examining the variances associated to the principal components. The results of the CVSI are shown in Figure 1, where the SOE component weighs 29% of the total index, the housing bubble vulnerability component 26%, the shadow banking vulnerability component 23% and the FX speculative pressure component 22%, according to this methodology.
 Improvement in sentiment and lower vulnerability since 2H16
The CVSI shows an improvement in vulnerability and sentiment since 2H16. This improvement is in stark contrast to the sharp decline which followed from a series of policy missteps in 2015-2016. As can be seen in Figure 1, our index does a good job at capturing the deterioration in sentiment and an increase in vulnerability following from two stock market crashes and an ill-timed devaluation of the RMB, which ultimately resulted in a third of the value of the Shanghai Stock Exchange being wiped out in what is now referred to as “Black Monday”. Together with burgeoning levels of corporate debt – the bulk of which has been accrued by SOEs – and expectations of Yuan devaluation, fears of a potential collapse of the Chinese economy and its implications on the global financial system led to a steep deterioration of the sentiment and an increase in vulnerabilities throughout 2016 and 1H16. Nevertheless, we see an inflexion point nearing2H16, coinciding with the conclusion of the NPC meeting. After this, authorities made clear their commitment to growth targets but without forgetting reforms, adjusting the policy mix to more fiscal support combined with a tighter monetary policy stance and a stricter macro-prudential framework. The improvement in the CVSI after the change in the policy mix can be traced back to three of the components of the CVSI (Figure 3).
Our SOE component has edged up since the announcement of reforms aimed at curbing overcapacity in the bloated steel and cement sectors, while simultaneously seeking to boost productivity through closures and M&As. As a note of caution, overall indebtedness remains very high at approximately 270% of GDP, so we would expect to see some more volatility in this component going forward. Shadow banking activities have come under scrutiny recently, with the China Banking Regulation Commission (CBRC) launching a new crackdown on shadow banking activities around September 2016. On the Housing front, our component has been edging up based on two seemingly contradictory factors. On the one hand, housing prices have continued to increase. On the other, a number of curbs on property prices have tamed bubbles in first-tier cities such as Shanghai and Shenzhen. This reflects the fact that Chinese authorities have allowed prices to increase in order to support GDP, but have also maneuvered to contain asset price risks in major cities.
Improvement in sentiment and lower vulnerability since 2H16
The CVSI shows an improvement in vulnerability and sentiment since 2H16. This improvement is in stark contrast to the sharp decline which followed from a series of policy missteps in 2015-2016. As can be seen in Figure 1, our index does a good job at capturing the deterioration in sentiment and an increase in vulnerability following from two stock market crashes and an ill-timed devaluation of the RMB, which ultimately resulted in a third of the value of the Shanghai Stock Exchange being wiped out in what is now referred to as “Black Monday”. Together with burgeoning levels of corporate debt – the bulk of which has been accrued by SOEs – and expectations of Yuan devaluation, fears of a potential collapse of the Chinese economy and its implications on the global financial system led to a steep deterioration of the sentiment and an increase in vulnerabilities throughout 2016 and 1H16. Nevertheless, we see an inflexion point nearing2H16, coinciding with the conclusion of the NPC meeting. After this, authorities made clear their commitment to growth targets but without forgetting reforms, adjusting the policy mix to more fiscal support combined with a tighter monetary policy stance and a stricter macro-prudential framework. The improvement in the CVSI after the change in the policy mix can be traced back to three of the components of the CVSI (Figure 3).
Our SOE component has edged up since the announcement of reforms aimed at curbing overcapacity in the bloated steel and cement sectors, while simultaneously seeking to boost productivity through closures and M&As. As a note of caution, overall indebtedness remains very high at approximately 270% of GDP, so we would expect to see some more volatility in this component going forward. Shadow banking activities have come under scrutiny recently, with the China Banking Regulation Commission (CBRC) launching a new crackdown on shadow banking activities around September 2016. On the Housing front, our component has been edging up based on two seemingly contradictory factors. On the one hand, housing prices have continued to increase. On the other, a number of curbs on property prices have tamed bubbles in first-tier cities such as Shanghai and Shenzhen. This reflects the fact that Chinese authorities have allowed prices to increase in order to support GDP, but have also maneuvered to contain asset price risks in major cities.
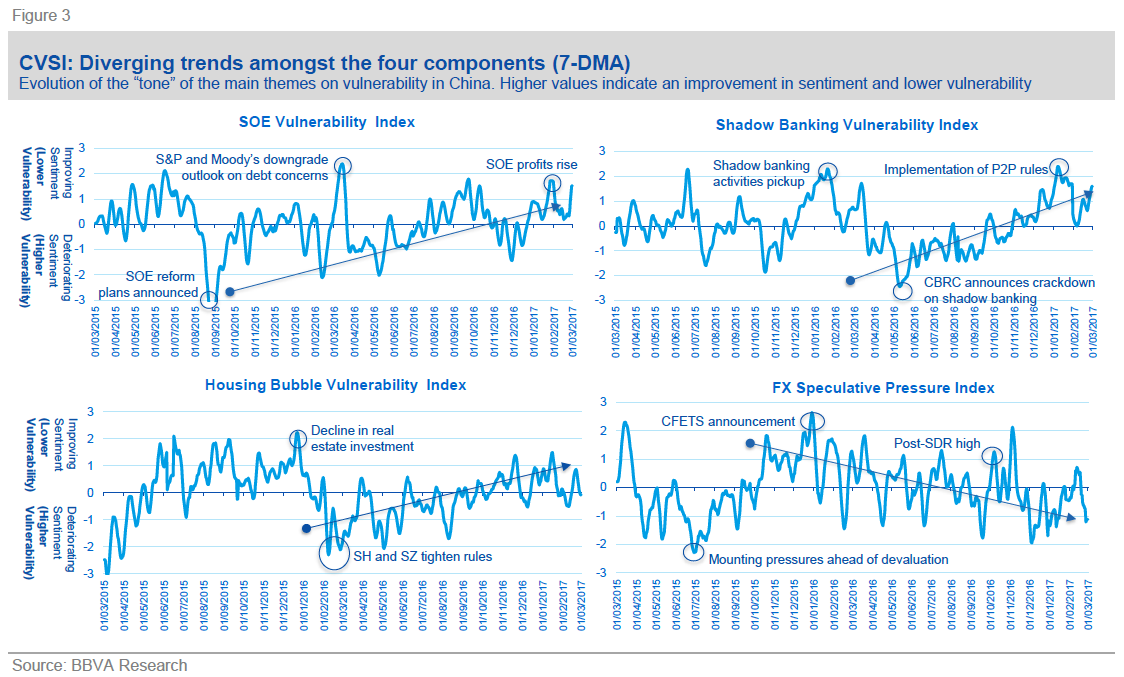 The only component where we do not observe an improvement is FX speculative pressures. This is due to the fact that, particularly during 4Q16, the RMB saw significant depreciatory pressures, leading to outflows and a depletion of FX reserves below the watershed level of 3 trillion USD. Much of this pressure has abated in 1Q17, on the back of a weaker USD and a recovery in global trade.
The CVSI performs well and offers insights into the optimum policy mix
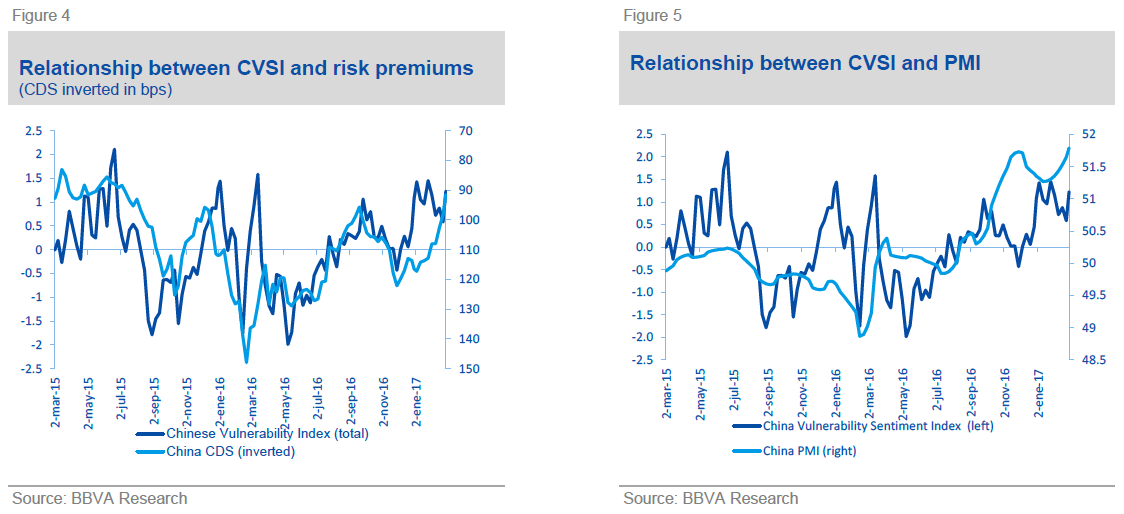
In addition to acting as a gauge of sentiment and vulnerability in China, empirical results show that the CVSI, can be used to nowcast (as a leading indicator) Chinese risk premiums. As shown in Figure 4, there is a very high correlation between the CVSI and the Sovereign Credit Default Swap (CDS). In other words, worsening sentiment or risk narratives on vulnerabilities will be reflected on risk premiums. Although not designed as a tool to forecast economic activity, the CVSI also has predictive potential for other indicators of economic activity, as proxied by the Purchasing Manager’s Index (PMI). The PMI is an indicator of the economic health of the manufacturing sector, and is based on a monthly survey conducted to large enterprises. An improvement in sentiment and vulnerability translates into higher PMIs and vice-versa (Figure 5), as manager’s responses are partially influenced by their perception of the state of the economy. Beyond this, the CVSI has the additional advantage that it can be updated on a quasi-real-time basis, whereas PMIs are published monthly.
The only component where we do not observe an improvement is FX speculative pressures. This is due to the fact that, particularly during 4Q16, the RMB saw significant depreciatory pressures, leading to outflows and a depletion of FX reserves below the watershed level of 3 trillion USD. Much of this pressure has abated in 1Q17, on the back of a weaker USD and a recovery in global trade.
The CVSI performs well and offers insights into the optimum policy mix
In addition to acting as a gauge of sentiment and vulnerability in China, empirical results show that the CVSI, can be used to nowcast (as a leading indicator) Chinese risk premiums. As shown in Figure 4, there is a very high correlation between the CVSI and the Sovereign Credit Default Swap (CDS). In other words, worsening sentiment or risk narratives on vulnerabilities will be reflected on risk premiums. Although not designed as a tool to forecast economic activity, the CVSI also has predictive potential for other indicators of economic activity, as proxied by the Purchasing Manager’s Index (PMI). The PMI is an indicator of the economic health of the manufacturing sector, and is based on a monthly survey conducted to large enterprises. An improvement in sentiment and vulnerability translates into higher PMIs and vice-versa (Figure 5), as manager’s responses are partially influenced by their perception of the state of the economy. Beyond this, the CVSI has the additional advantage that it can be updated on a quasi-real-time basis, whereas PMIs are published monthly.
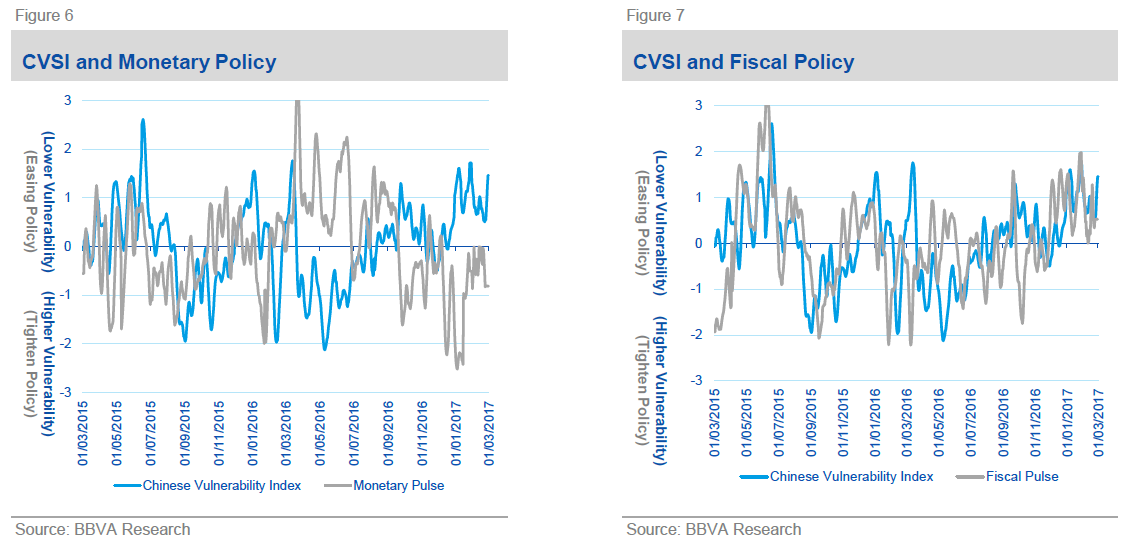
 Moreover, the CVSI can also be deployed to evaluate the effectiveness of the current monetary and fiscal policy responses. According to our real time Monetary and Fiscal Policy Pulses9, where we also combine big data series with hard data. Fiscal policy has been expansionary and is positively correlated with an improvement in the CVSI. On the other hand, monetary policy has been contractionary and is inversely related to an improvement in the CVSI (Figures 6 and 7). In other words, the adequate policy mix to cope with vulnerability should include a tighter monetary policy with further fiscal support. On a more granular level, both expansionary monetary and fiscal policies will reduce vulnerabilities for the SOE component, generating positive conditions for growth while simultaneously providing a favorable environment for repayment and rollover of existing debt. This is similar in the case of housing, as lower borrowing costs should help to stimulate demand and also alleviate the burden on leveraged financing. Expansionary fiscal policy contributes marginally to an improvement in the shadow banking component, while looser monetary policy has, as expected, detrimental effects on vulnerability and sentiment. Finally, expansionary monetary and fiscal policies add to existing pressures on the FX component as they would exert further depreciatory pressure on the RMB, risking steeper capital outflows and a depletion of FX reserves.
 Summary
The CVSI enables us to track vulnerability sentiment in China in real time by using Big Data techniques. Sentiment analysis has been deployed in previous studies focusing on the evolution of housing prices, while textual search is a burgeoning field in economic research (Shiller, 2014). Our research and a forthcoming paper pretend to contribute to the advancement of this field. The fact that the index combines both Big Bata indicators in high frequency with hard data means that we can accurately and comprehensively analyze the narrative of Chinese vulnerabilities in real time, offering valuable insights for investors and policymakers alike.
The index has improved since 2H16, in line with a pick-up in economic activity but also with a change in the policy mix by Chinese authorities. The “risk narrative” looks to be improving for the Chinese economy, but it may still be too soon to determine if this mood can be self-fulfilling. Of particular interest will be monitoring the development of vulnerability and sentiment in the months to come. In addition, authorities should continue to tweak their policy response in line with our view in order to sustain growth while simultaneously limiting vulnerabilities along the main risk parameters.
Summary
The CVSI enables us to track vulnerability sentiment in China in real time by using Big Data techniques. Sentiment analysis has been deployed in previous studies focusing on the evolution of housing prices, while textual search is a burgeoning field in economic research (Shiller, 2014). Our research and a forthcoming paper pretend to contribute to the advancement of this field. The fact that the index combines both Big Bata indicators in high frequency with hard data means that we can accurately and comprehensively analyze the narrative of Chinese vulnerabilities in real time, offering valuable insights for investors and policymakers alike.
The index has improved since 2H16, in line with a pick-up in economic activity but also with a change in the policy mix by Chinese authorities. The “risk narrative” looks to be improving for the Chinese economy, but it may still be too soon to determine if this mood can be self-fulfilling. Of particular interest will be monitoring the development of vulnerability and sentiment in the months to come. In addition, authorities should continue to tweak their policy response in line with our view in order to sustain growth while simultaneously limiting vulnerabilities along the main risk parameters.
