Hong Hao: A Definitive Guide to Forecasting China Market
2019-09-29 IMI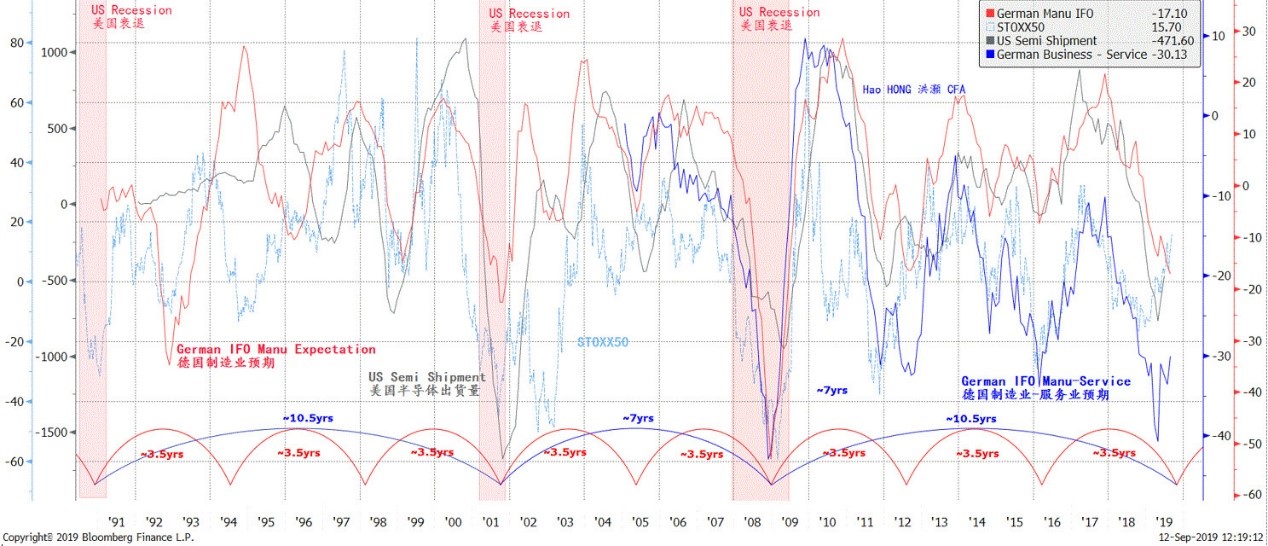 Source: Bloomberg, BOCOM Int'l
Previously, we have posited in a series of reports a ground-breaking theory about the operations of short and intermediate economic cycles in China and the US. Our theses on cycles were laid out in “A Definitive Guide to China’s Economic Cycle” on 20170324, and in “The Colliding Cycles of the US and China” on 20180903, among other related reports. In Figure 1, we demonstrate that a similar short cycle of ~3.5 years also runs in the European economy. Note that an intermediate cycle can consist of two to three 3.5-year short cycles, spanning over seven to eleven years.
Indeed, “The Colliding Cycles of the US and China” was published on the very day when the US market peaked on 3 September 2018, before it descended into the worst Christmas trading since the Great Depression. Our model on China’s short economic cycles also foresaw a better year for China’s market in 2019, against the bearish consensus then (“Outlook 2019: Turning a Corner”, 20181119).
What does Ricardo’s insights on trend following have to do with all of these cyclical models?
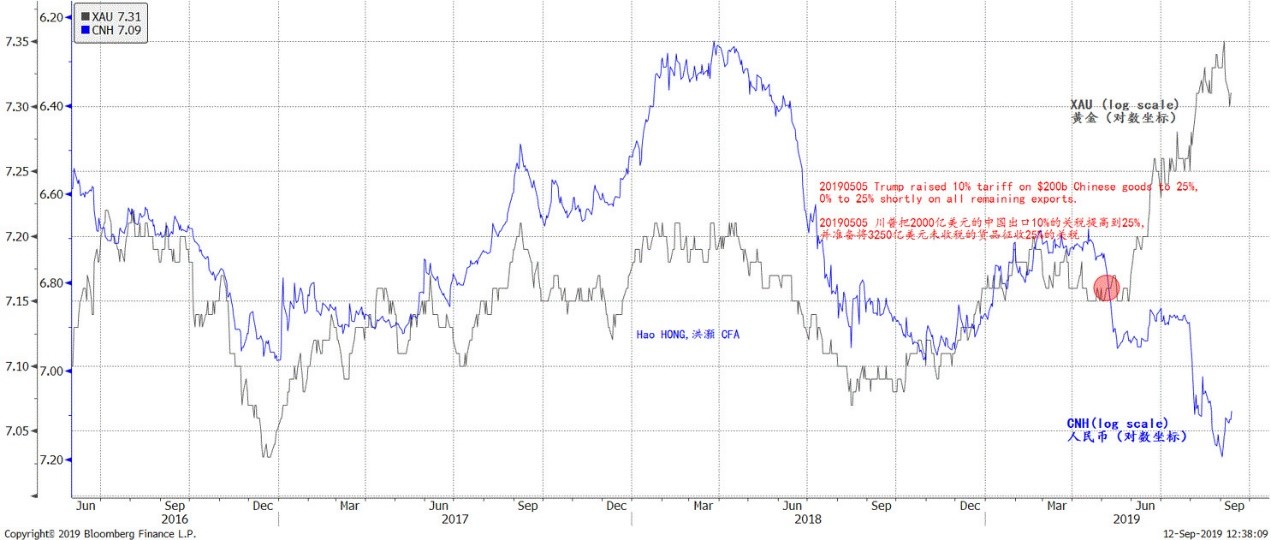
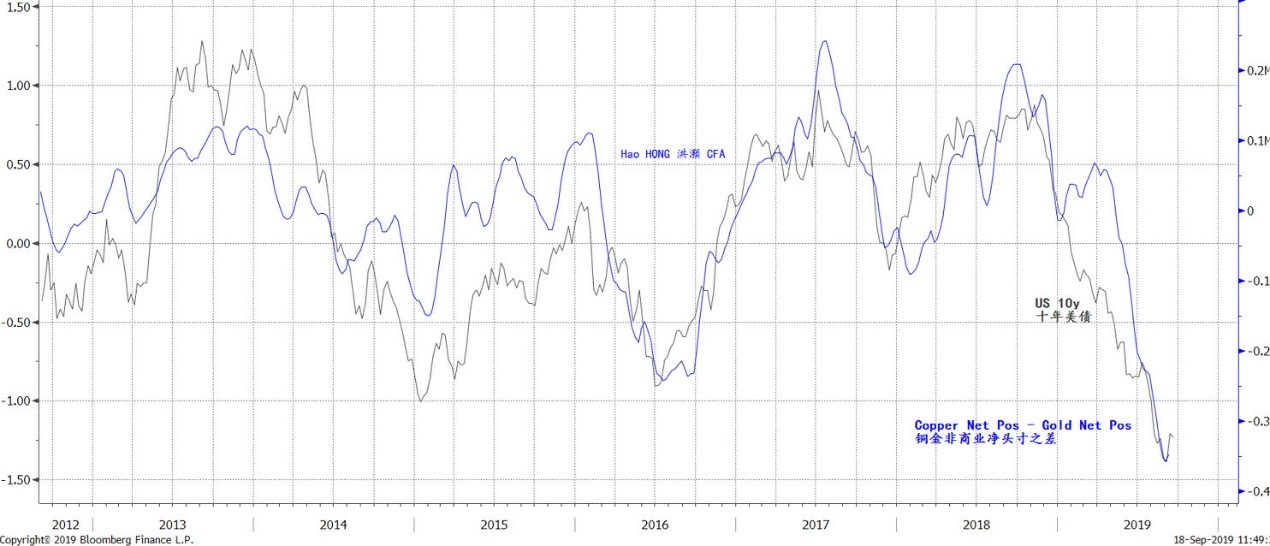
Recently, we have observed that CNH and gold, two assets that used to be trading on very tight correlation, started to diverge in early May – around the time when Trump raised tariffs on Chinese goods in retaliation (Figure 2). Such sudden inversion of correlation between these two important assets suggests a paradigm shift. Investor appetite towards gold has switched from a risk asset to a risk haven. Further, the gap between copper and gold’s net positions and the plunging bond yield also suggest risk aversion (Figure 3).
Figure 2: The divergence between gold and CNH suggests a paradigm shift
Source: Bloomberg, BOCOM Int'l
Previously, we have posited in a series of reports a ground-breaking theory about the operations of short and intermediate economic cycles in China and the US. Our theses on cycles were laid out in “A Definitive Guide to China’s Economic Cycle” on 20170324, and in “The Colliding Cycles of the US and China” on 20180903, among other related reports. In Figure 1, we demonstrate that a similar short cycle of ~3.5 years also runs in the European economy. Note that an intermediate cycle can consist of two to three 3.5-year short cycles, spanning over seven to eleven years.
Indeed, “The Colliding Cycles of the US and China” was published on the very day when the US market peaked on 3 September 2018, before it descended into the worst Christmas trading since the Great Depression. Our model on China’s short economic cycles also foresaw a better year for China’s market in 2019, against the bearish consensus then (“Outlook 2019: Turning a Corner”, 20181119).
What does Ricardo’s insights on trend following have to do with all of these cyclical models?
Recently, we have observed that CNH and gold, two assets that used to be trading on very tight correlation, started to diverge in early May – around the time when Trump raised tariffs on Chinese goods in retaliation (Figure 2). Such sudden inversion of correlation between these two important assets suggests a paradigm shift. Investor appetite towards gold has switched from a risk asset to a risk haven. Further, the gap between copper and gold’s net positions and the plunging bond yield also suggest risk aversion (Figure 3).
Figure 2: The divergence between gold and CNH suggests a paradigm shift
 Source: Bloomberg, BOCOM Int'l
Such implications are consistent with the observations in Figure 1 that the conditions in the European manufacturing sector are depressed to the 2008 depth. Other cyclical indicators, such as US semi shipments and business conditions, are all showing that the manufacturing sector is already in recession globally.
Figure 3: The expanding position difference in copper and gold suggests falling growth expectations
Source: Bloomberg, BOCOM Int'l
Such implications are consistent with the observations in Figure 1 that the conditions in the European manufacturing sector are depressed to the 2008 depth. Other cyclical indicators, such as US semi shipments and business conditions, are all showing that the manufacturing sector is already in recession globally.
Figure 3: The expanding position difference in copper and gold suggests falling growth expectations
 Source: Bloomberg, BOCOM Int'l
The significance of any cyclical model is to evaluate and forecast the underlying trend less perceptible to many, as well as the approximate timing of turning points. Such forecasts, albeit with no guarantee, improve the odds of profiting. As a macro strategist, we need to go beyond economic forecasting to infer the market impact of our forecasts. Our cyclical models, with a consistent track record since their development, appear to be pointing towards the end of the cycle.
How do we apply these economic cycle models to the development of market trading models? What specific keys the models hold to the current trading environment?
The Cycle of China Market Return
“Has the market changed? In short, no. Markets are simply human emotion reflected in $$’s… the way I traded in the 1950’s and made such fantastic money was simply the same method Livermore and Baruch traded before me … It is all about riding huge waves of emotion to the maximum.”
– Nicolas Darvas, dancer, self-taught investor and best-selling author
The short economic cycles ebb and flow with regularity. We observe similarity and simultaneity of fluctuations across various macroeconomic variables and across countries. The cycles seem to be fluctuating rhythmically around its underlying trend. Intuitively, the stock market is a barometer of economic conditions; its price movements must inherently reflect the underlying economic fundamentals.
Previously, we based our market forecast on the covariance between the market and the economic cycles, and have attained notable success (please refer to reports “Outlook 2018: View from the Peak” on 20171204, and “Outlook 2019: Turning a Corner” on 20181119).
By now, we have established that the Chinese economy runs on a 3.5-year cycle. The question is how exactly this cycle is being reflected by the stock market. As we know, there are 42 months in 3.5 years. On the Shanghai Stock Exchange, there are on average 20.2 trading days in each month, making it 850 trading days per 3.5-year short cycle (3.5*12*20.2 = 849.7 = ~850 trading days). Two 3.5-year short cycles together constitute a 7-year intermediate cycle.
If we calculate the daily return over the 850-day market trading cycle, in theory we should discern certain cyclical patterns in the return variances. The length of the economic cycle should coincide with the significant inflection points on the moving average.
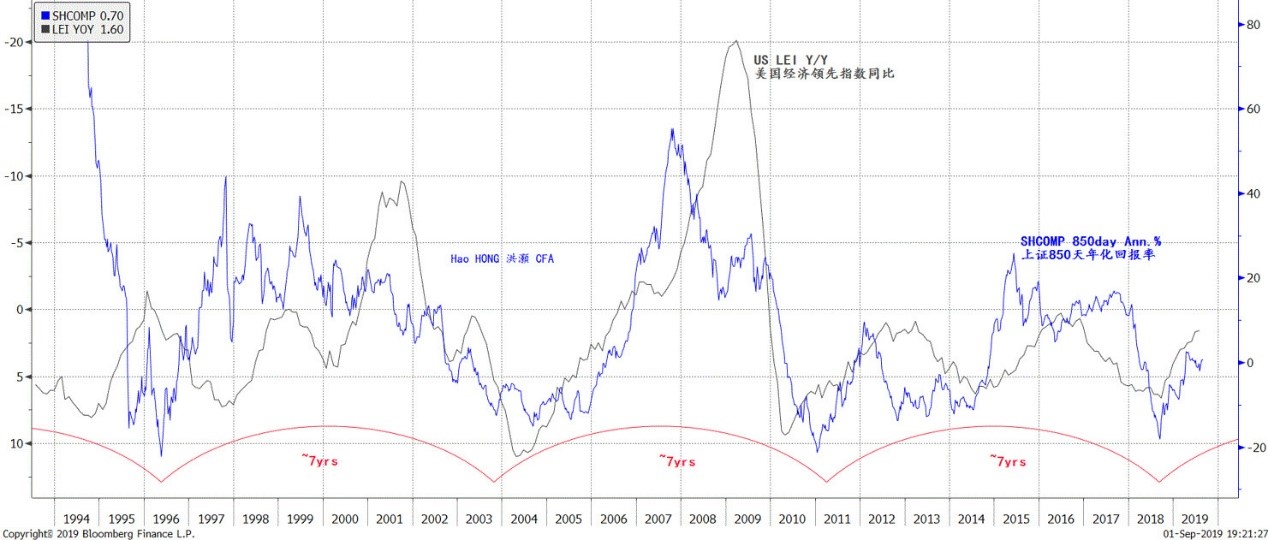
Indeed, in Figure 4, we demonstrate how the China market return traverses over the 7-year intermediate cycle consisting of two 850-day short cycles. Meanwhile, we also show a close correlation between the 850-day market return and the US leading economic indicator. See how they oscillate in tandem in Figure 4. This is one of the strongest evidence yet showing a definitive cyclical pattern in China’s stock market return, as well as the interdependence between the US economy and that of China.
Figure 4: The 7-year cycle in the 850-day ann. return of the Shanghai Comp. (3.5 years = ~850 trading days)
Source: Bloomberg, BOCOM Int'l
The significance of any cyclical model is to evaluate and forecast the underlying trend less perceptible to many, as well as the approximate timing of turning points. Such forecasts, albeit with no guarantee, improve the odds of profiting. As a macro strategist, we need to go beyond economic forecasting to infer the market impact of our forecasts. Our cyclical models, with a consistent track record since their development, appear to be pointing towards the end of the cycle.
How do we apply these economic cycle models to the development of market trading models? What specific keys the models hold to the current trading environment?
The Cycle of China Market Return
“Has the market changed? In short, no. Markets are simply human emotion reflected in $$’s… the way I traded in the 1950’s and made such fantastic money was simply the same method Livermore and Baruch traded before me … It is all about riding huge waves of emotion to the maximum.”
– Nicolas Darvas, dancer, self-taught investor and best-selling author
The short economic cycles ebb and flow with regularity. We observe similarity and simultaneity of fluctuations across various macroeconomic variables and across countries. The cycles seem to be fluctuating rhythmically around its underlying trend. Intuitively, the stock market is a barometer of economic conditions; its price movements must inherently reflect the underlying economic fundamentals.
Previously, we based our market forecast on the covariance between the market and the economic cycles, and have attained notable success (please refer to reports “Outlook 2018: View from the Peak” on 20171204, and “Outlook 2019: Turning a Corner” on 20181119).
By now, we have established that the Chinese economy runs on a 3.5-year cycle. The question is how exactly this cycle is being reflected by the stock market. As we know, there are 42 months in 3.5 years. On the Shanghai Stock Exchange, there are on average 20.2 trading days in each month, making it 850 trading days per 3.5-year short cycle (3.5*12*20.2 = 849.7 = ~850 trading days). Two 3.5-year short cycles together constitute a 7-year intermediate cycle.
If we calculate the daily return over the 850-day market trading cycle, in theory we should discern certain cyclical patterns in the return variances. The length of the economic cycle should coincide with the significant inflection points on the moving average.
Indeed, in Figure 4, we demonstrate how the China market return traverses over the 7-year intermediate cycle consisting of two 850-day short cycles. Meanwhile, we also show a close correlation between the 850-day market return and the US leading economic indicator. See how they oscillate in tandem in Figure 4. This is one of the strongest evidence yet showing a definitive cyclical pattern in China’s stock market return, as well as the interdependence between the US economy and that of China.
Figure 4: The 7-year cycle in the 850-day ann. return of the Shanghai Comp. (3.5 years = ~850 trading days)
 Source: Bloomberg, BOCOM Int'l
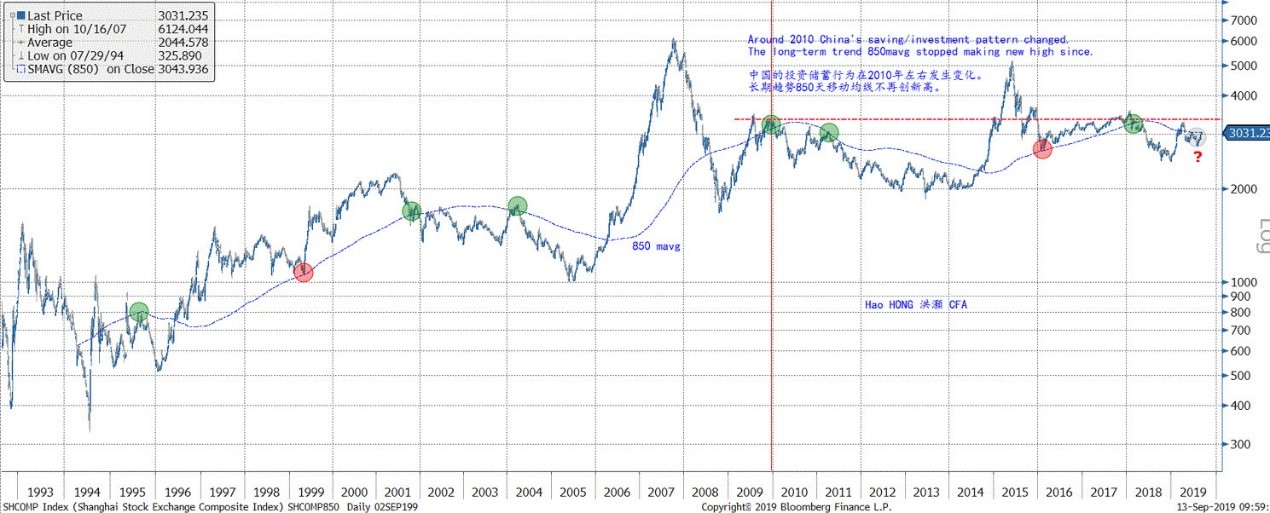
If we simply draw an 850-day moving average on a log-scale price chart of the Shanghai Composite, we can see that the moving average line has been crisscrossing as significant support and resistance level at many significant turning points in history (Figure 5; Red circles denote significant support, while green circles denote significant resistance). Such observations are consistent with the hypothesis aforementioned, and confirm the significance of the 850-day cyclical return patterns derived from our thesis on the 3.5-year short economic cycle.
Figure 5: The 850-day moving average works as significant support and resistance of Shanghai Composite
Source: Bloomberg, BOCOM Int'l
If we simply draw an 850-day moving average on a log-scale price chart of the Shanghai Composite, we can see that the moving average line has been crisscrossing as significant support and resistance level at many significant turning points in history (Figure 5; Red circles denote significant support, while green circles denote significant resistance). Such observations are consistent with the hypothesis aforementioned, and confirm the significance of the 850-day cyclical return patterns derived from our thesis on the 3.5-year short economic cycle.
Figure 5: The 850-day moving average works as significant support and resistance of Shanghai Composite
 Source: Bloomberg, BOCOM Int'l
Visible in Figure 5, the 850-day moving average works as a converging line which the index prices above or below it gravitate towards in the long run. That is, the Shanghai Composite exhibits strong characteristic of mean-reversion. A usual application of moving average is comparing the distance of spot price with the average to gauge the sustainability of an underlying trend.
Yet, in Figure 6, we instead sum the index prices at each intervals of the Shanghai Composite crossing above (areas in blue) or below (areas in grey) the moving average. We note that, the year 2010, a time after 2008 from which China was still trying to heal, appears to be a watershed year.
Before 2010, the underlying trend of the Shanghai Composite was rising, as evidenced by the sum of the areas above the 850-day moving average larger than that below. But, after 2010, the sum of the areas above and below is largely in balance. Since then, the moving average has stopped making new highs, and has been confined in a trading range. Since the crash in late January 2018, the sum of index areas has turned negative, weighing down the Shanghai Composite (Figure 6). Now, the Shanghai Composite is right beneath the 850-day moving average. As such, the market is at an important inflection point.
Figure 6: Area size of Shanghai Composite’s price above and below its 850mavg
Source: Bloomberg, BOCOM Int'l
Visible in Figure 5, the 850-day moving average works as a converging line which the index prices above or below it gravitate towards in the long run. That is, the Shanghai Composite exhibits strong characteristic of mean-reversion. A usual application of moving average is comparing the distance of spot price with the average to gauge the sustainability of an underlying trend.
Yet, in Figure 6, we instead sum the index prices at each intervals of the Shanghai Composite crossing above (areas in blue) or below (areas in grey) the moving average. We note that, the year 2010, a time after 2008 from which China was still trying to heal, appears to be a watershed year.
Before 2010, the underlying trend of the Shanghai Composite was rising, as evidenced by the sum of the areas above the 850-day moving average larger than that below. But, after 2010, the sum of the areas above and below is largely in balance. Since then, the moving average has stopped making new highs, and has been confined in a trading range. Since the crash in late January 2018, the sum of index areas has turned negative, weighing down the Shanghai Composite (Figure 6). Now, the Shanghai Composite is right beneath the 850-day moving average. As such, the market is at an important inflection point.
Figure 6: Area size of Shanghai Composite’s price above and below its 850mavg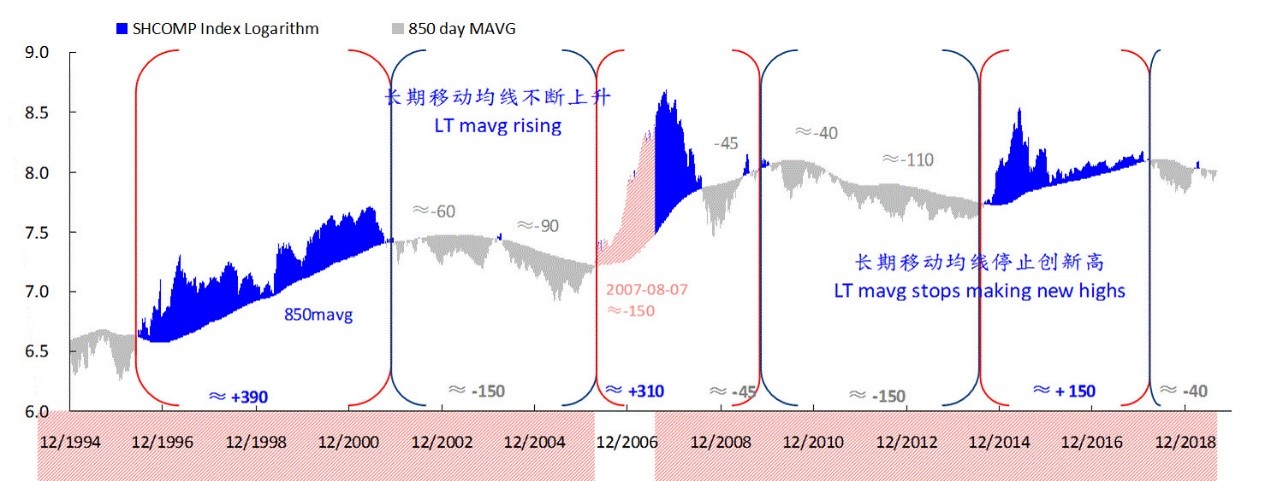 Source: Bloomberg, BOCOM Int'l
Incidentally, studies from the Foundation for the Study of Cycles (FSC), the board of which includes Thomas Demark with consistent track record of identifying cycle inflection points with his proprietary Demark indicator, have also confirmed the existence of a stock market cycle of 40.68 months in wave length, using 200 years of trading data since 1789. A 41.6-month cycle is more prominent post war, and has been persisting since. This 42-month stock market cycle had also been identified by Rothschild in 1912, and Kitchin in 1923, independently.
The “Tidal-Wave” theory of forecasting China market
“Everything you need to know is right there in front of you.” – Jesse Livermore
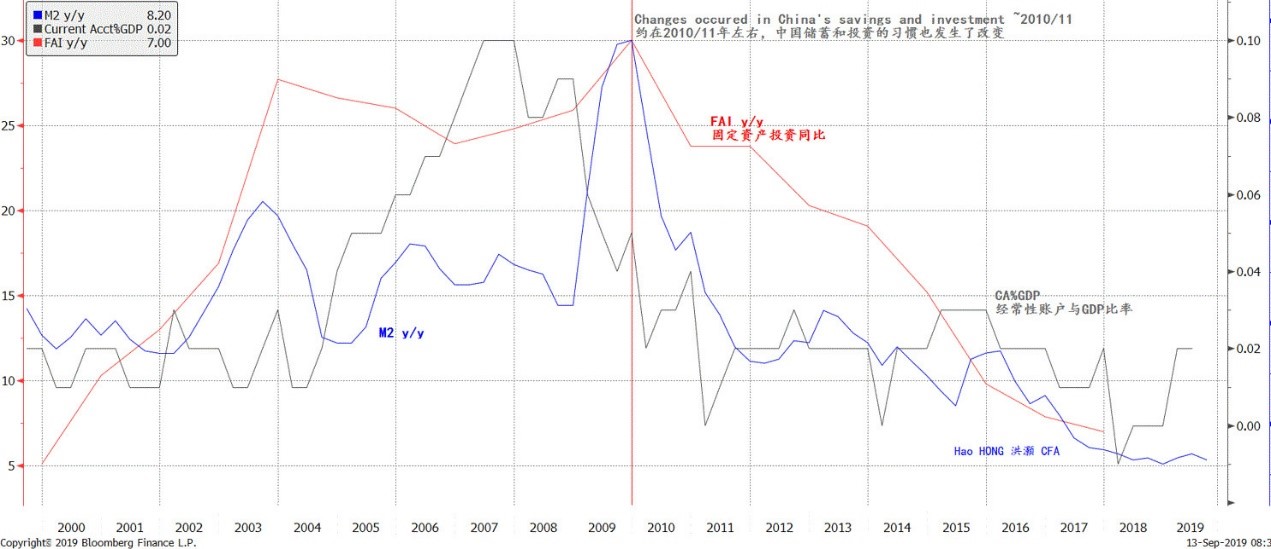
Why is the year 2010 a watershed year? In our previous report titled “Market Inflection Point is Confirmed” (20190322), we discussed how Chinese habits of saving and investment changed significantly around 2010. The accumulation of current account surplus slowed sharply after 2009. It is a reflection of declining macro savings rate, and of China’s lesser ability to attract foreign savings. As savings equal investment, fixed asset investment (FAI) growth slowed in tandem. Meanwhile, broad money supply growth (M2) also fell, corresponding to the slowing accumulation of positions for FX purchase (Figure 7).
Figure 7: Savings = Investment; China’s saving/investment pattern has changed significantly since 2010
Source: Bloomberg, BOCOM Int'l
Incidentally, studies from the Foundation for the Study of Cycles (FSC), the board of which includes Thomas Demark with consistent track record of identifying cycle inflection points with his proprietary Demark indicator, have also confirmed the existence of a stock market cycle of 40.68 months in wave length, using 200 years of trading data since 1789. A 41.6-month cycle is more prominent post war, and has been persisting since. This 42-month stock market cycle had also been identified by Rothschild in 1912, and Kitchin in 1923, independently.
The “Tidal-Wave” theory of forecasting China market
“Everything you need to know is right there in front of you.” – Jesse Livermore
Why is the year 2010 a watershed year? In our previous report titled “Market Inflection Point is Confirmed” (20190322), we discussed how Chinese habits of saving and investment changed significantly around 2010. The accumulation of current account surplus slowed sharply after 2009. It is a reflection of declining macro savings rate, and of China’s lesser ability to attract foreign savings. As savings equal investment, fixed asset investment (FAI) growth slowed in tandem. Meanwhile, broad money supply growth (M2) also fell, corresponding to the slowing accumulation of positions for FX purchase (Figure 7).
Figure 7: Savings = Investment; China’s saving/investment pattern has changed significantly since 2010
 Source: Bloomberg, BOCOM Int'l
The Chinese and the US economies used to complement each other very closely. China produces, America consumes. As such, the US current account deficit, the result of excess US consumption, used to be an important source of liquidity to China’s monetary system. As the US households tried to deleverage after 2008, the US current account deficit as a percentage of US GDP has in fact improved substantially. China’s falling current account surplus as a percentage of GDP is in part a mirror image of improving US current account balance. And, hence, China’s falling money supply growth.
This is an important observation for asset pricing. Broad money supply growth used to be essential to the performance of Chinese stocks. As money growth decelerates, the rising long-term trend before 2010 has essentially stopped, and is replaced by a confined trading range. From the previous era of sharing a growing pie, we have officially entered the new era of zero-sum game.
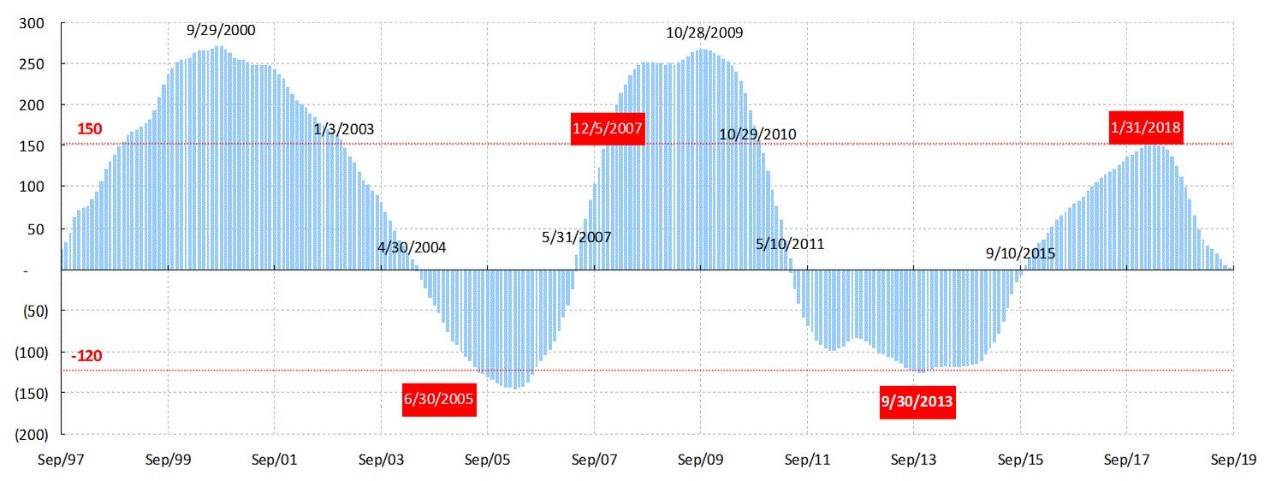
In an era of zero-sum game, the 850-day moving average has even more significant implications in market forecasts. In such an era when the market is bound by a well-defined trading range, market index will continue to fluctuate around the moving average. When we sum the rolling 850 days of index deviation from the 850-day moving average, we can show that this rolling sum also has well-defined range of tops and bottoms, and is particularly adept at pinpointing the bottom of the Shanghai Composite (Figure 8).
Figure 8: The rolling 850-day sum of the index deviation from trend has a well-defined pattern
Source: Bloomberg, BOCOM Int'l
The Chinese and the US economies used to complement each other very closely. China produces, America consumes. As such, the US current account deficit, the result of excess US consumption, used to be an important source of liquidity to China’s monetary system. As the US households tried to deleverage after 2008, the US current account deficit as a percentage of US GDP has in fact improved substantially. China’s falling current account surplus as a percentage of GDP is in part a mirror image of improving US current account balance. And, hence, China’s falling money supply growth.
This is an important observation for asset pricing. Broad money supply growth used to be essential to the performance of Chinese stocks. As money growth decelerates, the rising long-term trend before 2010 has essentially stopped, and is replaced by a confined trading range. From the previous era of sharing a growing pie, we have officially entered the new era of zero-sum game.
In an era of zero-sum game, the 850-day moving average has even more significant implications in market forecasts. In such an era when the market is bound by a well-defined trading range, market index will continue to fluctuate around the moving average. When we sum the rolling 850 days of index deviation from the 850-day moving average, we can show that this rolling sum also has well-defined range of tops and bottoms, and is particularly adept at pinpointing the bottom of the Shanghai Composite (Figure 8).
Figure 8: The rolling 850-day sum of the index deviation from trend has a well-defined pattern
 Source: Bloomberg, BOCOM Int'l
A few notable features in Figure 8:
(1) The areas, or the cumulative areas peak at ~250, while bottom at -120 to -150. If we use +150 when the area size is rising, and -120 when the area size is falling as the trading rules for a long-only strategy, there have been only two entries into and two exits from the trades in the past twenty odd years. But each of these entries and exits corresponds to a significant market inflection point. The first trade between June 2005 and December 2007 returns ~500% - it is almost perfect; while the second trade between September 2013 and January 2018 returns ~70%, it didn’t spot the bubble in 2015. Note that the 850-day moving average is a slow moving average, and is not suitable for short-term trading. All other dates marked in Figure 8 can be potential exit points.
(2) In the era of zero-sum game, the blue areas in Figure 8 alternate between positive and negative of similar area size for a prolonged period of time, reflecting the phenomenon that the index prices oscillate around the 850-day moving average. The area size has peaked and has been falling since 29 January 2018 (“The Year of the Dog”, 20180131), and is now around zero. That is, the market is at an important inflection point.
(3) The process is essentially to calculate the deviation of the index spot price from the 850-day moving average first-in-first-out, with the latest deviations to replace the oldest ones. Because of recency, the negative prices below the moving average since January 2018 will gradually increase their weights (influences) in the new moving average calculation, as time passes and prices evolve forward. Without significant structural reform of China’s economy and its markets, the 850-day moving average will persist as a significant resistance level. And ~3,200 will remain as a significant top for the underlying trend. The next move in the cumulative blue area in Figure 8 is more likely to be down than up, given history.
Figure 9: Our “Tidal Wave” forecast theory, with cumulative area = 0 as the water surface
Source: Bloomberg, BOCOM Int'l
A few notable features in Figure 8:
(1) The areas, or the cumulative areas peak at ~250, while bottom at -120 to -150. If we use +150 when the area size is rising, and -120 when the area size is falling as the trading rules for a long-only strategy, there have been only two entries into and two exits from the trades in the past twenty odd years. But each of these entries and exits corresponds to a significant market inflection point. The first trade between June 2005 and December 2007 returns ~500% - it is almost perfect; while the second trade between September 2013 and January 2018 returns ~70%, it didn’t spot the bubble in 2015. Note that the 850-day moving average is a slow moving average, and is not suitable for short-term trading. All other dates marked in Figure 8 can be potential exit points.
(2) In the era of zero-sum game, the blue areas in Figure 8 alternate between positive and negative of similar area size for a prolonged period of time, reflecting the phenomenon that the index prices oscillate around the 850-day moving average. The area size has peaked and has been falling since 29 January 2018 (“The Year of the Dog”, 20180131), and is now around zero. That is, the market is at an important inflection point.
(3) The process is essentially to calculate the deviation of the index spot price from the 850-day moving average first-in-first-out, with the latest deviations to replace the oldest ones. Because of recency, the negative prices below the moving average since January 2018 will gradually increase their weights (influences) in the new moving average calculation, as time passes and prices evolve forward. Without significant structural reform of China’s economy and its markets, the 850-day moving average will persist as a significant resistance level. And ~3,200 will remain as a significant top for the underlying trend. The next move in the cumulative blue area in Figure 8 is more likely to be down than up, given history.
Figure 9: Our “Tidal Wave” forecast theory, with cumulative area = 0 as the water surface
 Source: BOCOM Int'l
We can draw an analogy between our forecasting methodology and how a boat fully loaded with cargo floats in water. As the cumulative area starts to fall, as if heavier cargo is loaded onto the boat (lower prices) to replace the lighter cargo (higher prices), the index will be dragged lower – similar to how the boat will gradually sink deeper under the water surface. When the cumulative area size turns negative, each new area calculated by subtracting the index spot price from the moving average will remain negative, corresponding to lower spot prices and falling moving average. It is like a boat submerging deeper under water (Figure 9).
As such, we term this forecast methodology the “Tidal Wave” forecast theory.
Applying our “Tidal Wave” theory to the US market
“A strict periodicity in social and economic phenomena does not exist at all – neither in the long nor in the intermediate waves. The length of the later fluctuates at least between 7 and 11 years. The length of the long cycles fluctuates between 48 and 60 years …
The long waves that we have established above … are international … the same timing holds also for the United States. The dynamics in the development of capitalism, however, and especially the timing of the fluctuations in the latter country may have peculiarities.”
– Nikolai D. Kondratieff, the Long Waves in Economic Life
Robert Pretcher, a renowned Elliot-Wave theorist, believes a Kondratieff Wave averages 54 years, consisting of roughly 5 intermediate cycles of 10.5 to 11 years, or 15 short cycles. After discovering the 850-day return cycle in the Shanghai Composite, we wonder whether this cycle derived from our theory of short economic cycles of 3.5 years will work in the US market, given the close correlation between the economic cycles in China and the US.
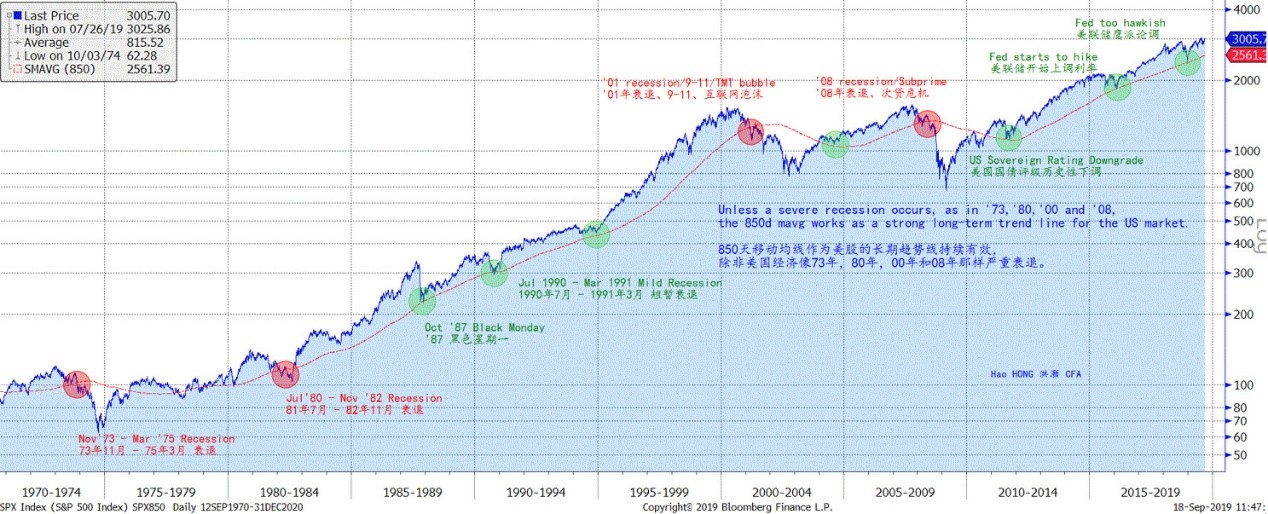
We find that the 850-day moving average works even better for the US market – except that it works slightly differently. This moving average serves as the long-term trend line for S&P 500. The S&P 500 index runs mostly above this long-term trend line – unlike in China where the average works as a converging line for spot prices oscillating above and below.
Figure 10: The 850mavg a long-term trend for SPX; Only severe recessions with crises had punctured it
Source: BOCOM Int'l
We can draw an analogy between our forecasting methodology and how a boat fully loaded with cargo floats in water. As the cumulative area starts to fall, as if heavier cargo is loaded onto the boat (lower prices) to replace the lighter cargo (higher prices), the index will be dragged lower – similar to how the boat will gradually sink deeper under the water surface. When the cumulative area size turns negative, each new area calculated by subtracting the index spot price from the moving average will remain negative, corresponding to lower spot prices and falling moving average. It is like a boat submerging deeper under water (Figure 9).
As such, we term this forecast methodology the “Tidal Wave” forecast theory.
Applying our “Tidal Wave” theory to the US market
“A strict periodicity in social and economic phenomena does not exist at all – neither in the long nor in the intermediate waves. The length of the later fluctuates at least between 7 and 11 years. The length of the long cycles fluctuates between 48 and 60 years …
The long waves that we have established above … are international … the same timing holds also for the United States. The dynamics in the development of capitalism, however, and especially the timing of the fluctuations in the latter country may have peculiarities.”
– Nikolai D. Kondratieff, the Long Waves in Economic Life
Robert Pretcher, a renowned Elliot-Wave theorist, believes a Kondratieff Wave averages 54 years, consisting of roughly 5 intermediate cycles of 10.5 to 11 years, or 15 short cycles. After discovering the 850-day return cycle in the Shanghai Composite, we wonder whether this cycle derived from our theory of short economic cycles of 3.5 years will work in the US market, given the close correlation between the economic cycles in China and the US.
We find that the 850-day moving average works even better for the US market – except that it works slightly differently. This moving average serves as the long-term trend line for S&P 500. The S&P 500 index runs mostly above this long-term trend line – unlike in China where the average works as a converging line for spot prices oscillating above and below.
Figure 10: The 850mavg a long-term trend for SPX; Only severe recessions with crises had punctured it
 Source: Bloomberg, BOCOM Int'l
Only severe recessions concurrent with crises were able to sink the index substantially below the moving average. There have only been four such instances in the past five decades: the recession between ’73 and ’75 with the oil crisis; between ’80 and ’82 with runaway inflation and the most hawkish Fed ever; in ’01 with the burst of TMT bubble and 9-11, as well as in ’08 with the subprime crisis. In all other instances, the index plunged towards the 850-day moving average, and rebounded subsequently after finding support at the moving average. Not even the “Black Monday” in October 1987 or the mild recession in 1990 amid the first “Gulf War” was able to penetrate this long-term rising trend (Figure 10).
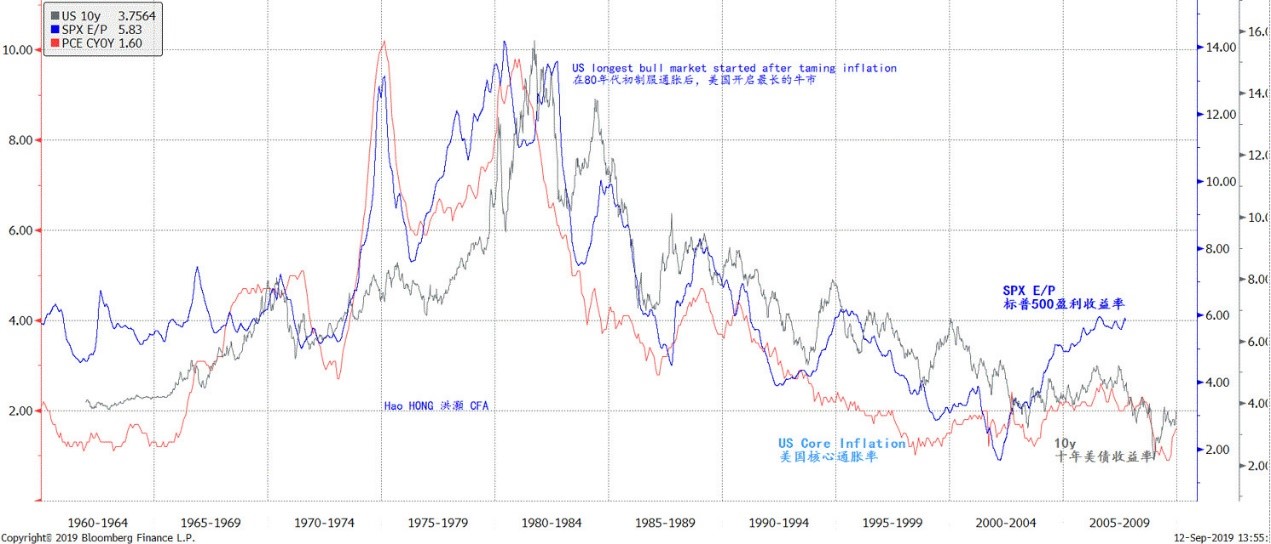
We note that the rising long-term trend in the US market started after the recession in ’82, after Paul Volcker hiked interest rate significantly to tame inflation. Volcker’s monetary policy choice was very unpopular at the time, and received heated protests from then-President Reagan.
We can infer that the necessary ingredients of a secular bull market from the observations in that period: expansionary fiscal policy, rising productivity, falling inflation and interest rate, with monetary policy support from the central bank where required (Figure 11).
Figure 11: Falling inflation after Volcker is key to the ensuing secular US bull market
Source: Bloomberg, BOCOM Int'l
Only severe recessions concurrent with crises were able to sink the index substantially below the moving average. There have only been four such instances in the past five decades: the recession between ’73 and ’75 with the oil crisis; between ’80 and ’82 with runaway inflation and the most hawkish Fed ever; in ’01 with the burst of TMT bubble and 9-11, as well as in ’08 with the subprime crisis. In all other instances, the index plunged towards the 850-day moving average, and rebounded subsequently after finding support at the moving average. Not even the “Black Monday” in October 1987 or the mild recession in 1990 amid the first “Gulf War” was able to penetrate this long-term rising trend (Figure 10).
We note that the rising long-term trend in the US market started after the recession in ’82, after Paul Volcker hiked interest rate significantly to tame inflation. Volcker’s monetary policy choice was very unpopular at the time, and received heated protests from then-President Reagan.
We can infer that the necessary ingredients of a secular bull market from the observations in that period: expansionary fiscal policy, rising productivity, falling inflation and interest rate, with monetary policy support from the central bank where required (Figure 11).
Figure 11: Falling inflation after Volcker is key to the ensuing secular US bull market
 Source: Bloomberg, BOCOM Int'l
Market Outlook
“Men who can both be right and sit tight are uncommon. I found it one of the hardest things to learn… it never was my thinking that made the big money for me. It always was my sitting. Got that? My sitting tight!” – Jesse Livermore
By now, we have demonstrated how our theory of short/intermediate economic cycle can be applied to forecasting China’s stock market. The wave length of the economic cycle and the stock market return cycle is consistent, and the 850-day moving average derived from this wave length coincides with significant inflection points in China’s stock market. As such, the moving average is indeed the market’s long-term trend. Ricardo’s trend-flowing insight from his intuition as an economist continues to work today.
One of Ricardo’s contemporaries and his soul mate, Thomas Malthus, collaborated with Ricardo in an unusual way - through series of lively public debates on various important economic issues during the time. Most notably, the “Corn Law” controversy that pitted the friends on opposite sides of the debate laid the foundation for Malthus’s principle on rent, and Ricardo’s principle of comparative advantage, both of which are cornerstones of modern macroeconomics.
During the debate on economic “gluts” with Ricardo, Malthus argued that total demand could be smaller than total output in full employment. Malthus later continued in his magnum opus “Principle” on the necessity of an unproductive class of consumers to absorb the excess supply. Keynes acknowledged Malthus as his predecessor on the Keynesian equilibrium in underemployment. To no avail, Ricardo could “see no soundness of the reasons … for the usefulness of demand on the part of unproductive consumers”.
As Ricardo’s rising trend evolved into a trading range in China’s stock market after the change in Chinese habit of saving around 2010, a new source of liquidity will be the necessary condition to initiate a new rising trend. Meanwhile, China has been undergoing reforms on its exchange rate since 2015 and interest rate policy in 2019. And China’s “Reform and Opening” has deepened and accelerated. These are milestone reforms, and upon their completion China will regain the sovereignty on its monetary policy - away from the influence of the Fed.
In our previous reports titled “A Price Revolution” (20161114) and “Decoding Disinflation: Principal Contradiction, Social Progress and Market Fragility” (20171114), we discussed how under compensation relative to productivity gain has created income and wealth disparity, and has been depressing demand and hence inflation. The population in the top wealth percentile resembles Malthus’s “unproductive consumers”, while the total demand from the very large bottom percentiles simply cannot absorb its output proportional to the size of the population falling into these bottom percentiles.
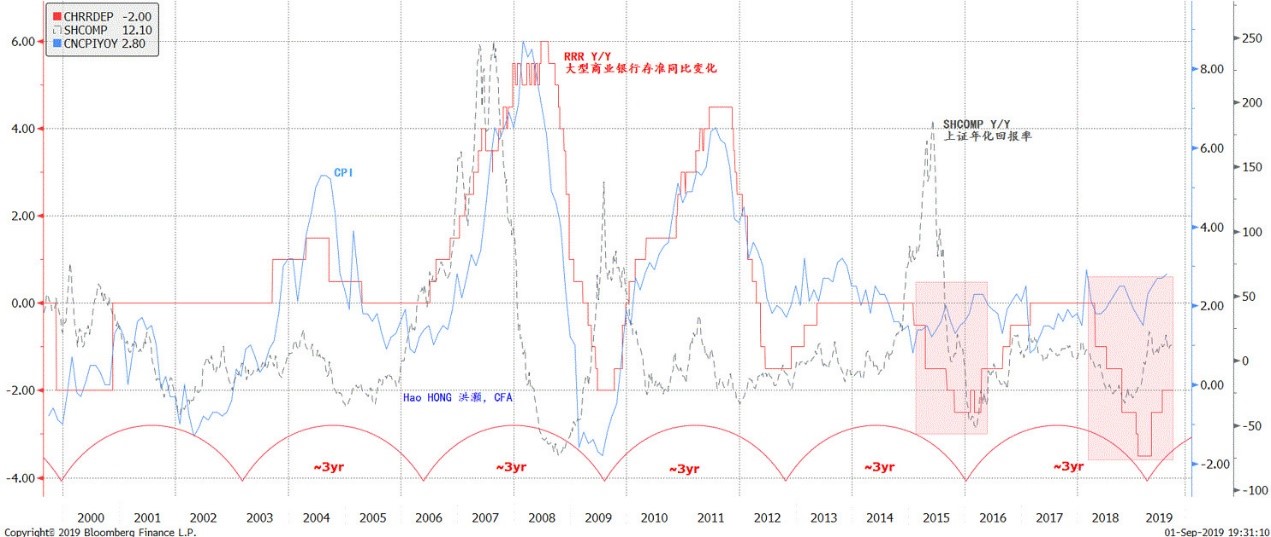
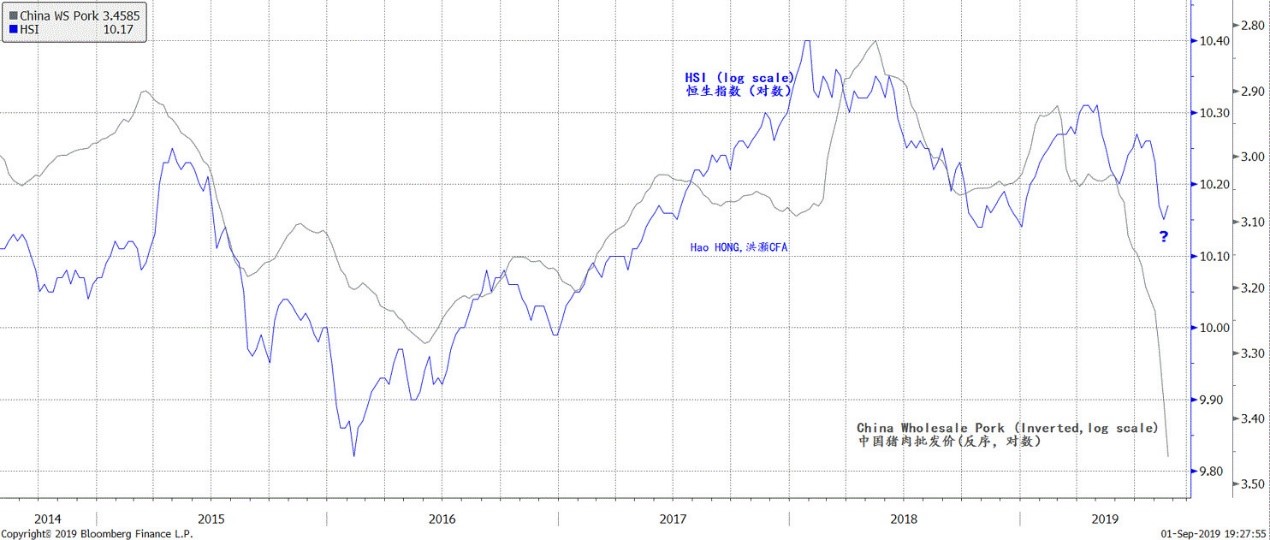
Currently, China has less scope for further easing than thought by consensus, as property and pork price inflation remains elevated (Figure 12). Further in the future, however, the existence of the unproductive class will continue to leave room for interest rate to decline till zero. While still in its early days, China’s monetary independence, its class of unproductive consumers due to income inequity, as well as foreign fund inflows as China’s markets open further and global indexation gets weightier, will be the necessary ingredients to ignite a new rising trend in the future. For now, the 850-day moving average trend line remains a significant hurdle on the Shanghai Composite. And Hong Kong’s downtrend has not been completed (Figure 13). For a new trend to establish, the Shanghai Composite must rise decisively above 3,200 – till now the historical peak of the long-term trend line.
Figure 12: China still has scope for easing, but the scope is less than thought by consensus
Source: Bloomberg, BOCOM Int'l
Market Outlook
“Men who can both be right and sit tight are uncommon. I found it one of the hardest things to learn… it never was my thinking that made the big money for me. It always was my sitting. Got that? My sitting tight!” – Jesse Livermore
By now, we have demonstrated how our theory of short/intermediate economic cycle can be applied to forecasting China’s stock market. The wave length of the economic cycle and the stock market return cycle is consistent, and the 850-day moving average derived from this wave length coincides with significant inflection points in China’s stock market. As such, the moving average is indeed the market’s long-term trend. Ricardo’s trend-flowing insight from his intuition as an economist continues to work today.
One of Ricardo’s contemporaries and his soul mate, Thomas Malthus, collaborated with Ricardo in an unusual way - through series of lively public debates on various important economic issues during the time. Most notably, the “Corn Law” controversy that pitted the friends on opposite sides of the debate laid the foundation for Malthus’s principle on rent, and Ricardo’s principle of comparative advantage, both of which are cornerstones of modern macroeconomics.
During the debate on economic “gluts” with Ricardo, Malthus argued that total demand could be smaller than total output in full employment. Malthus later continued in his magnum opus “Principle” on the necessity of an unproductive class of consumers to absorb the excess supply. Keynes acknowledged Malthus as his predecessor on the Keynesian equilibrium in underemployment. To no avail, Ricardo could “see no soundness of the reasons … for the usefulness of demand on the part of unproductive consumers”.
As Ricardo’s rising trend evolved into a trading range in China’s stock market after the change in Chinese habit of saving around 2010, a new source of liquidity will be the necessary condition to initiate a new rising trend. Meanwhile, China has been undergoing reforms on its exchange rate since 2015 and interest rate policy in 2019. And China’s “Reform and Opening” has deepened and accelerated. These are milestone reforms, and upon their completion China will regain the sovereignty on its monetary policy - away from the influence of the Fed.
In our previous reports titled “A Price Revolution” (20161114) and “Decoding Disinflation: Principal Contradiction, Social Progress and Market Fragility” (20171114), we discussed how under compensation relative to productivity gain has created income and wealth disparity, and has been depressing demand and hence inflation. The population in the top wealth percentile resembles Malthus’s “unproductive consumers”, while the total demand from the very large bottom percentiles simply cannot absorb its output proportional to the size of the population falling into these bottom percentiles.
Currently, China has less scope for further easing than thought by consensus, as property and pork price inflation remains elevated (Figure 12). Further in the future, however, the existence of the unproductive class will continue to leave room for interest rate to decline till zero. While still in its early days, China’s monetary independence, its class of unproductive consumers due to income inequity, as well as foreign fund inflows as China’s markets open further and global indexation gets weightier, will be the necessary ingredients to ignite a new rising trend in the future. For now, the 850-day moving average trend line remains a significant hurdle on the Shanghai Composite. And Hong Kong’s downtrend has not been completed (Figure 13). For a new trend to establish, the Shanghai Composite must rise decisively above 3,200 – till now the historical peak of the long-term trend line.
Figure 12: China still has scope for easing, but the scope is less than thought by consensus
 Source: Bloomberg, BOCOM Int'l
Figure 13: Surging pork price suggests the easing pressure on Hang Seng is likely temporary
Source: Bloomberg, BOCOM Int'l
Figure 13: Surging pork price suggests the easing pressure on Hang Seng is likely temporary
 Source: Bloomberg, BOCOM Int'l
