This article appeared on Forbes.com on May 31, 2017.
Steve H. Hanke, Member of IMI International Committee, Professor of Johns Hopkins University.
In 2014, the U.S. Department of Commerce’s Bureau of Economic Analysis (BEA) started to report a new data series as part of the U.S. national income accounts. In addition to gross domestic product (GDP), the BEA now reports gross output (GO). This has gone unnoticed and unreported — an unfortunate, but not uncommon, oversight on the part of the financial press. Yes, GO represents a significant breakthrough.
A brief review of some history of economic thought reveals why GO is a big deal. The Classical School of Economics prevailed roughly from the time of Adam Smith’s The Wealth of Nations(1776) to the mid-19th century. It focused on the supply side of the economy. Production was the wellspring of prosperity.
The French economist J.B. Say (1767-1832) was a highly regarded member of the Classical School. To this day, he is best known for Say’s Law of Markets. Thanks to John Maynard Keynes, in the popular lexicon, this law simply states that “supply creates its own demand.” But, Keynes’ rendition of Say’s Law distorts its true meaning and leaves its main message on the cutting room floor.
Say’s message was clear: a demand failure could not cause an economic slump. This message was accepted by virtually every major economist, prior to the publication of Keynes’ The General Theory of Employment, Interest and Money in 1936. So, before The General Theory, even though most economists thought business cycles were in the cards, demand failure was not listed as one of the causes of an economic downturn.
All this was overturned by Keynes. Keynes set J.B. Say up as a straw man so that he could remove Say’s ideas from economic discourse and the public’s thinking. Keynes had to do this because his entire theory was based on the analysis of demand failure, and his prescription for putting life back into aggregate demand — namely, a fiscal stimulus (read: lower taxes and/or higher government spending).
Keynes was wildly successful. With the publication of The General Theory, the supply side of the economy almost entirely vanished. It was replaced by aggregate demand, which was faithfully reported in the national income accounts. In consequence, aggregate demand has dominated economic discourse and policy ever since. The structure of the economy — the supply side — is nowhere to be found.
Then came the supply-side revolution in the 1980s. It was associated with the likes of Nobelist Robert Mundell. This revolution was carried out, in large part, on the pages of The Wall Street Journal, where J.B. Say reappeared like a phoenix. The Journal’s late-editor Robert Bartley recounts the centrality of Say in his book The Seven Fat Years: And How to Do It Again (1992): “I remember Art Laffer telling me I had to learn Say’s Law. ‘That’s what I believe in’, he professed. ‘That’s what you believe in.’”
Importantly, we now have official supply-side data on the structure of the economy, namely gross output (GO). And when it comes to the public and the debate about public policies, there is nothing quite like official data. GO measures total economic activity at all stages of production. It is analogous to “topline” (read: total revenue or sales) data in business financial statements. It is reported on a quarterly basis, with 2016 Q4 being the most recent. GO data will complement, not replace, traditional GDP data, which are “bottomline” data, analogous to gross profits on business financial statements. GO data will improve our understanding of the magnitude of business activity and our understanding of the business cycle.
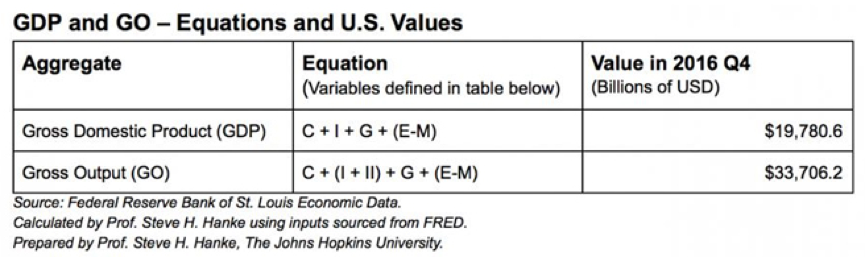
U.S. gross domestic product and gross output.
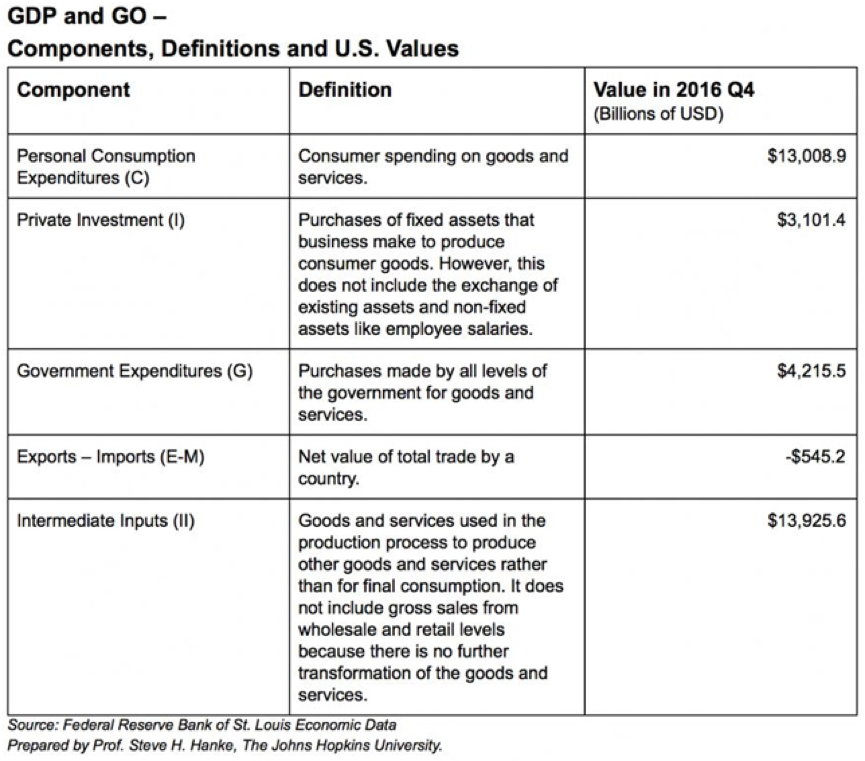 U.S. gross domestic product and gross output components.
What makes up the conventional measure of GDP and the new GO measure? The tables below answer that question.
These changes are big, not only conceptually, but also numerically. Indeed, in 2016 Q4 GO was 73.8% larger than GDP. Why? Because GDP only measures the value of all final goods and services in the economy. GDP ignores all the intermediate steps required to produce GDP. GO corrects for most of those omissions.
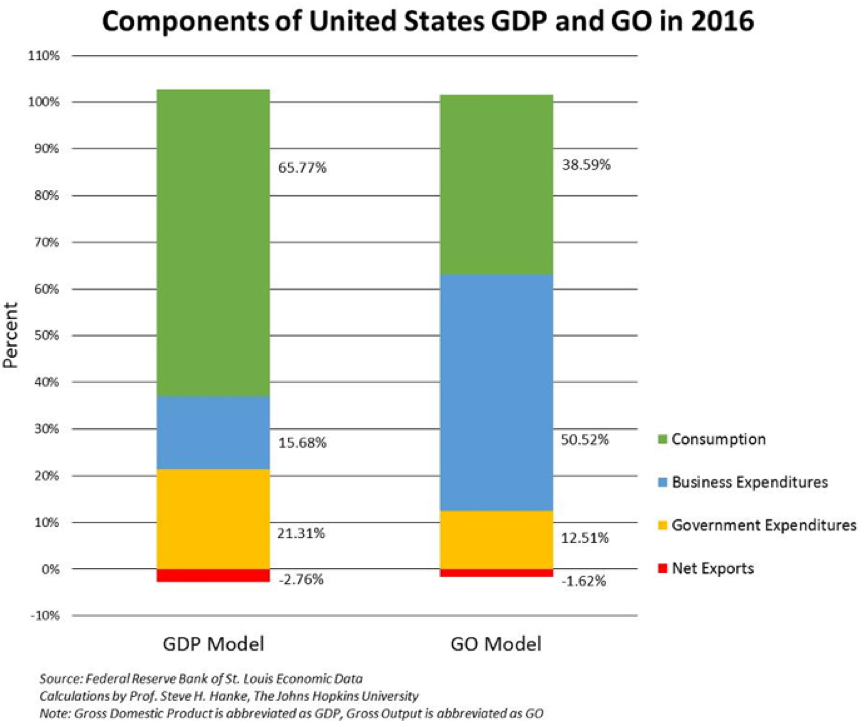
Even though the always clever Keynes temporarily buried J.B. Say, the great Say is back. With that, the relative importance of consumption and government expenditures withers away (see the accompanying bar charts).
 U.S. gross domestic product and gross output components.
Contrary to what the standard textbooks have taught us and what that pundits repeat ad nauseam, consumption is not the big elephant in the room. The elephant is business expenditures.
Using the best proxy for aggregate demand and the supply-side GO measure, we obtain a clear picture of the current state of play in the U.S. economy. The chart below shows a continued growth recession: growth but growth below its trend rate. This shouldn’t be surprising. The growth rate of the broad money supply (Divisia M4) determines the growth rate in key nominal variables — like aggregate demand. Broad money grew at 4.95% on average for 2016. So, it’s no surprise that nominal aggregate demand was 4.46% and nominal GO was 4.006% in 2016 — both growing but below trend. That said, GO is a leading indicator, and it is surging. But, broad money growth is slowing. So, the picture remains one in which the U.S. will probably be stuck in a growth recession for the foreseeable future.
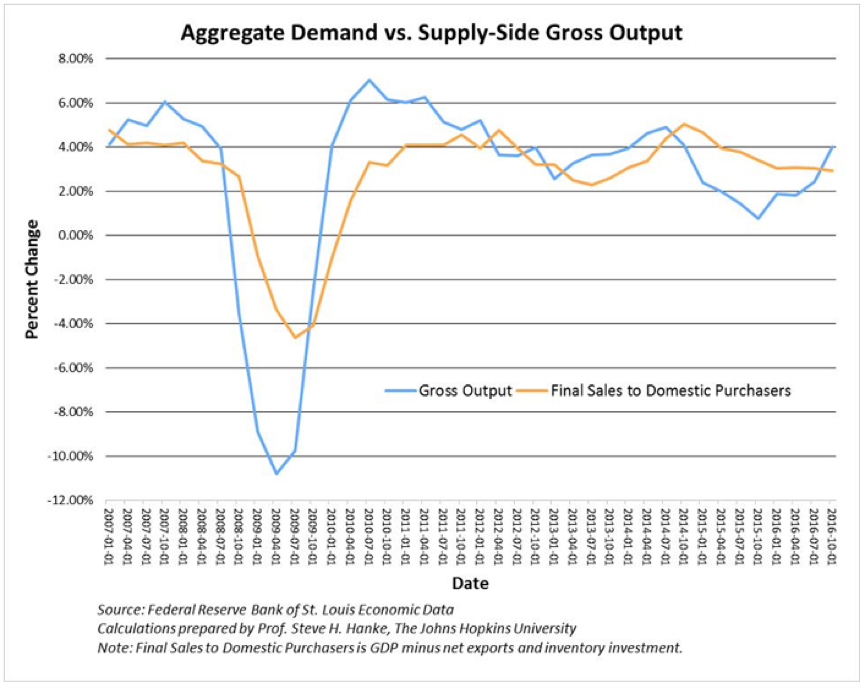 U.S. final sales to domestic purchasers vs. gross output.
