Herbert Poenisch: The BIS Statistical Ingredients in the RMB Internationalisation Index (RII)
2017-05-07 IMI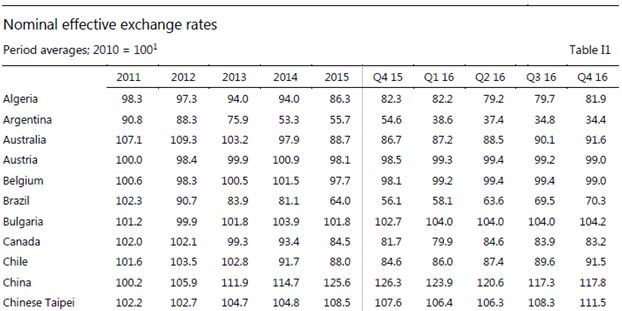 Table 1: Source: https://www.bis.org/statistics/eer.htm?m=6%7C187
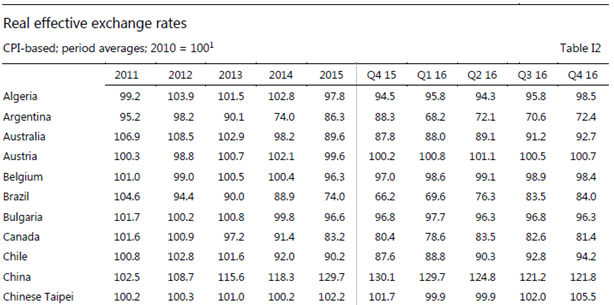 Table 2: Source: https://www.bis.org/statistics/eer.htm?m=6%7C187
USE: the NEER and REER are indicators of international price competitiveness. The published data clearly show that China has the highest rate of appreciation of the NEER as well as the REER which repudiates any suggestion of currency manipulation.
2. The 2016 Triennial survey of foreign exchange and derivatives activities
The BIS is the only institution which conducts such a survey on a regular basis, every three years since 1998. The resulthttps://www.bis.org/publ/rpfx16.htm?m=6%7C35shows a breakdown into currencies, instruments, counterparts and locations.
Central banks and other authorities in 52 jurisdictions participated in the 2016 survey,collecting data from close to 1,300 banks and other dealers. It asks reporting institutions to compile data on spot forex trades and derivatives, such as swaps, futures, forwards and options on a normal trading day in April 2016. The reporters have to adhere to very strict reporting guidelines https://www.bis.org/statistics/triennialrep/2016survey_guidelinesturnover.pdf
According to this survey the CNY has doubled its share in the turnover ever since 2010 reflecting the increased use of RMB in international transactions, reaching 4 percent (out of 200%) included in currency pairs (see below).
Table 2: Source: https://www.bis.org/statistics/eer.htm?m=6%7C187
USE: the NEER and REER are indicators of international price competitiveness. The published data clearly show that China has the highest rate of appreciation of the NEER as well as the REER which repudiates any suggestion of currency manipulation.
2. The 2016 Triennial survey of foreign exchange and derivatives activities
The BIS is the only institution which conducts such a survey on a regular basis, every three years since 1998. The resulthttps://www.bis.org/publ/rpfx16.htm?m=6%7C35shows a breakdown into currencies, instruments, counterparts and locations.
Central banks and other authorities in 52 jurisdictions participated in the 2016 survey,collecting data from close to 1,300 banks and other dealers. It asks reporting institutions to compile data on spot forex trades and derivatives, such as swaps, futures, forwards and options on a normal trading day in April 2016. The reporters have to adhere to very strict reporting guidelines https://www.bis.org/statistics/triennialrep/2016survey_guidelinesturnover.pdf
According to this survey the CNY has doubled its share in the turnover ever since 2010 reflecting the increased use of RMB in international transactions, reaching 4 percent (out of 200%) included in currency pairs (see below).
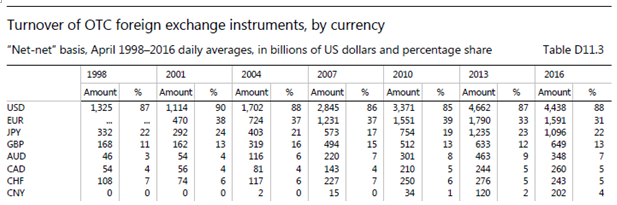 Table 3: Source: https://www.bis.org/publ/rpfx16.htm?m=6%7C35
Another interesting result is that the use of RMB for financial transactions (USD 134bn) has overtaken the use for trade (USD 68bn) expressed in spot transactions.
Table 3: Source: https://www.bis.org/publ/rpfx16.htm?m=6%7C35
Another interesting result is that the use of RMB for financial transactions (USD 134bn) has overtaken the use for trade (USD 68bn) expressed in spot transactions.
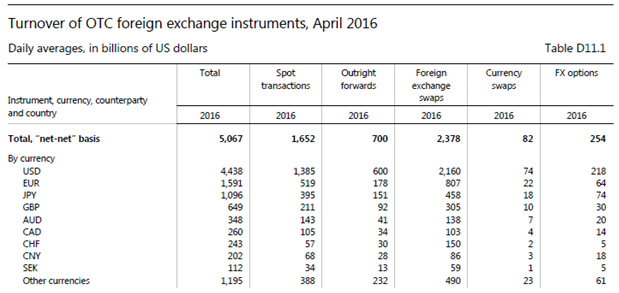 Table 4: Source: https://www.bis.org/publ/rpfx16.htm?m=6%7C35
USE: this is an indicator for the use of a currency in the international foreign exchange market. This market is an OTC market, mainly between foreign exchange dealers. It is a clear illustration that RMB is a maturing currency, used more for financial transactions that just bilateral trade with China[i].
3. Locational banking statistics
The history of the locational banking statistics dates back to the 1970, when the emergence of the euro-dollar market, a market for a currency outside its own jurisdictions was a concern for central bankers. They worried that this development posed a challenge for domestic monetary policy. As a result they commissioned the BIS to collect cross-border banking claims and liabilities, comparable to balance of payments financial account data.
As of 2015 major banks (domestic as well as foreign) with significant cross border business in 46 countries (44 in table5 plus Russia and China) and jurisdictions report their cross-border assets and liabilities to their central banks on a quarterly basis. These pass on the national statistics to the BIS which removes doubled counting. China joined this reporting system in 2015. The reporters have to adhere to strict reporting guidelines: https://www.bis.org/statistics/bankstatsguide_repreqloc.pdf
The locational banking statistics (LBS) are reported with the following important breakdown: currencies, instruments, counterparty sector (see below)
Table 4: Source: https://www.bis.org/publ/rpfx16.htm?m=6%7C35
USE: this is an indicator for the use of a currency in the international foreign exchange market. This market is an OTC market, mainly between foreign exchange dealers. It is a clear illustration that RMB is a maturing currency, used more for financial transactions that just bilateral trade with China[i].
3. Locational banking statistics
The history of the locational banking statistics dates back to the 1970, when the emergence of the euro-dollar market, a market for a currency outside its own jurisdictions was a concern for central bankers. They worried that this development posed a challenge for domestic monetary policy. As a result they commissioned the BIS to collect cross-border banking claims and liabilities, comparable to balance of payments financial account data.
As of 2015 major banks (domestic as well as foreign) with significant cross border business in 46 countries (44 in table5 plus Russia and China) and jurisdictions report their cross-border assets and liabilities to their central banks on a quarterly basis. These pass on the national statistics to the BIS which removes doubled counting. China joined this reporting system in 2015. The reporters have to adhere to strict reporting guidelines: https://www.bis.org/statistics/bankstatsguide_repreqloc.pdf
The locational banking statistics (LBS) are reported with the following important breakdown: currencies, instruments, counterparty sector (see below)
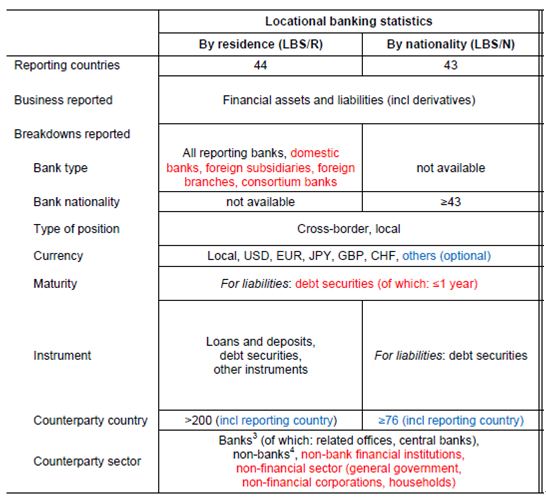 Table 5: Source: BIS Introduction to the banking statistics
The summary sheet gives the total cross-border assets and liabilities in billions of USD and the breakdown into counterparty sectors.https://www.bis.org/statistics/bankstats.htm
Table 5: Source: BIS Introduction to the banking statistics
The summary sheet gives the total cross-border assets and liabilities in billions of USD and the breakdown into counterparty sectors.https://www.bis.org/statistics/bankstats.htm
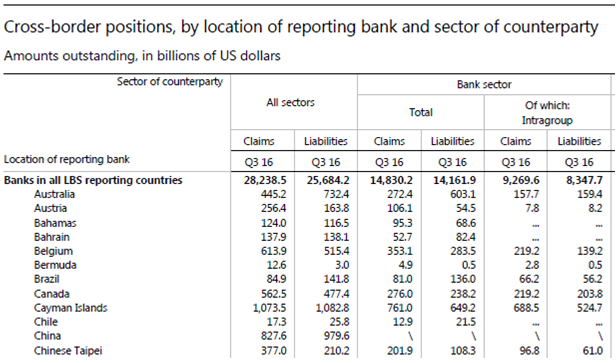 Table 6: Source: BIS LBS 3Q2016
For individual countries (such as China) the currency breakdown is also available.
Table 6: Source: BIS LBS 3Q2016
For individual countries (such as China) the currency breakdown is also available.
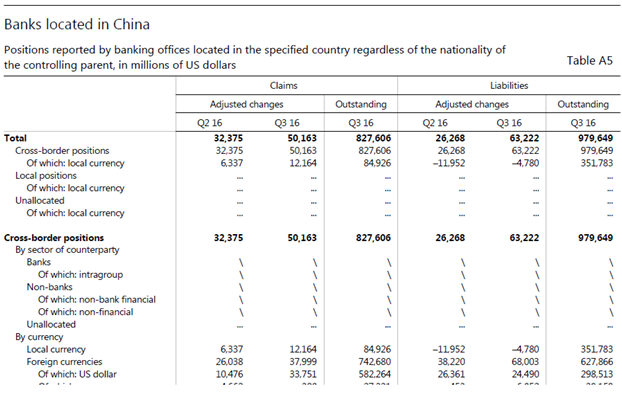 Table 7: Source: BIS LBS 3Q2016
There are again various formats of presenting the data. The pdf is used above, the BIS Statistics Explorer and BIS Statistics Warehouse allows the user customized queries. https://www.bis.org/statistics/bankstats.htm
USE: the data give a summary view of stocks and changes in the past 2 quarters adjusted for changes in the USD exchange rate. In the case of China the cross-border liabilities (USD 979.6bn) were bigger than the cross-border claims (USD 827.6). This means that China has a net liability to the rest of the world[i].
The local currency component shows that liabilities in RMB (USD 351.8 bn) are much larger than the assets in RMB (USD 84.9 bn). The picture is the opposite for assets. The assets of China banks[ii] in USD are much larger (USD 582.3 bn) than the liabilities (USD 298.5 bn). The conclusion is that China banks have a long position in USD and a short position in RMB[iii].
4. BIS Securities Statistics
The purpose of the BIS data on debt securities is to capture the securitized share of the domestic and international debt of a country. They include domestic debt securities (DDS), international debt securities (IDS) and the total debt securities (TDS).https://www.bis.org/statistics/about_securities_stats.htm?m=6%7C33
The DDS are debt securities issued in the local market of the country where the borrower resides, regardless of the currency in which the security is denominated. China has the 3rd biggest domestic securities market in the world, with outstanding issues of USD 9183 bn in the 3Q2016.
The IDS are debt securities issued in a market other than the local market of the country where the borrower resides. They capture issues conventionally known as eurobonds and foreign bonds. The IDS issued by Chinese residents are relatively small amounting only to USD 125 bn in 3Q2016. They include issues by Chinese residents (such as CDB) in RMB (such as in CNH) as well as in foreign currencies.
The TDS are debt securities issued by residents in all markets (the sum of international and domestic debt securities). The BIS does not calculate TDS. This is due to potential overlaps between IDS and DDS statistics.
The data are retrieved by the BIS from published sources according to the Handbook on Securities Statistics (HSS).http://www.imf.org/external/np/sta/wgsd/hbook.htm
The most recent data in pdf format give the following picture for IDS issues in RMB by Chinese residents (banks, other financial and non-financial corporations).https://www.bis.org/statistics/secstats.htm?m=6%7C33%7C615
Table 7: Source: BIS LBS 3Q2016
There are again various formats of presenting the data. The pdf is used above, the BIS Statistics Explorer and BIS Statistics Warehouse allows the user customized queries. https://www.bis.org/statistics/bankstats.htm
USE: the data give a summary view of stocks and changes in the past 2 quarters adjusted for changes in the USD exchange rate. In the case of China the cross-border liabilities (USD 979.6bn) were bigger than the cross-border claims (USD 827.6). This means that China has a net liability to the rest of the world[i].
The local currency component shows that liabilities in RMB (USD 351.8 bn) are much larger than the assets in RMB (USD 84.9 bn). The picture is the opposite for assets. The assets of China banks[ii] in USD are much larger (USD 582.3 bn) than the liabilities (USD 298.5 bn). The conclusion is that China banks have a long position in USD and a short position in RMB[iii].
4. BIS Securities Statistics
The purpose of the BIS data on debt securities is to capture the securitized share of the domestic and international debt of a country. They include domestic debt securities (DDS), international debt securities (IDS) and the total debt securities (TDS).https://www.bis.org/statistics/about_securities_stats.htm?m=6%7C33
The DDS are debt securities issued in the local market of the country where the borrower resides, regardless of the currency in which the security is denominated. China has the 3rd biggest domestic securities market in the world, with outstanding issues of USD 9183 bn in the 3Q2016.
The IDS are debt securities issued in a market other than the local market of the country where the borrower resides. They capture issues conventionally known as eurobonds and foreign bonds. The IDS issued by Chinese residents are relatively small amounting only to USD 125 bn in 3Q2016. They include issues by Chinese residents (such as CDB) in RMB (such as in CNH) as well as in foreign currencies.
The TDS are debt securities issued by residents in all markets (the sum of international and domestic debt securities). The BIS does not calculate TDS. This is due to potential overlaps between IDS and DDS statistics.
The data are retrieved by the BIS from published sources according to the Handbook on Securities Statistics (HSS).http://www.imf.org/external/np/sta/wgsd/hbook.htm
The most recent data in pdf format give the following picture for IDS issues in RMB by Chinese residents (banks, other financial and non-financial corporations).https://www.bis.org/statistics/secstats.htm?m=6%7C33%7C615
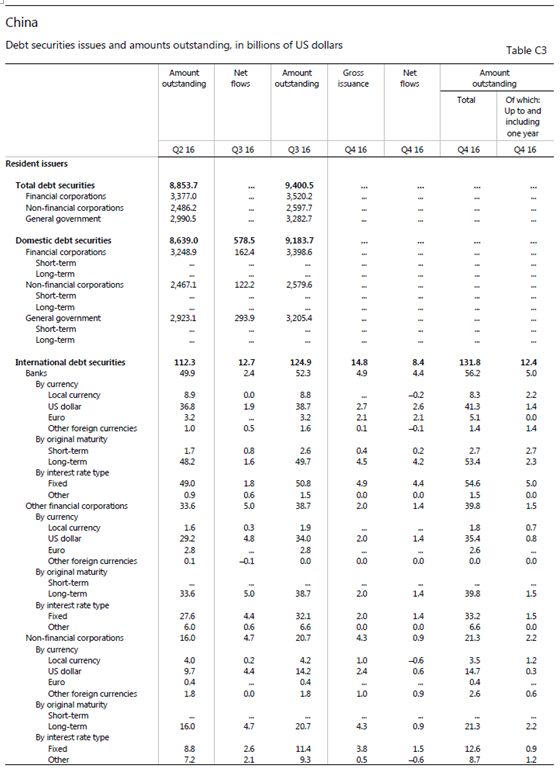 Table 8: Source: BIS Securities Statistics https://www.bis.org/statistics/secstats.htm?m=6%7C33%7C615
The above table 8 shows that outstanding international RMB issues (in CNH) by Chinese residents amounted to USD 15 bn in 3Q2016 out of a total of outstanding international issues of USD 125 bn (or 12% of the total). What is not shown in the statistics is the issue of RMB denominated securities by non-Chinese entities, such as the British Government[i].
The debt securities statistics are the obvious example where the BIS purpose, ie to show debt securities in local and foreign currencies does not fully meet our requirement of monitoring issues in RMB. Apart from Chinese residents, non-residents such as the British Government and international organisations have issued debt securities in RMB which are not shown explicitly in the statistics.
USE: in order to serve as an international currency, debt instruments denominated in RMB have to be issued. This allows foreign investors to hold RMB assets, thus fulfilling the third function of money, storage of value. Foreign investors with the status of Qualified Foreign Institutional Investor and foreign central banks can invest in domestic RMB securities (CNY). Any foreign investor can invest in international RMB securities (CNH).
Conclusion
The BIS financial statistics have included RMB in their data during the last few years. They cover most of the functions of an international currency. The denomination function is covered by the exchange rate indicators, such as the NEER and the REER. The transaction function is covered by the foreign exchange and derivatives survey, the latest one in 2016. The store of value function is covered by the locational banking statistics, such as cross-border deposits with China banks in RMB. The outstanding amount and net new issuance of RMB denominated securities which are available for investment by foreign entities in both, in CNY for domestic securities as well as CNH in international securities are shown in the BIS securities statistics.
Other significant RMB business is conducted by Chinese banks in Hong Kong, London and other locations. Their business would be included in the statistics of these reporting countries and regions. However, there is no break down into RMB, as only USD and EUR are explicitly reported in addition to their respective local currencies, such as HKD, GBP.
[i]British government securities in RMB are included in other currencies.
[i]According to BOP capital outflows are net increases in assets (triggered by residents)and capital inflows are net increases in liabilities (triggered by non-residents).
[ii]The term China banks is used here for all banks resident in China, these are Chinese owned banks as well as affiliates of foreign banks resident in China.
[iii]Poenisch Herbert (2016): Contribution by Chinese banks to RMB Internationalisation. In: IMI International Review, Vol 3, No 3&4, October www.imi.ruc.edu.cn
[i]Poenisch Herbert (2017): RMB-a maturing currency. In: International Monetary Review, January Vol 4, no1 www.imi.ruc.edu.cn
[i]Bank for International Settlements-BIS (2015): Introduction to BIS Statistics. In: BIS Quarterly Review, September, p 35www.bis.org/publications
[ii]Ibid, p 35.
[iii]Wooldridge, Philip D (2002): Uses of BIS Statistics: An introduction. In: BIS Quarterly Review, March www.bis.org/publications
[iv]International Monetary Institute-IMI (2016): Report on the Internationalisation of the RMB. www.imi.ruc.edu.cn
[v]Regular updates are published in the BIS Quarterly Review, which is published at the beginning of March, June, September and December of every year.
[vi]BIS, ibid, p 48
[vii]BIS, ibid, p 48
Table 8: Source: BIS Securities Statistics https://www.bis.org/statistics/secstats.htm?m=6%7C33%7C615
The above table 8 shows that outstanding international RMB issues (in CNH) by Chinese residents amounted to USD 15 bn in 3Q2016 out of a total of outstanding international issues of USD 125 bn (or 12% of the total). What is not shown in the statistics is the issue of RMB denominated securities by non-Chinese entities, such as the British Government[i].
The debt securities statistics are the obvious example where the BIS purpose, ie to show debt securities in local and foreign currencies does not fully meet our requirement of monitoring issues in RMB. Apart from Chinese residents, non-residents such as the British Government and international organisations have issued debt securities in RMB which are not shown explicitly in the statistics.
USE: in order to serve as an international currency, debt instruments denominated in RMB have to be issued. This allows foreign investors to hold RMB assets, thus fulfilling the third function of money, storage of value. Foreign investors with the status of Qualified Foreign Institutional Investor and foreign central banks can invest in domestic RMB securities (CNY). Any foreign investor can invest in international RMB securities (CNH).
Conclusion
The BIS financial statistics have included RMB in their data during the last few years. They cover most of the functions of an international currency. The denomination function is covered by the exchange rate indicators, such as the NEER and the REER. The transaction function is covered by the foreign exchange and derivatives survey, the latest one in 2016. The store of value function is covered by the locational banking statistics, such as cross-border deposits with China banks in RMB. The outstanding amount and net new issuance of RMB denominated securities which are available for investment by foreign entities in both, in CNY for domestic securities as well as CNH in international securities are shown in the BIS securities statistics.
Other significant RMB business is conducted by Chinese banks in Hong Kong, London and other locations. Their business would be included in the statistics of these reporting countries and regions. However, there is no break down into RMB, as only USD and EUR are explicitly reported in addition to their respective local currencies, such as HKD, GBP.
[i]British government securities in RMB are included in other currencies.
[i]According to BOP capital outflows are net increases in assets (triggered by residents)and capital inflows are net increases in liabilities (triggered by non-residents).
[ii]The term China banks is used here for all banks resident in China, these are Chinese owned banks as well as affiliates of foreign banks resident in China.
[iii]Poenisch Herbert (2016): Contribution by Chinese banks to RMB Internationalisation. In: IMI International Review, Vol 3, No 3&4, October www.imi.ruc.edu.cn
[i]Poenisch Herbert (2017): RMB-a maturing currency. In: International Monetary Review, January Vol 4, no1 www.imi.ruc.edu.cn
[i]Bank for International Settlements-BIS (2015): Introduction to BIS Statistics. In: BIS Quarterly Review, September, p 35www.bis.org/publications
[ii]Ibid, p 35.
[iii]Wooldridge, Philip D (2002): Uses of BIS Statistics: An introduction. In: BIS Quarterly Review, March www.bis.org/publications
[iv]International Monetary Institute-IMI (2016): Report on the Internationalisation of the RMB. www.imi.ruc.edu.cn
[v]Regular updates are published in the BIS Quarterly Review, which is published at the beginning of March, June, September and December of every year.
[vi]BIS, ibid, p 48
[vii]BIS, ibid, p 48
