Herbert Poenisch:人民币:日趋成熟的货币 ——基于BIS 2016年外汇调查
国际清算银行(BIS)每三年便会对外汇市场和场外衍生品市场活动进行调查。2016年4月的某个交易日,52个国家和地区的1200多家主要金融机构提交了市场活动报告。
一、综述
如图1所示,2016年的每日市场活动总额从2013年的5.4万亿美元下降至5.1万亿美元,主要是由于现货交易量的下降。自2007年以来,金融账户流动比资本账户和经常账户流动增速更快。如下所示,人民币在金融交易中的使用已经超过了在经常账户交易中的使用。 使用一种货币进行金融交易是该货币成熟的特征,意味着该货币可以长期作为国际货币。
许多因素解释了这种下降。BIS提到了美联储(FED)有意开始缩减其资产收购,减轻2015年初瑞士法郎震荡产生的影响,和缓解遏制高频交易(HFT)的措施。所有这些进展不同程度地影响着现货交易,这是因为市场参与者通过开放式货币头寸寻求收益,在高频交易的情况下,关注最具流动性的金融工具。
相比之下,外汇互换交易增加,这是由于长期机构投资者在中央银行量化宽松计划的支持下,重新平衡了他们的国际投资组合,从而增加了货币对冲活动。由于货币市场利率和主要货币的贷款存有差异,外汇互换交易额上升。金融工具方面,外汇互换超过现货交易和其他衍生工具,如远期和期权(见附件1)。近期调查显示,外汇互换参与者的分类细目尚未改变。经销商和金融机构以相同的份额主导着贸易,非金融份额下降到10%以下(见附件1),反映出对外贸易对外汇需求和汇率决定的影响并不大。
关于外汇交易中心,交易已明显从英国和欧洲的中心转移到亚洲的中心,特别是中国、日本、香港和新加坡。虽然以前的调查中,外汇市场41%的贸易在英国进行,但现在其份额下降到37%。美国的份额保持稳定,为19%。四个主要亚洲中心的份额从16%增加到22%,反映了经济重心向亚洲转移。中国的份额虽然之前较低,但是现在翻了一番(见附件二)。
最后,关于货币,美元仍然占主导地位,出现在88%的货币对中。欧元从2010年的峰值39%显著下降至2016年的31%。其他主要货币(日元、英镑、瑞士法郎、澳元和加元)份额持平,亚洲货币在新兴市场经济体货币中的份额上升至4%,港元、新加坡元及韩元上升至2%(见附件三)。
二、人民币表现
以人民币进行的外汇交易的份额每三年翻一番。每日总营业额已超过2020亿美元,占全球外汇交易额的4%……随着人民币整体交易的上升,其作为金融工具,以及支持金融交易,而非贸易交易也同时有所增长。 过去,大部分的有限成交都存在于现货交易中。
跨境人民币需求通过多个渠道增加。 首先,从2009年7月开始,中国允许使用人民币在跨境贸易中结算。第二,外部和内部直接投资增长迅速,人民币在外部投资占很大比重。 第三,通过发行点心债以及人民币合格境外机构投资者(RQFII)等渠道,离岸人民币也可以作为一种投资组合工具。显著特征如下图A1 所示。

人民币离岸交易集中在四个中心:香港,新加坡,伦敦和美国(左图)。顺应全球趋势,人民币互换已成为在岸和离岸人民币市场的主要工具。这凸显了人民币业务在金融交易中正变得越来越重要。
三、人民币金融化
在居民不参与的情况下,使用任意货币进行金融交易,这是国际储备货币的必要条件。英镑和美元都在鼎盛时期作为世界储备货币实现了这一功能。这是为了防止美元金融工程不断推进,金融交易会让贸易交易变得无足轻重(见上文)。
2016年外汇调查显示,人民币刚刚开始走上金融化道路。从附录1可以看出,衍生品交易首次超过了日均680亿美元的现货交易。现货交易与贸易和对外直接投资等实际交易密切相关。衍生品交易中最重要的是掉期交易,总额860亿美元,其次是总额280亿的远期直接汇率交易和180亿的外汇期权交易。它们记录了人民币在金融方面的应用。人民币的金融化趋势不仅出现在人民币离岸市场,也出现在人民币在岸市场(见图三),但是两者还是分隔开来的。因为总体上来看,中国居民无法进入人民币离岸市场,而非居民也无法进入人民币在岸市场。
人民币和其他新兴市场货币之间的主要差别在于无本金交割远期交易(NDF)。其它新兴市场货币(巴西里尔,印度卢比,韩元和台币)的NDF相当活跃,而人民币和卢布已经实现了远期交割(DF),尤其是在针对中国居民的人民币在岸市场上。鉴于大部分人民币债券由国内投资者持有,BIS提及,在岸人民币对冲需求将会增长。
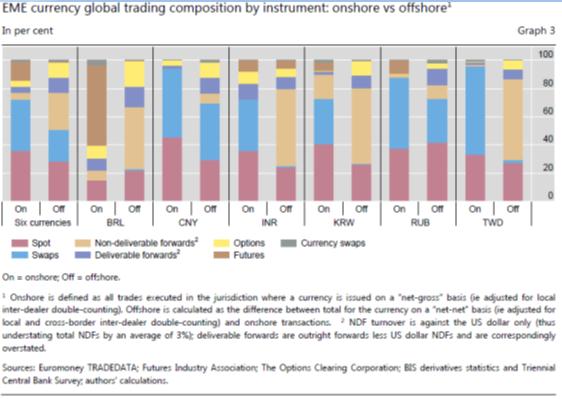
离岸人民币远期交割是可能的,因为中国政府允许有效资本管制,即一个可以自由交易的离岸人民币池。 人民币远期市场因此一分为三(i)离岸NDF市场(从20世纪90年代开始),(ii)在岸DF市场(自2007年)和(iii)离岸DF市场,称为CNH市场 (自2010年代中期)。 这个框架在2016年1月受到严重的压力,人民币离岸市场流动性被消耗,导致人民币在岸和离岸利率和汇率之间的巨大差距。
DF对NDF的取代在规模最大的人民币离岸中心发展最快,如香港、新加坡和伦敦。 NDF在其它欧洲离岸中心和美国仍占有相当大的份额。
四、结论
人民币国际化的积极政策推动了人民币金融化,这正是一个成熟货币的关键特征。人民币在岸以及离岸市场的外汇掉期、远期和期权交易使得市场能够对冲人民币利率和汇率风险。这与2015年8月推出的市场化汇率政策一起,极大地推动了人民币国际化。
风险仍然存在,离岸人民币走弱就是其中之一。通过更加实际的汇率政策并利用更多套期保值工具,居民和非居民都能使用人民币并将人民币作为避险货币。同时,从总体上看,虽然通过资本管制区分居民和非居民仍将持续有效,但在岸和离岸市场的趋同将成为未来趋势。
原文如下:
RMB: a maturing currency,Based on the BIS 2016 Forex survey
The Bank for International Settlements conducts a survey of foreign exchange and over the counter derivatives market activity every 3 years, the so called triennial forex survey. More than 1200 major financial institutions in 52 countries[2] and jurisdictions reported their market activities on a certain trading day in April 2016.
- Overall result
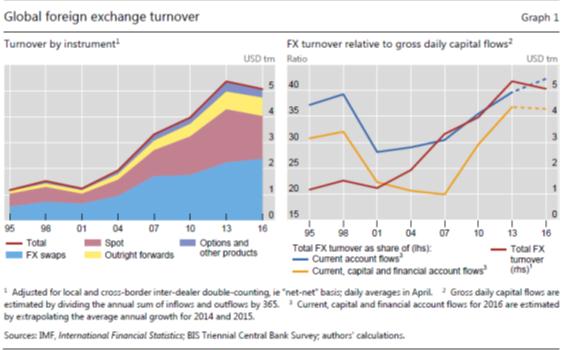
As graph 1 shows total daily market activity declined from USD5.4tr in 2013 to USD5.1tr in 2016 mainly due to the decline in spot transactions[3]. Comparing with capital flows, financial account flows increased more rapidly since 2007 compared with current account flows. As will be seen below, the use of RMB for financial transactions has overtaken the use for current account transactions. Using a currency for financial transactions is a characteristic of a mature currency which can serve as global currency before long.
A number of factors explains this decline. The BIS mentions the expectations that the FED would begin tapering its asset purchases, the wake of the Swiss Franc shock at the beginning of 2015 and measures to curb high frequency trading (HFT). All these developments had a disproportionate impact on spot trading, because market participants seek returns by taking open currency positions or, in the case of HFT, focus on the most liquid instruments[4].
By contrast, trading in forex swaps rose because of the increase in currency hedging activity by long term institutional investors, as they rebalanced their international portfolios on the back of central bank quantitative easing programmes. As money market rates and lending spreads in major currencies diverged, this also contributed to the rise in forex swap turnover[5].Looking at instruments, the forex swaps exceed the spot transactions and other derivatives such as the forwards and options (see annex 1). The breakdown of participants in forex trade has not changed in the recent survey. Trade is still dominated in equal shares by dealers and financial institutions with the share of non-financials falling to below 10% (see annex 1), reflecting the low importance of foreign trade as determinant of forex demand and exchange rate determination.
Regarding centres of foreign exchange trade there has been a marked shift from the UK and Europe to Asian centres, notably China, Japan, Hong Kong and Singapore. Whereas the UK dominated the forex market in previous surveys with 41% of trade, its share declined to 37%. The US share remained stable at 19%. The four major Asian centres increased their share from 16% to 22%, reflecting the shift of economic gravity to Asia. China’s share doubled albeit from a low basis (see annex 2).
Finally, regarding currencies, the USD remains the dominant one, present in 88% of all currency pairs[6]. The EUR declined markedly from its peak in 2010 of 39% to 31% in 2016. The other major currencies (JPY, GBP, CHF, AUD, CAD) maintained their shares, and Asian currencies among EME currencies increased their share, notably the RMB to 4%, the HKD and SGD and KRW to 2% (see annex 3).
2 Performance of RMB
The share of forex trade conducted in RMB has doubled every three years. Total daily turnover has reached over USD202 billion or 4% of global forex turnover…Along with the rise in the overall trading of RMB, its use as a financial instrument and to back financial rather than trade transactions has also increased. In the past, most of the limited turnover was in spot transactions[7].
Cross-border RMB demand has increased through a number of channels. First, starting in July 2009, China allowed the use of RMB in the settlement of cross-border trade. Second, both outward and inward direct investment have grown rapidly, with a big share of RMB in the outward direction. Third, offshore RMB can also serve as a vehicle for portfolio investment in China through channels such as dim sum bond issuance (offshore RMB-denominated bond issuance) and the RMB Qualified Foreign Institutional Investor scheme (RQFII)[8]. The salient features are shown in Graph A1=2 below.

RMB offshore trading is concentrated in four centres, Hong Kong, Singapore, London and US (left hand diagramme). In line with global trends, RMB swaps have become the dominant instrument, in the onshore as well as in the offshore RMB markets. This underlines the growing importance of financial transactions in the RMB segment.
- Financialisation of RMB
Using any currency for financial transactions without involvement of residents is a necessary condition for a global reserve currency. Both, the GBP and the USD have fulfilled this function during their heydays as world reserve currencies. In case of the USD financial engineering advanced to such a degree that use for trade transactions was dwarfed by use for financial transactions (see above).
RMB has only just started on this path of financialisation as evidenced by the 2016 forex survey. As annex 1 shows, for the first time daily RMB spot transactions of USD68 billion, which are closely linked with real transactions such as trade and FDI have been overtaken by derivatives transactions. First and foremost swap transactions of USD86bn, then outright forwards of USD28 bn and forex options of USD 18bn have documented the financial use of RMB. The financialisation has taken place not only on the offshore RMB market but also on the onshore RMB market (see graph 3 below). However, the two are still separated as residents by and large do not have access to the offshore RMB markets and non-residents do not have access to the onshore RMB market.
The main difference between RMB and other emerging market currencies are the Non-deliverable forwards (NDF). Whereas other EME currencies still have a large NDF market (notably BRL, INR, KRW, TWD), RMB and RUB have moved into the deliverable forwards (DF), particularly in the onshore segment for Chinese residents. The BIS cites the growing need for onshore hedging due to the fact most RMB bonds are held by domestic investors.

The DF for offshore RMB is possible, because ‘Chinese authorities permitted within still effective (but leaky) capital controls, a pool of offshore RMB which can be freely traded and delivered. The RMB forward market is thus split into three (i) an offshore NDF market (started in the 1990s), (ii) an onshore DF market (since 2007) and (iii) an offshore DF market, known as CNH market (since mid-2010)[9]. This framework came under severe strain in January 2016 when the CNH market liquidity was drained causing a sizable gap between RMB onshore and offshore interest rates and exchange rates[10].
The displacement of NDF by DF has progressed most in offshore centres which have traded RMB the longest, such as Hong Kong, Singapore and London. NDFs have still a high share in other European centres and the US.
- Conclusion
The active policy of internationalization of RMB has driven the financialisation of RMB, a key characteristics of a mature currency. Forexswaps, outright forwards and forex options in RMB onshore as well as offshore markets have allowed markets to hedge their interest rate and exchange rate exposures in RMB. These together with a market oriented exchange rate policy introduced in August 2015, have given the RMB internationalization a major push.
Risks still remain, such as shortening of offshore RMB, but a more realistic exchange rate policy which is the hallmark of an international reserve currency together with wide availability of hedging instruments has allowed residents as well as non-residents to use and hedge RMB. At the same time, the separation of residents and non-residents through capital controls continues to function by and large, but a convergence between onshore and offshore trading patterns is a clear trend[11].
[1] Herbert Poenisch ,Member of IMI Academic Committee
[2] The following jurisdictions contributed to the 2016 survey: Argentina, Australia, Austria, Bahrain, Belgium, Brazil, Bulgaria, Canada, Chile, China, Chinese Taipei, Colombia, the Czech Republic, Denmark, Finland, France, Germany, Greece, Hong Kong SAR, Hungary, India, Indonesia, Ireland, Israel, Italy, Japan, Korea, Latvia, Lithuania, Luxemburg, Malaysia, Mexico, the Netherlands, New Zealand, Norway, Peru, the Philippines, Poland, Portugal, Romania, Russia, Saudi Arabia, Singapore, Slovakia, South Africa, Spain, Sweden, Switzerland, Thailand, Turkey, the United Kingdom and the Unites States.
[3] Although forex activity is declining it is still huge, 20 times the nominal world GDP or 50 times the world trade in goods and services.
[4] Moore, Michael, Schrimpf Andreas, Sushko, Vladyslav (2016): Downsized FX markets: causes and implications. In: BIS Review, December p 38 www.bis.org/publications
[5] Moore, Michael, Schrimpf, Andreas, Sushko, Vladyslav (2016): ibid p.38
[6] The percentage given is out of a total of 200% as each currency pair has 2 currencies.
[7] Moore, Michael, Schrimpf, Andreas, Sushko, Vladyslav (2016): ibid, box on p 43.
[8] Ehlers, Torsten, Packer, Frank and Zhu, Feng (2016): The changing landscape of RMB offshore and onshore markets. In: BIS Quarterly, December p 72 www.bis.org/publications
[9] McCauley, Robert and Shu, Chang (2016): Non-deliverable forwards: impact of currency internationalization and derivatives reform. In: BIS Quaterly Review, December www.bis.org/publications
[10] China reacted quickly as this would have resulted in parallel currencies of CNY and CNH if this gap prevailed.
[11] Ehlers, Torsten, Pecker, Frank and Zhu, Feng (2016): ibid, p 72

ANNEX1

ANNEX 2

ANNEX 3