AAAT
洪灝:价格的革命——对全球资产配置的思考
时间:2016年11月15日 作者:Hong Hao
导读:
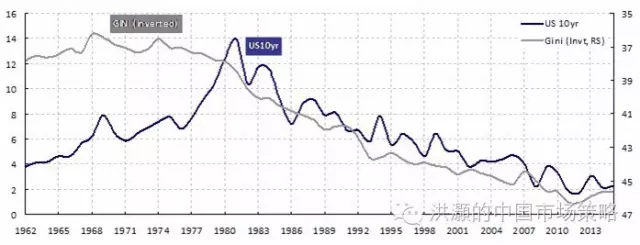
 The 10-year is also a history of surplus value exploitation: In the eye of a macroeconomist’s, however, the 10-year tells a different story, after another curve is overlaid. In Focus Chart 2, When comparing the difference between the growth in labor earnings and productivity gain, we observe that: 1) the gap between labor wages and productivity gain (the gap here after), and the 10-year are highly correlated; and 2) the gap has also been in a secular decline, concurrent with the 10-year.
This gap is a cap on inflationary pressure. As it shows output rising faster than input, the gap is also a proxy of labor’s surplus value. A narrowing gap suggests that labor, or the proletariats, is not adequately compensated for its productivity gain (Focus Chart 2). Or simply, the shrinking gap records the exploitation of the proletariats’ surplus value for more than three decades. By underpaying labor, the “capitalist” reaps more benefits from the productivity gain that propels growth.
Focus Chart 2: The 10-year is also a history of surplus value exploitation; productivity gain in adequately compensated
The 10-year is also a history of surplus value exploitation: In the eye of a macroeconomist’s, however, the 10-year tells a different story, after another curve is overlaid. In Focus Chart 2, When comparing the difference between the growth in labor earnings and productivity gain, we observe that: 1) the gap between labor wages and productivity gain (the gap here after), and the 10-year are highly correlated; and 2) the gap has also been in a secular decline, concurrent with the 10-year.
This gap is a cap on inflationary pressure. As it shows output rising faster than input, the gap is also a proxy of labor’s surplus value. A narrowing gap suggests that labor, or the proletariats, is not adequately compensated for its productivity gain (Focus Chart 2). Or simply, the shrinking gap records the exploitation of the proletariats’ surplus value for more than three decades. By underpaying labor, the “capitalist” reaps more benefits from the productivity gain that propels growth.
Focus Chart 2: The 10-year is also a history of surplus value exploitation; productivity gain in adequately compensated
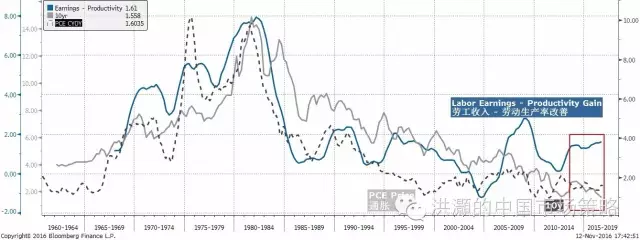 As such, the decline in 10-year is also a history of mismatch between productivity and productive relationship. It is such an inadequate division of economic gain between the capitalist and the proletariat that has been keeping inflation in check. Paul Volker’s monetary policy may have tamed the inflation, but Thatcher’s crushing the union, too. But now the disparity has gone too far for too long, and must revert. Already, we observe a rising gap between labor wages and productivity gain starting from a few year ago, as well as an unprecedented divergence between the gap and the direction of 10-year (Focus Chart 2).
From this perspective, the rise in vox populi is no longer surprising. Populism, as Fareed Zakaria defined, means “different things to different groups, but all visions share a suspicion of and hostility toward elites, mainstream politics and established institutions”. Populism sees itself as “speaking for the forgotten ‘ordinary’ person and often imagines itself as the voice of genuine patriotism”, Zakaria continued to ponder. After long being inadequately compensated, labor will start to demand its fair share of economic growth. The movement of “Occupy Wall Street”, the Chinese policy’s renewed emphasis on “promoting social welfare for the mass”, and the unsympathetic sentiment against Angela Merkel’s immigration policy, suddenly all have an elucidating context.
The 10-year and Global Imbalance, Income Disparity and Bonds’ (soon-to-pass) Triumph
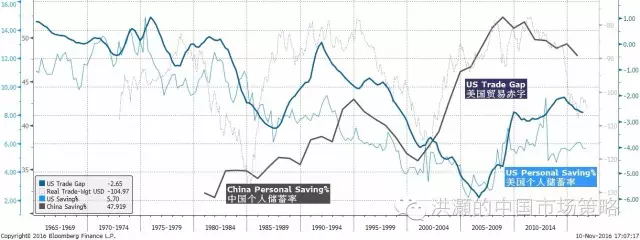
Productivity gain not adequately compensated is a cause of global imbalance: Concurrent with the secular decline in the 10-year yield is the US savings rate. Underpaid labor means that the proletariats simply have not made enough to save. Global trade also means that the US has been able to attract inflows from foreign savings, most notably from China.
Consequently, the ballooning US trade deficit is a mirror image of falling US savings rate, parallel to a surge in Chinese savings rate. These Chinese savings from trade with the US are then recycled to buy US treasuries, suppressing the 10-year yield. But now the Chinese savings rate has begun to fall, in the wake of Chinese consumerism and an aging population. Meanwhile the US savings rate has risen, as the US labor starts to demand a fairer share for their contribution (Focus Chart 3).
Focus Chart 3: Productivity gain not adequately compensated is a cause of global imbalances.
As such, the decline in 10-year is also a history of mismatch between productivity and productive relationship. It is such an inadequate division of economic gain between the capitalist and the proletariat that has been keeping inflation in check. Paul Volker’s monetary policy may have tamed the inflation, but Thatcher’s crushing the union, too. But now the disparity has gone too far for too long, and must revert. Already, we observe a rising gap between labor wages and productivity gain starting from a few year ago, as well as an unprecedented divergence between the gap and the direction of 10-year (Focus Chart 2).
From this perspective, the rise in vox populi is no longer surprising. Populism, as Fareed Zakaria defined, means “different things to different groups, but all visions share a suspicion of and hostility toward elites, mainstream politics and established institutions”. Populism sees itself as “speaking for the forgotten ‘ordinary’ person and often imagines itself as the voice of genuine patriotism”, Zakaria continued to ponder. After long being inadequately compensated, labor will start to demand its fair share of economic growth. The movement of “Occupy Wall Street”, the Chinese policy’s renewed emphasis on “promoting social welfare for the mass”, and the unsympathetic sentiment against Angela Merkel’s immigration policy, suddenly all have an elucidating context.
The 10-year and Global Imbalance, Income Disparity and Bonds’ (soon-to-pass) Triumph
Productivity gain not adequately compensated is a cause of global imbalance: Concurrent with the secular decline in the 10-year yield is the US savings rate. Underpaid labor means that the proletariats simply have not made enough to save. Global trade also means that the US has been able to attract inflows from foreign savings, most notably from China.
Consequently, the ballooning US trade deficit is a mirror image of falling US savings rate, parallel to a surge in Chinese savings rate. These Chinese savings from trade with the US are then recycled to buy US treasuries, suppressing the 10-year yield. But now the Chinese savings rate has begun to fall, in the wake of Chinese consumerism and an aging population. Meanwhile the US savings rate has risen, as the US labor starts to demand a fairer share for their contribution (Focus Chart 3).
Focus Chart 3: Productivity gain not adequately compensated is a cause of global imbalances.
 Saving is a quintessential form of speculation. Just like the consumer postulated in Franco Modigliani and Milton Friedman’s intertemporal model, the Chinese have been saving hard, forgoing consumption today and hoping for bigger and better consumption in the future. Thus, demand for goods today, and consequently the present price of goods, must have been artificially depressed. Intuitively, inflation, or the price of goods in the future, must rise structurally when Chinese finally decide to convert its colossal savings into consumption.
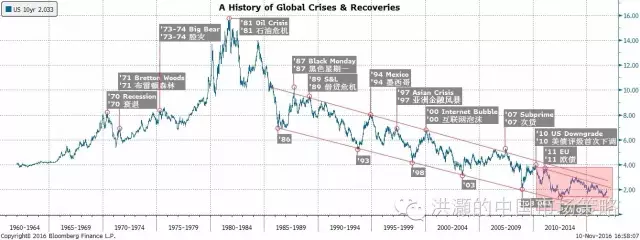
Discussions of price revolution today generally refer to the great wave of inflation between the 15th and 17th century, a period when price levels across Western Europe rose six-fold in 150 years. However, since the medieval age, there have actually been four price revolutions in the 13th, 16th, 18th and early 20th centuries. These price revolutions have all stemmed from excess aggregate demand induced by acceleration of population growth, or by rising living standards, or both, and at times compounded by surges in money supply. Each of these episodes saw financial gains ascribed to those with power and capital, with escalating income disparity, mounting government deficit and volatility in financial markets. Today, there is a sense of déjà vu in these historical observations.
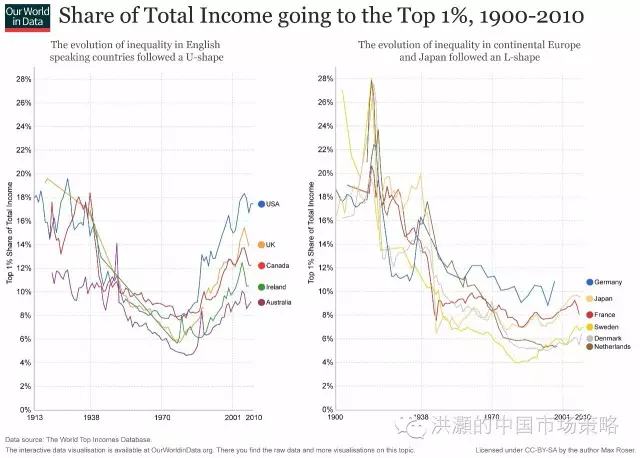
Productivity gain not adequately compensated is also a cause of income disparity: As the proletariats were exploited, the rich grows richer, and income disparity rises. With more than a hundred years of data, we observe that the trend of income disparity growing since the 1980’s, concurrent with a narrowing gap between labor wage growth and productivity gain.
Such dramatic disparity has occurred before, in 16th century Spain, 17th century Holland, the Gilded Age and the Roaring 20’s in the U.S. These eras are all weaved with disruptive productivity gains from technology breakthrough, creative financial innovation, cooperative governments, and an influx of immigrants and conquests of rich lands overseas. The trend was best exploited by the rich and educated of the time (Focus Chart 4).
That said, the different experience between the Anglo-Saxon countries, represented best by the US and UK on the left-hand side of Focus Chart 4, and the continental European countries and Japan on the right-hand side, suggests that the income disparity is partly institutional. That is, different social redistribution systems can alleviate or aggravate income disparity. There is a choice, and the proletariats are now demanding it.
Focus Chart 4: Productivity gain in adequately compensated is a cause of income disparity.
Saving is a quintessential form of speculation. Just like the consumer postulated in Franco Modigliani and Milton Friedman’s intertemporal model, the Chinese have been saving hard, forgoing consumption today and hoping for bigger and better consumption in the future. Thus, demand for goods today, and consequently the present price of goods, must have been artificially depressed. Intuitively, inflation, or the price of goods in the future, must rise structurally when Chinese finally decide to convert its colossal savings into consumption.
Discussions of price revolution today generally refer to the great wave of inflation between the 15th and 17th century, a period when price levels across Western Europe rose six-fold in 150 years. However, since the medieval age, there have actually been four price revolutions in the 13th, 16th, 18th and early 20th centuries. These price revolutions have all stemmed from excess aggregate demand induced by acceleration of population growth, or by rising living standards, or both, and at times compounded by surges in money supply. Each of these episodes saw financial gains ascribed to those with power and capital, with escalating income disparity, mounting government deficit and volatility in financial markets. Today, there is a sense of déjà vu in these historical observations.
Productivity gain not adequately compensated is also a cause of income disparity: As the proletariats were exploited, the rich grows richer, and income disparity rises. With more than a hundred years of data, we observe that the trend of income disparity growing since the 1980’s, concurrent with a narrowing gap between labor wage growth and productivity gain.
Such dramatic disparity has occurred before, in 16th century Spain, 17th century Holland, the Gilded Age and the Roaring 20’s in the U.S. These eras are all weaved with disruptive productivity gains from technology breakthrough, creative financial innovation, cooperative governments, and an influx of immigrants and conquests of rich lands overseas. The trend was best exploited by the rich and educated of the time (Focus Chart 4).
That said, the different experience between the Anglo-Saxon countries, represented best by the US and UK on the left-hand side of Focus Chart 4, and the continental European countries and Japan on the right-hand side, suggests that the income disparity is partly institutional. That is, different social redistribution systems can alleviate or aggravate income disparity. There is a choice, and the proletariats are now demanding it.
Focus Chart 4: Productivity gain in adequately compensated is a cause of income disparity.
 Underpaid labor relative to productivity gain suppresses inflation; it is why bonds have outperformed equities: One of the most confounding questions over the past three decades is the significant outperformance of bonds versus equities, and when such secular trend will revert. The division of the reward from productivity gains between the owner and proletariats has been uneven. Yet on top of this productivity relationship sits the capitalist (the creditor, or the bond owner) who is willing to lend to the owner (the debtor, or the equity owner of the business). The owner in turn reaps benefits from productivity gains by underpaying labor. Intuitively, in this relationship, the creditor must have gained more than the debtor. Otherwise, the creditor himself would be setting up his own shops. In short, bonds owned by the creditor outperform equities owned by the debtor.
Focus Chart 5: Productivity gain not adequately compensated is why bonds have outperformed equities.
Underpaid labor relative to productivity gain suppresses inflation; it is why bonds have outperformed equities: One of the most confounding questions over the past three decades is the significant outperformance of bonds versus equities, and when such secular trend will revert. The division of the reward from productivity gains between the owner and proletariats has been uneven. Yet on top of this productivity relationship sits the capitalist (the creditor, or the bond owner) who is willing to lend to the owner (the debtor, or the equity owner of the business). The owner in turn reaps benefits from productivity gains by underpaying labor. Intuitively, in this relationship, the creditor must have gained more than the debtor. Otherwise, the creditor himself would be setting up his own shops. In short, bonds owned by the creditor outperform equities owned by the debtor.
Focus Chart 5: Productivity gain not adequately compensated is why bonds have outperformed equities.
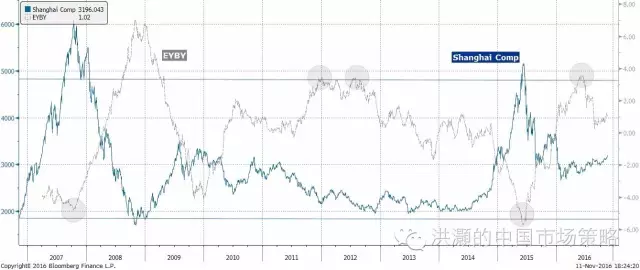
 But as proletariats are roused, this relationship is about to invert (Focus Chart 5), and bonds should start to underperform bonds. And the secular trend may have already begun. In China, our bond yield vs. earnings yield model (EYBY model hereafter), which has helped us pinpoint the peak of China’s stock market bubble in June 2015 and negotiate the rough waters after the bubble burst, is showing relative value of equities relative to bonds, too (Focus Chart 6).
That said, EYBY’s relative value saw a significantly higher peak in 2008 that eventually corresponded to the market bottom. The local peaks in 2012 did not correspond to the eventual lows of the market. As equities relative value improved, the rotation should slowly progress, in tandem with surging market volatility, and volatility spill across asset classes.
Focus Chart 6: Chinese equities showing relative value to bonds; rotation will likely begin, with surging volatility.
The Rise of Inflation
But as proletariats are roused, this relationship is about to invert (Focus Chart 5), and bonds should start to underperform bonds. And the secular trend may have already begun. In China, our bond yield vs. earnings yield model (EYBY model hereafter), which has helped us pinpoint the peak of China’s stock market bubble in June 2015 and negotiate the rough waters after the bubble burst, is showing relative value of equities relative to bonds, too (Focus Chart 6).
That said, EYBY’s relative value saw a significantly higher peak in 2008 that eventually corresponded to the market bottom. The local peaks in 2012 did not correspond to the eventual lows of the market. As equities relative value improved, the rotation should slowly progress, in tandem with surging market volatility, and volatility spill across asset classes.
Focus Chart 6: Chinese equities showing relative value to bonds; rotation will likely begin, with surging volatility.
The Rise of Inflation
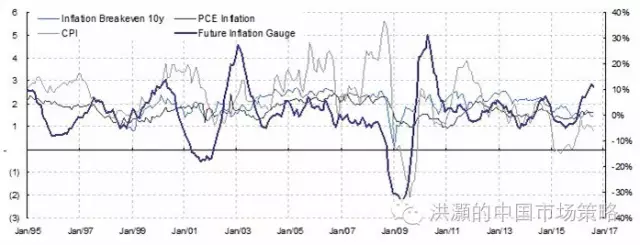
 Inflation is rising and understated: As wage growth accelerates, and starts to outpace productivity gains, inflation pressure should rise. Conventional inflation measures, such as US core CPI and the PCE price index are showing a tepid inflation picture. But ECRI’s Future Inflation Gauge (FIG), is already showing surging inflation pressure to a level not seen since the 2009 recovery (Focus Chart 7). Meanwhile, even though the traditional measures are still low, they have all risen substantially from their lows, especially Core CPI. And Chinese PPI has climbed speedily back to above zero, after staying in the deflationary territory for more than four years.
In the past, in the absence of the gold standard, there is no way to protect savings from confiscation through inflation. Deficit spending, as proposed by Trump, is simply a “scheme for the hidden confiscation of wealth”—in Greenspan’s own words. One of the most effective methods of devaluation in stealth, or the confiscation of private wealth, is through an understatement of inflation. Indeed, governments around the world have been tinkering at their official CPI calculations to weave a false facade of calm inflation.
The Reagan administration, for instance, substituted home purchasing cost with rental cost in the consumption basket in 1982 to produce lower inflation and higher economic growth. Under the Bush Administration, hedonic adjustments were introduced. And early 2011 in China, the NBS reduced the weight of food in the CPI calculation. Coincidentally, food inflation, and pork in particular, has accounted for ~70% of the increase in price in the CPI of June 2011. Without prior adjustments, China’s CPI is likely to come in substantially higher than the 6.4% reported.
Inflation can prick the secular bond bubble: A consistent rise in inflation will mean a regime switch for bond allocation globally. Inflation is likely to be approaching an inflection point in the current cycle, and structural inflation is on the cards for China. The massive savings today in China is in itself an important source of looming secular inflation. That said, all price revolutions in history have also transcended human society, with blissful periods of equilibrium: medieval civilization, the Renaissance, the Enlightenment and the Victorian era. And such asset rotation will usher in epic market volatility as it progresses. The recent surge in VIX is a glimpse of a looming great rotation.
Focus Chart 7: Future Inflation Gauge rising; core CPI understating inflation pressure.
Inflation is rising and understated: As wage growth accelerates, and starts to outpace productivity gains, inflation pressure should rise. Conventional inflation measures, such as US core CPI and the PCE price index are showing a tepid inflation picture. But ECRI’s Future Inflation Gauge (FIG), is already showing surging inflation pressure to a level not seen since the 2009 recovery (Focus Chart 7). Meanwhile, even though the traditional measures are still low, they have all risen substantially from their lows, especially Core CPI. And Chinese PPI has climbed speedily back to above zero, after staying in the deflationary territory for more than four years.
In the past, in the absence of the gold standard, there is no way to protect savings from confiscation through inflation. Deficit spending, as proposed by Trump, is simply a “scheme for the hidden confiscation of wealth”—in Greenspan’s own words. One of the most effective methods of devaluation in stealth, or the confiscation of private wealth, is through an understatement of inflation. Indeed, governments around the world have been tinkering at their official CPI calculations to weave a false facade of calm inflation.
The Reagan administration, for instance, substituted home purchasing cost with rental cost in the consumption basket in 1982 to produce lower inflation and higher economic growth. Under the Bush Administration, hedonic adjustments were introduced. And early 2011 in China, the NBS reduced the weight of food in the CPI calculation. Coincidentally, food inflation, and pork in particular, has accounted for ~70% of the increase in price in the CPI of June 2011. Without prior adjustments, China’s CPI is likely to come in substantially higher than the 6.4% reported.
Inflation can prick the secular bond bubble: A consistent rise in inflation will mean a regime switch for bond allocation globally. Inflation is likely to be approaching an inflection point in the current cycle, and structural inflation is on the cards for China. The massive savings today in China is in itself an important source of looming secular inflation. That said, all price revolutions in history have also transcended human society, with blissful periods of equilibrium: medieval civilization, the Renaissance, the Enlightenment and the Victorian era. And such asset rotation will usher in epic market volatility as it progresses. The recent surge in VIX is a glimpse of a looming great rotation.
Focus Chart 7: Future Inflation Gauge rising; core CPI understating inflation pressure.
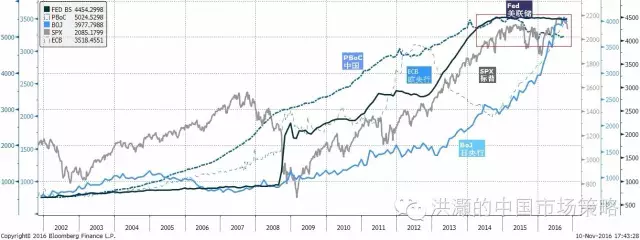
 Central banks’ balance sheets plateau; effectiveness of monetary policy waning: After years of QE, the central bankers now look a little jaded, and their balance sheets have finally stopped expanding. After all, the Fed has entered a rate-hike cycle, after seven years of QE; the ECB’s balance sheet now levels with its peak in 2012 when it first started the covered bond purchase; the BoJ is running out of alphabets to describe what it is doing, with QE in place for well over a decade, QQE for three years and now initiating QQEYCC. At this rate, the BoJ will own 70% of all JGBs in 2018; and the PBoC once has the largest balance sheet of all major central banks, but now starts to shrink (Focus Chart 8). If central banks’ purchase is one of the forces that have suppressed long yields, now it appears to be receding.
Focus Chart 8: Balance sheets of central banks plateau. Effectiveness of monetary policy waning.
Central banks’ balance sheets plateau; effectiveness of monetary policy waning: After years of QE, the central bankers now look a little jaded, and their balance sheets have finally stopped expanding. After all, the Fed has entered a rate-hike cycle, after seven years of QE; the ECB’s balance sheet now levels with its peak in 2012 when it first started the covered bond purchase; the BoJ is running out of alphabets to describe what it is doing, with QE in place for well over a decade, QQE for three years and now initiating QQEYCC. At this rate, the BoJ will own 70% of all JGBs in 2018; and the PBoC once has the largest balance sheet of all major central banks, but now starts to shrink (Focus Chart 8). If central banks’ purchase is one of the forces that have suppressed long yields, now it appears to be receding.
Focus Chart 8: Balance sheets of central banks plateau. Effectiveness of monetary policy waning.
 Global Equities Allocation Outlook
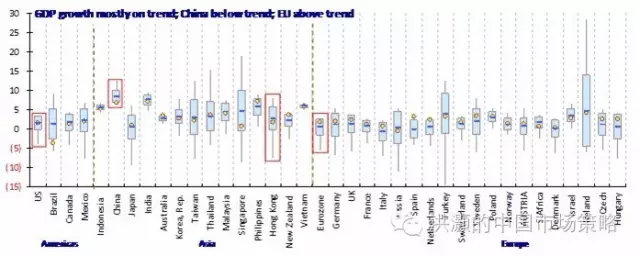
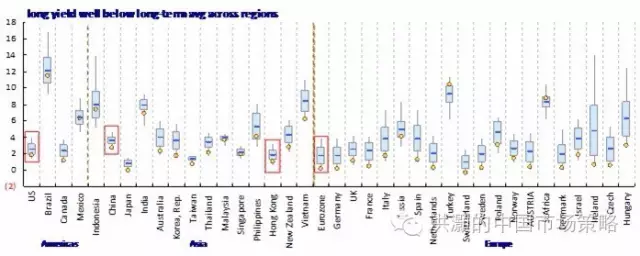
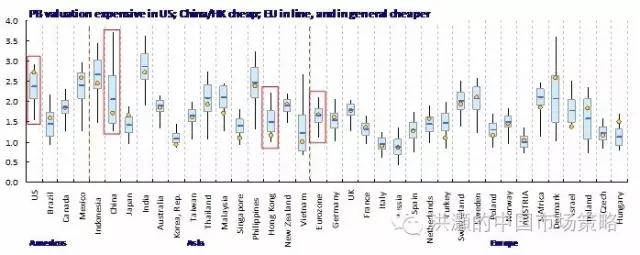
Growth, liquidity, outlook and valuation checks: If equities are set to outperform bonds on a relative basis, we examine across the globe on the metrics of growth, outlook liquidity and valuation to see which regions offer the best prospects for allocation. We can show that growth globally is largely on trend while growth outlook remains stable. Long yields, a measure of liquidity, are very low relative to the long-term trend across countries, and are difficult to fall much lower. The US valuation is expensive, EU is neutral, and China and Hong Kong offer reasonable value (Focus Chart 9 -10).
Focus Chart 9: Growth mostly on trend; long yields around historic lows, room to fall further is limited.
Global Equities Allocation Outlook
Growth, liquidity, outlook and valuation checks: If equities are set to outperform bonds on a relative basis, we examine across the globe on the metrics of growth, outlook liquidity and valuation to see which regions offer the best prospects for allocation. We can show that growth globally is largely on trend while growth outlook remains stable. Long yields, a measure of liquidity, are very low relative to the long-term trend across countries, and are difficult to fall much lower. The US valuation is expensive, EU is neutral, and China and Hong Kong offer reasonable value (Focus Chart 9 -10).
Focus Chart 9: Growth mostly on trend; long yields around historic lows, room to fall further is limited.
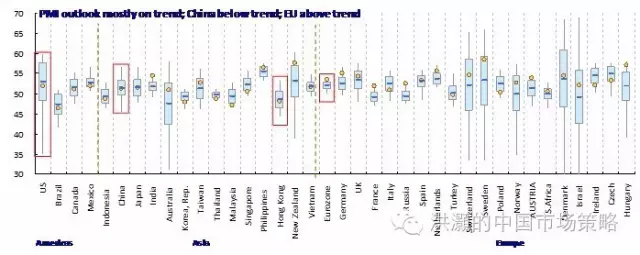
 Focus Chart 10: Growth outlook mostly on trend; China/HK valuation not expensive.
 Hao Hong, CFA
2016-11-13
【原文链接】价格的革命 – 对全球资产配置的思考
Hao Hong, CFA
2016-11-13
【原文链接】价格的革命 – 对全球资产配置的思考
分享到:
扩展阅读

IMI特约研究员,交银国际董事总经理、首席策略分析师
专家工作室EXPERTS
热门视点VIEWS
文章标签TAGS