洪灝:价格的革命——对全球资产配置的思考
摘要:价格是一种记录机制。当民众以交易商品维持生计时,价格衡量商品的成本;对经济学家来说,价格计量货币价值的变化;而价格还告诉了卡尔•马克思关于生产中价值的分配。历史已经囤积了大量的价格数据–汉摩拉比统治时期巴比伦的粘土片,以及法老时期莎草纸的残骸,都有对价格的记载。
在长达三十多年长端收益率下行趋势的背后,是无产阶级剩余价值被剥削的历史:劳动者薪酬的增长远低于劳动生产率提高的速度。简单地说,劳动者的 薪酬太低了。劳动者薪酬的增长相对于劳动生产率增长过缓有助于控制价格水平。这个现象导致了债券跑赢股票,但也致使80年代初以来全球收入分配失衡的现象越来越严重,还引发了全球经济的失衡。
民粹主义的崛起体现着劳动者阶层集体对公平分配经济果实的诉求,川普的历史性胜出尤其突显了这个问题。实际上,劳动者薪酬和劳动生产率之差与长端收益率运行的方向也出现了前所未有的背离。这场游戏总需要一个输家,而长端收益率很可能已经完成了其历史低位的构筑。
随着劳动者薪酬的增长开始持续超越劳动生产率增长,通胀将上升。如是,这个将是刺破长期债券泡沫的诱因,尤其是当货币政策越来越乏力,而央行的资产负债表规模已经顶到了天花板的时候。如果央行一意孤行,继续发钞买债,那么通胀的压力将更大。从债券到股票的资产配置大轮动将伴随着史诗级别的市场波动和溢出,所有的风险资产都将在混乱中挣扎。而最近的市场动荡只是对未来的惊鸿一瞥。随着通胀的回归,收益率曲线将变陡,美元将走强,大宗商品则将在市场的狂欢情绪消退后继续有所表现;随着一场价格革命时限的迫近,在一切尘归尘、土归土之后,债券将逐渐跑输股票。
这篇英文报告《A Price Revolution – on Global Asset Allocation》是对我在11月7日西湖对冲基金峰会发言的总结。 中文翻译版《价格的革命 – 对全球资产配置的思考》会稍后发出。并请同时留意我们将随后微信分享的西湖峰会幻灯片。
------------------------------
Summary: Price is a recording mechanism. It measures the cost of goods as they change hands to sustain living for the hoi polloi, it gauges the change in the value of money for economists, and it told Karl Marx something about the process of production. History has hoarded a large body of price data – we can trace prices all the way back to the reign of Hammurabi from the clay tablets in Babylon, and back to the time of Pharaohs from the remnants of papyri.
Behind the secular decline in long yields is a history of surplus value exploitation of the proletariats: labor wages have risen substantially slower than productivity gain. Or simply, labor is underpaid. Slower labor wage growth versus productivity gain has helped to keep prices in check, led to bond’s outperformance relative to equities, but has also contributed to growing income disparity since the early 1980’s, as well as global imbalances.
The rise of vox populi, accentuated by Trump’s triumph, is proletariats’ chorus for a fair share in economic gain. Indeed, the gap of labor wages versus productivity gain, and the direction of long yield have split unprecedentedly. Something has got to give, and global long yields likely have already found their historical lows.
As labor wage growth starts to outpace productivity gain consistently, inflation will rise. It will eventually prick the secular bond bubble, especially when the effectiveness of monetary policy is increasingly jaded, and central banks’ balance sheet has plateaued. If central banks continue to print money to buy bonds, inflation pressure will be even greater.
The great rotation from bonds to equities will likely be accompanied by epic volatility surge and spill, and risk assets will struggle amid havocs. Recent market upheavals are a glimpse of what is to come. As inflation returns, yield curve should steepen, the Dollar should strengthen, commodities should continue to perform after the euphoric sentiment is resolved; bonds should gradually underperform equities when dusts settle in a looming price revolution.
------------------------------
“Fair is foul and fouls is fair: Hover through the fog and filthy air”. – Macbeth Act I, Shakespeare
On a gloomy Monday, November 7 2016, one day before the historic US election, we were honored to be invited to present at the 2016 West-Lake Summit of Global Alternative Investment Fund hosted by the Hangzhou government and our gracious host, a legendary Chinese hedge fund. By the West Lake where the G20 summit was held, it was the day of “Winter-Begins” in the Chinese “24 Solar Terms”. And temperature plunged precipitously by more than 10 degree Celsius over night. It was unusual, even for a wintry season.
As we were writing, stocks, bonds, commodities and the FX market were all sustaining unprecedented havocs, as the drama of the historic US election unfolded. Our view is still evolving, and may not offer a definitive answer to a situation that is still in flux. For lack of eloquence, we borrow some terms from Karl Marx in our analysis. What follows is a sum up of our presentation at the Westlake Summit on November 7, 2016. We focus our views on what is effective or ineffective, instead of what is right or wrong, good or bad
The 10-year and Surplus Value Exploitation
The 10-year is a history of global crises and recoveries; likely has bottomed: In the past 35 years, the US 10-year treasury yield (abbreviated as 10-year hereafter) has been in a secular decline. The rise in 10-year tends to suggest an environment of tightening macro liquidity, and vice versa (Focus Chart 1). Each surge in the 10-year has been concurrent with market crises somewhere in the world. The “Black Monday” in 1987, the LatAm crisis in early 90’s that some LatAm countries are still trying to recover from, the ’97 Asian Crisis, and Dot-Com bubble and the ’08 Subprime crisis, for instance. Tightening liquidity has usually been the trigger of global market dislocations, and will continue to be. This is the history of the 10-year in a trader’s eyes.
Focus Chart 1: The 10-year is a history of global crisis and recoveries. It has likely found its bottom.
The 10-year is also a history of surplus value exploitation: In the eye of a macroeconomist’s, however, the 10-year tells a different story, after another curve is overlaid. In Focus Chart 2, When comparing the difference between the growth in labor earnings and productivity gain, we observe that: 1) the gap between labor wages and productivity gain (the gap here after), and the 10-year are highly correlated; and 2) the gap has also been in a secular decline, concurrent with the 10-year.
This gap is a cap on inflationary pressure. As it shows output rising faster than input, the gap is also a proxy of labor’s surplus value. A narrowing gap suggests that labor, or the proletariats, is not adequately compensated for its productivity gain (Focus Chart 2). Or simply, the shrinking gap records the exploitation of the proletariats’ surplus value for more than three decades. By underpaying labor, the “capitalist” reaps more benefits from the productivity gain that propels growth.
Focus Chart 2: The 10-year is also a history of surplus value exploitation; productivity gain in adequately compensated
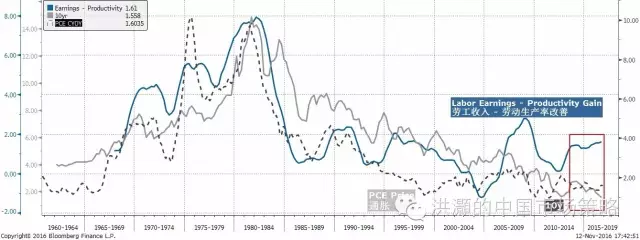
As such, the decline in 10-year is also a history of mismatch between productivity and productive relationship. It is such an inadequate division of economic gain between the capitalist and the proletariat that has been keeping inflation in check. Paul Volker’s monetary policy may have tamed the inflation, but Thatcher’s crushing the union, too. But now the disparity has gone too far for too long, and must revert. Already, we observe a rising gap between labor wages and productivity gain starting from a few year ago, as well as an unprecedented divergence between the gap and the direction of 10-year (Focus Chart 2).
From this perspective, the rise in vox populi is no longer surprising. Populism, as Fareed Zakaria defined, means “different things to different groups, but all visions share a suspicion of and hostility toward elites, mainstream politics and established institutions”. Populism sees itself as “speaking for the forgotten ‘ordinary’ person and often imagines itself as the voice of genuine patriotism”, Zakaria continued to ponder. After long being inadequately compensated, labor will start to demand its fair share of economic growth. The movement of “Occupy Wall Street”, the Chinese policy’s renewed emphasis on “promoting social welfare for the mass”, and the unsympathetic sentiment against Angela Merkel’s immigration policy, suddenly all have an elucidating context.
The 10-year and Global Imbalance, Income Disparity and Bonds’ (soon-to-pass) Triumph
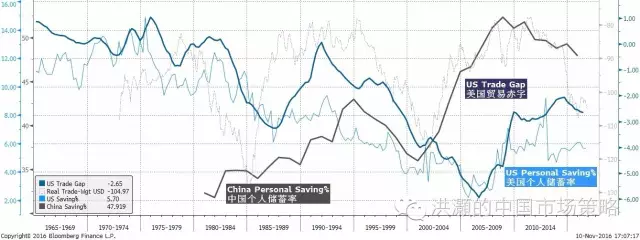
Productivity gain not adequately compensated is a cause of global imbalance: Concurrent with the secular decline in the 10-year yield is the US savings rate. Underpaid labor means that the proletariats simply have not made enough to save. Global trade also means that the US has been able to attract inflows from foreign savings, most notably from China.
Consequently, the ballooning US trade deficit is a mirror image of falling US savings rate, parallel to a surge in Chinese savings rate. These Chinese savings from trade with the US are then recycled to buy US treasuries, suppressing the 10-year yield. But now the Chinese savings rate has begun to fall, in the wake of Chinese consumerism and an aging population. Meanwhile the US savings rate has risen, as the US labor starts to demand a fairer share for their contribution (Focus Chart 3).
Focus Chart 3: Productivity gain not adequately compensated is a cause of global imbalances.
Saving is a quintessential form of speculation. Just like the consumer postulated in Franco Modigliani and Milton Friedman’s intertemporal model, the Chinese have been saving hard, forgoing consumption today and hoping for bigger and better consumption in the future. Thus, demand for goods today, and consequently the present price of goods, must have been artificially depressed. Intuitively, inflation, or the price of goods in the future, must rise structurally when Chinese finally decide to convert its colossal savings into consumption.
Discussions of price revolution today generally refer to the great wave of inflation between the 15th and 17th century, a period when price levels across Western Europe rose six-fold in 150 years. However, since the medieval age, there have actually been four price revolutions in the 13th, 16th, 18th and early 20th centuries. These price revolutions have all stemmed from excess aggregate demand induced by acceleration of population growth, or by rising living standards, or both, and at times compounded by surges in money supply. Each of these episodes saw financial gains ascribed to those with power and capital, with escalating income disparity, mounting government deficit and volatility in financial markets. Today, there is a sense of déjà vu in these historical observations.
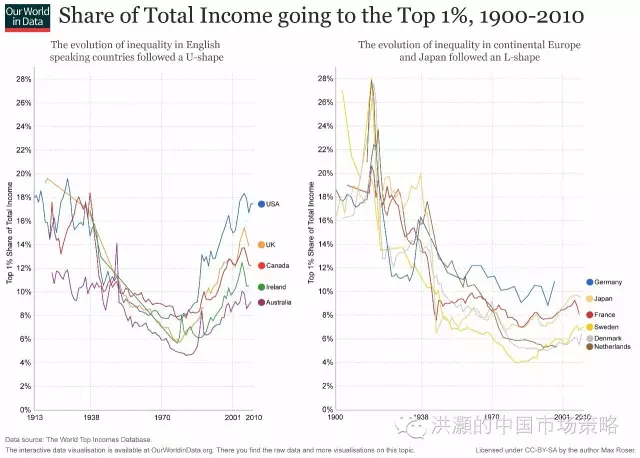
Productivity gain not adequately compensated is also a cause of income disparity: As the proletariats were exploited, the rich grows richer, and income disparity rises. With more than a hundred years of data, we observe that the trend of income disparity growing since the 1980’s, concurrent with a narrowing gap between labor wage growth and productivity gain.
Such dramatic disparity has occurred before, in 16th century Spain, 17th century Holland, the Gilded Age and the Roaring 20’s in the U.S. These eras are all weaved with disruptive productivity gains from technology breakthrough, creative financial innovation, cooperative governments, and an influx of immigrants and conquests of rich lands overseas. The trend was best exploited by the rich and educated of the time (Focus Chart 4).
That said, the different experience between the Anglo-Saxon countries, represented best by the US and UK on the left-hand side of Focus Chart 4, and the continental European countries and Japan on the right-hand side, suggests that the income disparity is partly institutional. That is, different social redistribution systems can alleviate or aggravate income disparity. There is a choice, and the proletariats are now demanding it.
Focus Chart 4: Productivity gain in adequately compensated is a cause of income disparity.
Underpaid labor relative to productivity gain suppresses inflation; it is why bonds have outperformed equities: One of the most confounding questions over the past three decades is the significant outperformance of bonds versus equities, and when such secular trend will revert. The division of the reward from productivity gains between the owner and proletariats has been uneven. Yet on top of this productivity relationship sits the capitalist (the creditor, or the bond owner) who is willing to lend to the owner (the debtor, or the equity owner of the business). The owner in turn reaps benefits from productivity gains by underpaying labor. Intuitively, in this relationship, the creditor must have gained more than the debtor. Otherwise, the creditor himself would be setting up his own shops. In short, bonds owned by the creditor outperform equities owned by the debtor.
Focus Chart 5: Productivity gain not adequately compensated is why bonds have outperformed equities.
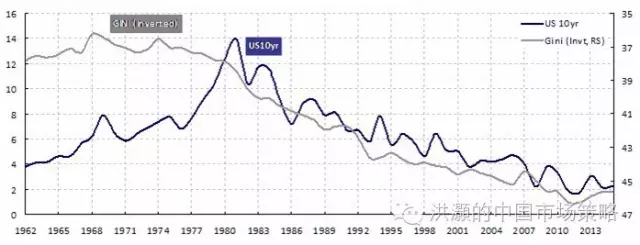
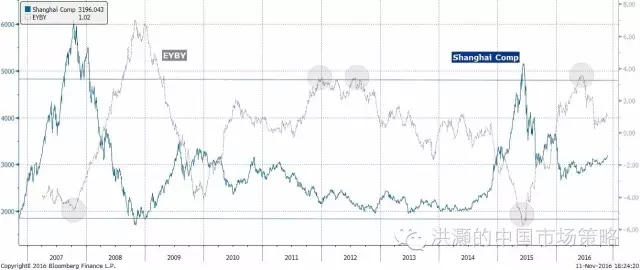
But as proletariats are roused, this relationship is about to invert (Focus Chart 5), and bonds should start to underperform bonds. And the secular trend may have already begun. In China, our bond yield vs. earnings yield model (EYBY model hereafter), which has helped us pinpoint the peak of China’s stock market bubble in June 2015 and negotiate the rough waters after the bubble burst, is showing relative value of equities relative to bonds, too (Focus Chart 6).
That said, EYBY’s relative value saw a significantly higher peak in 2008 that eventually corresponded to the market bottom. The local peaks in 2012 did not correspond to the eventual lows of the market. As equities relative value improved, the rotation should slowly progress, in tandem with surging market volatility, and volatility spill across asset classes.
Focus Chart 6: Chinese equities showing relative value to bonds; rotation will likely begin, with surging volatility.
The Rise of Inflation
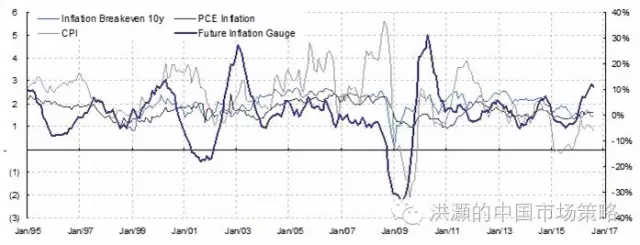
Inflation is rising and understated: As wage growth accelerates, and starts to outpace productivity gains, inflation pressure should rise. Conventional inflation measures, such as US core CPI and the PCE price index are showing a tepid inflation picture. But ECRI’s Future Inflation Gauge (FIG), is already showing surging inflation pressure to a level not seen since the 2009 recovery (Focus Chart 7). Meanwhile, even though the traditional measures are still low, they have all risen substantially from their lows, especially Core CPI. And Chinese PPI has climbed speedily back to above zero, after staying in the deflationary territory for more than four years.
In the past, in the absence of the gold standard, there is no way to protect savings from confiscation through inflation. Deficit spending, as proposed by Trump, is simply a “scheme for the hidden confiscation of wealth”—in Greenspan’s own words. One of the most effective methods of devaluation in stealth, or the confiscation of private wealth, is through an understatement of inflation. Indeed, governments around the world have been tinkering at their official CPI calculations to weave a false facade of calm inflation.
The Reagan administration, for instance, substituted home purchasing cost with rental cost in the consumption basket in 1982 to produce lower inflation and higher economic growth. Under the Bush Administration, hedonic adjustments were introduced. And early 2011 in China, the NBS reduced the weight of food in the CPI calculation. Coincidentally, food inflation, and pork in particular, has accounted for ~70% of the increase in price in the CPI of June 2011. Without prior adjustments, China’s CPI is likely to come in substantially higher than the 6.4% reported.
Inflation can prick the secular bond bubble: A consistent rise in inflation will mean a regime switch for bond allocation globally. Inflation is likely to be approaching an inflection point in the current cycle, and structural inflation is on the cards for China. The massive savings today in China is in itself an important source of looming secular inflation. That said, all price revolutions in history have also transcended human society, with blissful periods of equilibrium: medieval civilization, the Renaissance, the Enlightenment and the Victorian era. And such asset rotation will usher in epic market volatility as it progresses. The recent surge in VIX is a glimpse of a looming great rotation.
Focus Chart 7: Future Inflation Gauge rising; core CPI understating inflation pressure.
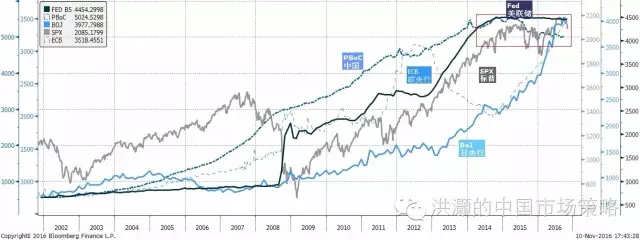
Central banks’ balance sheets plateau; effectiveness of monetary policy waning: After years of QE, the central bankers now look a little jaded, and their balance sheets have finally stopped expanding. After all, the Fed has entered a rate-hike cycle, after seven years of QE; the ECB’s balance sheet now levels with its peak in 2012 when it first started the covered bond purchase; the BoJ is running out of alphabets to describe what it is doing, with QE in place for well over a decade, QQE for three years and now initiating QQEYCC. At this rate, the BoJ will own 70% of all JGBs in 2018; and the PBoC once has the largest balance sheet of all major central banks, but now starts to shrink (Focus Chart 8). If central banks’ purchase is one of the forces that have suppressed long yields, now it appears to be receding.
Focus Chart 8: Balance sheets of central banks plateau. Effectiveness of monetary policy waning.
Global Equities Allocation Outlook
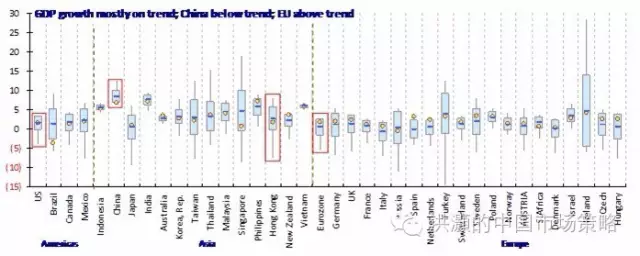
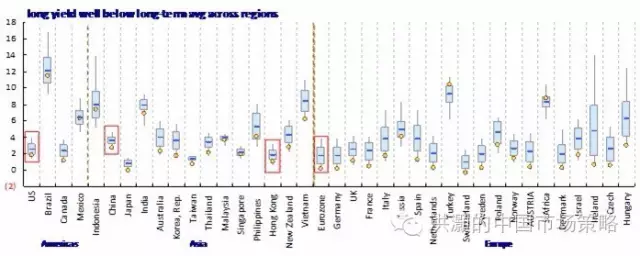
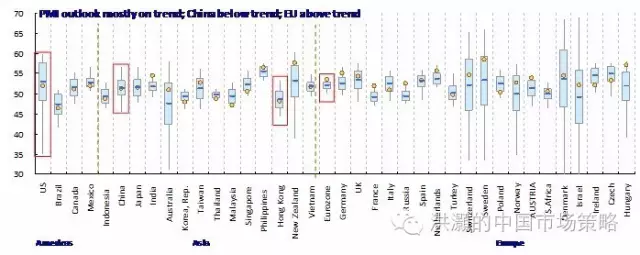
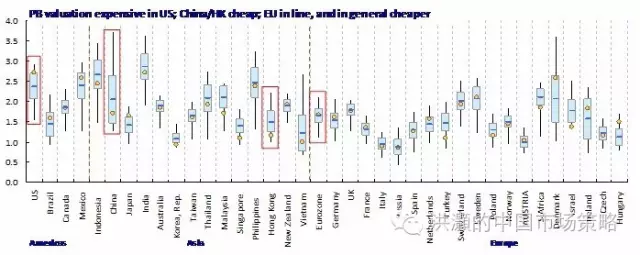
Growth, liquidity, outlook and valuation checks: If equities are set to outperform bonds on a relative basis, we examine across the globe on the metrics of growth, outlook liquidity and valuation to see which regions offer the best prospects for allocation. We can show that growth globally is largely on trend while growth outlook remains stable. Long yields, a measure of liquidity, are very low relative to the long-term trend across countries, and are difficult to fall much lower. The US valuation is expensive, EU is neutral, and China and Hong Kong offer reasonable value (Focus Chart 9 -10).
Focus Chart 9: Growth mostly on trend; long yields around historic lows, room to fall further is limited.
Focus Chart 10: Growth outlook mostly on trend; China/HK valuation not expensive.
Hao Hong, CFA
2016-11-13
【原文链接】价格的革命 – 对全球资产配置的思考